Informatics, cartography in water management

Comparison of VTEI citations in the Web of Science and Scopus databases

A journal’s citation rate is an indicator of its quality. The presented study builds on analyses of the citation rate of the VTEI journal published in previous years. A new analysis of VTEI journal citations using Web of Science data was conducted and the citation analysis using Scopus data was updated. A comparison of citations in both bibliometric databases was performed to determine the degree of overlap between the two databases and whether it is more appropriate to monitor the citation rate in one or both bibliometric databases. The citation analysis confirmed a high degree of overlap between the two databases. For monitoring the citation rate of the VTEI journal, it is sufficient to track citations in the Scopus database; unique citations found in the Web of Science database represent only a small portion of all citations. The citation analysis also confirmed the increasing trend in the number of citations of articles published in the VTEI journal, which was noted in previous years.

QFIELD – mobile application for data collection established on the principles of open source software

Acquisition of primary spatial data (geodata) in the form of a field survey (i.e. direct contact of the surveyor with the observed object or phenomenon of the real world) can undoubtedly be described as the most demanding method of their acquisition in terms of time and financial costs. However, in the past ten years, there has been a sharp turnaround in the field of mobile mapping. With the introduction of smartphones and laptops (tablets), countless applications for field data collection have been developed. Combined with Open Source tools, mobile data collection activities have become widely available to both professionals as well as the general public. One of these applications is QField. It is a multi-platform mobile GIS designed primarily for Google Android, Apple iOS, and Microsoft Windows platforms. Its user interface is strikingly similar to that of the QGIS desktop app, giving the false impression that the mobile app is part of it. However, it is stand-alone software developed by an Open Source solutions group, OPENGIS.ch, whose compatibility with the desktop application is ensured by another element, a plugin.

Development of the RainWaterManager software tool

Rainwater management is currently one of the frequently discussed topics in the further territorial development of towns and municipalities. The same question is also addressed in the context of climate change and its effect on already existing urban areas. Currently, the most common solution for the disposal of rainwater is its drainage using sewage systems. In connection with climate change, this concept of rainwater management is beginning to show its disadvantages. Rainwater is quickly drained away, which negatively affects moisture conditions in the urban landscape. The consequence of this is its drying and overheating. Another disadvantage is overloading of sewer networks during extreme rainfall events. The solution to eliminate these disadvantages can be an effort to retain the precipitation at the point of impact. However, this concept brings with it a number of questions: What measures can be used for this purpose? What are the spatial requirements for creating these measures? What is the price of their implementation? Can local government demand implementation of these measures by private investors? the answers to these questions are often not trivial and depend on the specific circumstances and the number of assessed criteria. Some help in this regard comes from the RainWaterManager software. This tool helps to choose appropriate measures for rainwater management, to estimate its effectiveness, spatial and economic requirements, and shows how their implementation can be promoted.

Graphical use of AI

In the June VTEI issue, we got familiar with the AI tool ChatGPT in the form of an “interview”. We continue with the topic of artificial intelligence and this time we present experiences with a more “visual” tool. Our intention was to create different visualizations of the situation using text input, the so-called “prompt”, or from a master photo, for example a watercourse restoration or the idea of building a water tower in the country-side. But before we get to the visualizations themselves, let us say a few words about this topic.

Development of pond locations in the Polabí lowland since the mid-19th century – part 1 – Pardubice region

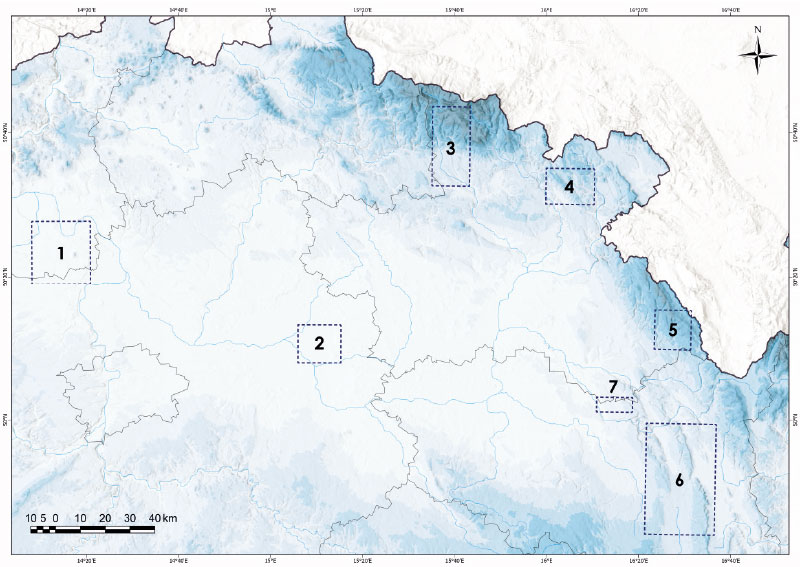
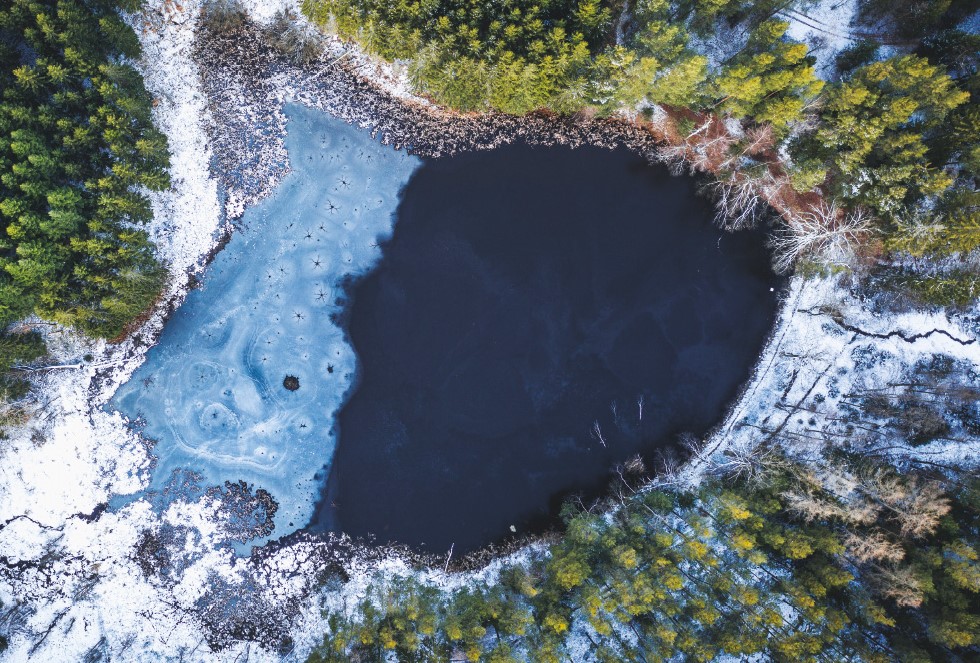
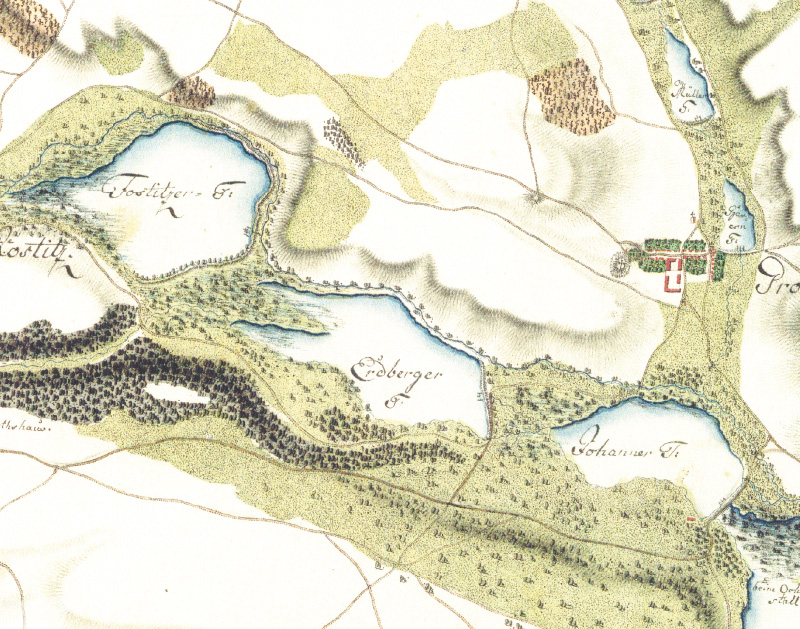
This article focuses on mapping the development of the lowland landscape over the last 180 years, related to pressures to use lowland areas for economic purposes, including transformation of wetland habitats (specifically ponds) into arable land.  The Polabí lowland was chosen as the study area because it is currently affected by a lack of water and there is an occurrence of seasonal drying up of small watercourses. This issue will probably be of greater significance in the future, particularly in the context of the expected continued extreme climatic phenomena. Within the Polabí lowland, the results from the Pardubice region (where the biggest change in pond locations occur) are presented here. The area of all types of ponds (according to their stability) makes up 6.83 % of the study area. According to their occurrence from the Second Military Mapping (1836–1852) up to 2022, the ponds were divided into disappeared, continuous, and new. Disappeared ponds have the largest representation – about two-thirds of the total pond area according to stability. They are followed by continuous ponds, and the smallest area is represented by new ponds. The historical, or more precisely, disappeared ponds were more robust than the present ones, i.e., they had a larger average size. Analyses show that almost half of the disappeared ponds have been replaced by arable land.

AI – our first interview

The idea of interviewing artificial intelligence was brought to us by an article from a completely different field than our water management. However, we also had the idea to test the current level of artificial intelligence on topics that are close to our field. Based on examples of questions and generated answers, you can judge for yourself how useful this tool is in water management. The structure of the questions is built from the simplest to the most complicated in the form of comments on the results of forecasting models, or the effectiveness and efficiency of legal regulations and directives. ChatGPT was chosen for communication. However, if one does not try this tool, one has no idea what it is; it is then up to you to assess the interview itself.

Landscape changes in selected locations of the Polabí lowlands with a focus on wetlands

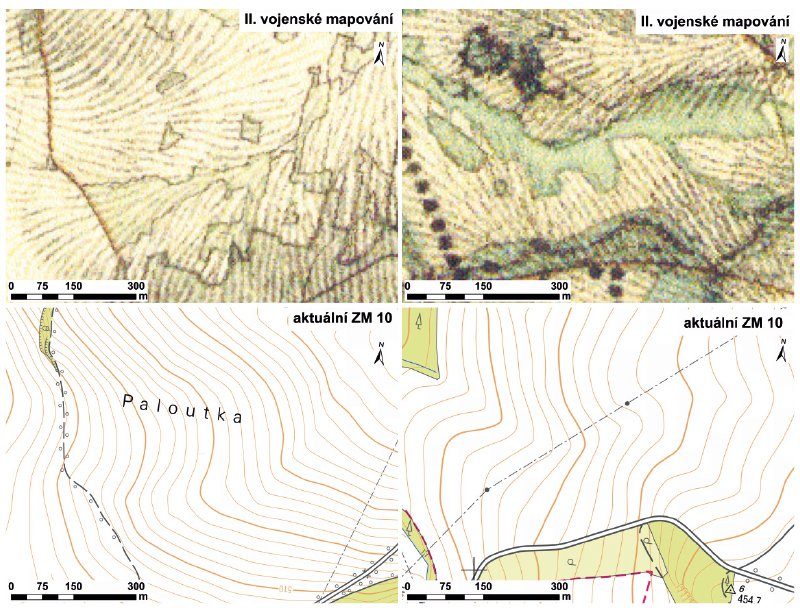
This article presents three typologically different sites from Polabí where large-scale wetland sites were located in the past, including ponds. These sites were chosen in order to present disappeared floodplain meadows, disappeared “field” wetlands, disappeared ponds or pond systems, and, simultaneously, to present sites where wetland habitats have been at least partially restored. The main aim was to present easily accessible archival maps, on the basis of which it is possible to assess the spatio-temporal dynamics of wetland habitats in the places of disappeared wetlands with regard to their possible restoration.

Use and popularisation of historical and current water management sources of information for the development of an environmentally friendly society

Since time immemorial, research in all scientific fields has brought countless new information and broadened the spectrum of current knowledge. In the past, research was made more difficult by the then possibilities of disseminating newly acquired knowledge. Many scientists in the world have asked
the same questions, proposed and tested similar hypotheses, obtained similar scientific results, and reached their own unique conclusions. The problem was the very limited possibility of sharing this new information, thus the possibility of their mutual use and very often their preservation and availability to
future generations. It is safe to say that in the history of science, a huge amount of knowledge and information was discovered that was not used enough, was discovered repeatedly, or was completely lost.

River ferries on old topographic maps

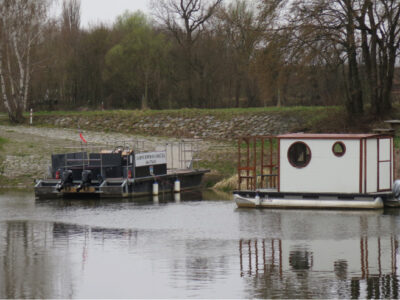
Medium and large rivers were a major obstacle to historic trade routes and trails. River ferries were one of the main ways to cross them, so their sites were considered points of strategic importance. Using old topographic maps from Austrian military mapping from 1763–1768, 1836–1852, 1876–1880, Prussian military maps from 1825 and 1877, and Czechoslovak military maps from 1953–1957, we systematically located ferries throughout the current territory of Czechia. Map keys from individual mappings were also analysed to examine how ferries are depicted on these maps. Based on the study of old topographic maps, a geographical database was created with the location of individual ferries, including the period in which the river ferry was registered. A total of 514 historical ferries were recorded on old topographic maps from military mapping throughout Czechia; another 28 ferries were identified from other available, more detailed, map sources.

Citation analysis of VTEI

The citation rate of a journal is considered an indicator of its quality. This study presents a citation analysis of the VTEI journal, published by the T. G. Masaryk Water Research Institute (hereinafter TGM WRI). The citation analysis was conducted to identify the countries and institutions of authors who cite articles published in VTEI and the subject areas in which articles published in VTEI are cited. The identification of citing articles was complicated by the wide range of forms of VTEI journal title notation, as well as errors in the Scopus database. Therefore, the search was performed in several steps and the search query was gradually expanded. Descriptive statistics methods and cluster analysis using VOSviewer software were used for the analyses. A total of 126 publications were searched in the Scopus database, but only 108 publications were included in the analysis. These 108 articles quoted 152 articles published in VTEI. The number of VTEI citations has increased from sporadic citations prior to 2009 to more than 20 citing publications in 2020 and more than 30 cited publications in 2021. The majority of citations were received by articles published in VTEI within the first six years of publication, and the citation rate for articles published between 2009 and 2021 is relatively even. Authors from 66 institutions in 16 countries, mainly in Europe, contributed to the citing publications. However, authors from the Czech Republic were dominantly involved in citations and, in many cases, these were authors of articles published in VTEI. The main areas where articles published in VTEI are cited are environmental sciences, specifically the impacts of climate change on water management and hydrology, and water quality assessment using the water footprint.
Development of citations of the magazine VTEI

This article is available in Czech only. For translation or more information on this topic, please contact author. Časopis Vodohospodářské technicko-ekonomické informace (VTEI) vychází již 63 let. Zároveň je to pět let od ukončení spolupráce s časopisem Vodní hospodářství a začátku vydávání časopisu VTEI v současné modernizované podobě. V úvodním slovu k číslu 4–5/2015, jež… Read more »

Automatic watershed delineatiom in Czech republic using ArcGIS Pro

Manual watershed delineation by watershed divides has traditionally been performed by means of an analysis of topographic maps and contour lines. With the availability of digital elevation models, watershed and streams delineation is performed automatically, which reduces the time spent on manual delineation. In this study, we introduce the process of automatic delineation and the models available within the toolbox Arc Hydro Tool Pro, created by the company ESRI for the ArcGIS Pro software. Automatic delineation was implemented by means of different methods for selected watersheds in the Czech Republic, varying in area and elevation.

Zero isochion in the framework of geomorphological regions in Czechia: its extraction from the MODIS imagery and its dynamics

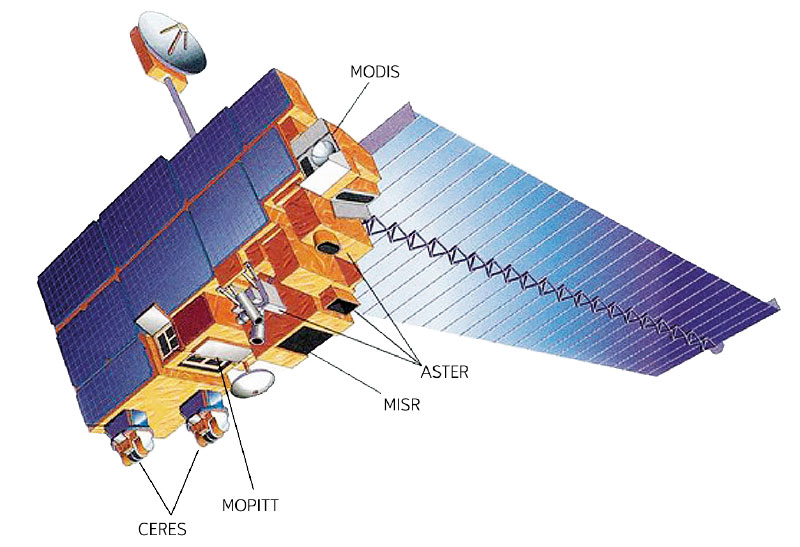
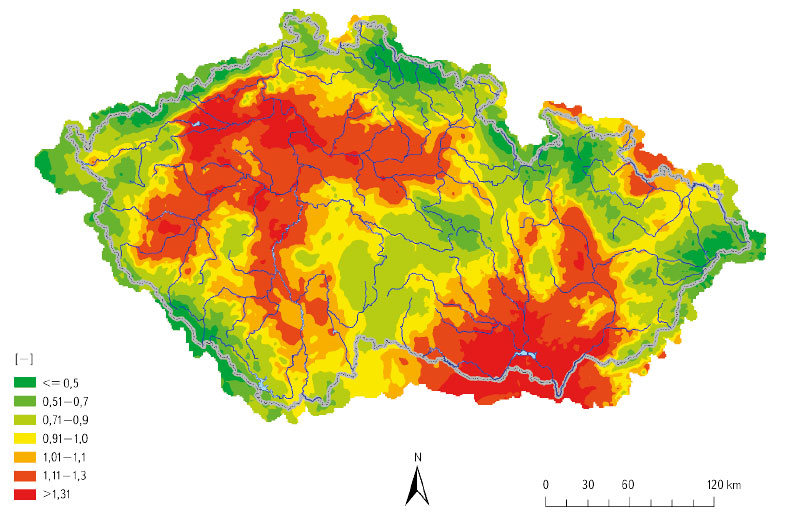
Since December 2012, during every winter season, the altitude of the zero isochion (snowline) has been determined at the Czech Hydrometeorological Institute for the purposes of operational hydrology. The reason is the estimation of the amount of water stored in snow cover, which is inevitable activity for Czech hydrologists who naturally want their forecasting models to give relevant results. In order to get a better idea about current spatial distribution of snow cover in Czechia, the information on the zero isochion has been extracted from the MODIS imagery coming from the Terra satellite.

Practical examples of using GIS in hydrology at the Czech Hydrometeorological Institute

GIS technologies are widely used in the Hydrology Department of the Czech Hydrometeorological Institute (CHMI). The processing of geospatial data, which are used in hydrology for analytical tasks, and the development of GIS technologies in the last two decades have contributed to the spread of GIS in the CHMI practice. The use of GIS tools is shown in four examples. The first one focuses on the creation of GIS data. The second example concerns the preparation of input source data for the derivation of the hydrological characteristics of M-day discharge, which, according to Czech Standard 75 1400 Surface water hydrological data, are among the basic hydrological data. The third example describes the use of GIS in the preparation of hydrological assessments according to the above-mentioned standard (75 1400), which usually result in M-day or N-year-flood discharges in a specified profile of a certain watercourse. The fourth example focuses on the use of GIS in operational hydrological service, specifically in the development of the Flash Flood Indicator, which determines the level of risk of flash flood formation or occurrence based on current land saturation and radar rainfall estimates.

IAHS International Commission on Remote Sensing

The International Commission on Remote Sensing (ICRS), as one of the current ten scientific commissions under the umbrella of the International Association of Hydrological Sciences (IAHS; [1]), has emerged as a logical response to the availability of spatial data associated with the launch of the first satellites in the 1970s that were designed to observe the Earth’s landscape sphere from space, providing a completely new perspective in which the spatial extent of the territory under observation played the major role.

GIS and cartography at the T. G. Masaryk Water Research Institute

Geographic information systems (GIS), data processing, evaluation and interpretation are an essential and integral part of research at present as most information can be related to a specific location on the Earth’s surface. The GIS and Cartography Department at the T. G. Masaryk Water Research Institute deals with research and commercial projects by means of the application of GIS tools.

Problematics of archive map data interpretation, specifically the wetland habitats

The article presents available on-line archive maps from the websites of the Archive of the Surveying Office and the Geoinformatics Laboratory of the J. E. Purkyně University, that provide an overview of the historical wetland habi-
tats location. The main research question is to find out the potential use of historical maps for the identification of the historical wetlands in the Czech Republic and the evaluation of various interpretations of wetland habitats based on these sources. Examples of wetlands on historical map data in the upper part of the Výrovka River basin are presented.

The analysis of agricultural landscape development shown on selected cadastral districts in the upper part of the Výrovka River basin

V tomto článku jsou ve vybraných katastrálních územích s převažující plochou zemědělské půdy porovnávány aktuální land use a struktura krajiny s historickým stavem z podkladů Císařských povinných otisků stabilního katastru. Jsou zde nastíněny možnosti využití analýz historického vývoje krajiny ke krajinné obnově v zemědělských oblastech, zejména s ohledem na obnovu mokřadních ekosystémů a revitalizaci vodních toků.

TGM WRI HEIS: 25 years of development and operation of the information system

V letošním roce je tomu rovných 25 let od zahájení vývoje (a následně pak provozu) Hydroekologického informačního systému VÚV TGM (HEIS VÚV). Tato doba je z hlediska kontinuálního vývoje a provozu informačního systému v současném prostředí takřka neustálých technologických a organizačních změn téměř úctyhodná a zcela jistě si zaslouží jak alespoň malé ohlédnutí za uplynulým obdobím, tak také stručnou rekapitulaci zaměřenou na současnost informačního systému (čtenář může namítnout, že zde by se nabízelo zmínit se podrobněji i o výhledu a plánech do budoucnosti, v této oblasti si však spekulovat příliš netroufáme, a proto ji zmíníme pouze stručně v závěru textu).

Surface Water Status Assessment for the Third Cycle River Basin Management Plan of the Czech Republic

The aim of this article is to acquaint the professional public with the summary results of the assessment of chemical status and ecological status/potential of surface water bodies “river” and “lake” categories in the Czech Republic for 2016–2018.
This assessment is one from the basis for preparation of the Third River Basin Management Plan (2021–2027) at all its levels: sub-basin plans, national plans, and international plans of the Elbe, Danube, and Oder river basin districts.

The trajectory of wetlands development in the upper part of the Výrovka river basin over the last 180 years

The article is focused on analysis of the change of wetlands coverage and the representation of various types of wetlands in the upper part of the Výrovka river basin over the last 180 years. The historical maps of the Stable Cadastre, current orthophotographs and GIS layers of actual localization and classification of different types of land cover were used as data sources.

NAVAROSO expert information system

Příspěvek podává informaci o tvorbě expertního informačního systému NAVAROSO, budovaného pro potřeby složek aktivních při vzniku havarijní situace na vodách. Systém poskytuje křížově provázané údaje, potřebné pro rychlé získávání informací o možných příčinách zhoršení jakosti vod, postupech k určení typu znečištění a odhadu jeho šíření ve vodoteči.

The Clean Water – a Healthy City: The usability of the existing information collection system to fulfillment of goals

Příspěvek představuje část projektu Čistá voda – zdravé město, který se zabývá predikcí možného výskytu nebezpečných chemických látek v tocích při haváriích a povodních. Seznamuje s databázemi, které jsou v současné době k danému tématu vedeny, a s jejich praktickou využitelností.

Mathematical estimation of watercourse bathymetry – Bathy_supp software

Topografické údaje hrají klíčovou roli v otázce přesného hydrodynamického modelování povodňových událostí. Často je vyžadován přesný digitální model terénu (DMT), který obsahuje popis říční batymetrie. DMT může být získán z různých zdrojů dat, jako jsou pozemní měření nebo metody dálkového průzkumu země.

The database of water resources protection zones in the Czech Republic

Databáze ochranných pásmem vodních zdrojů (OPVZ) vznikla ve Výzkumném ústavu vodohospodářském T. G. Masaryka, v. v. i., (dále jen VÚV TGM) přibližně v roce 2004. V následujících letech proběhla řada dílčích aktualizací. V letech 2015–2017 byl v rámci podpory výkonu státní správy Ministerstva životního prostředí ČR (MŽP) řešen projekt s názvem Aktualizace OPVZ v ČR.

Possibilities of using old topographic maps from the years 1763–1768 for evaluating the development of water bodies and the potential for their renewal

Potenciál obnovy vodních ploch je aktuálním tématem v současném krajinném plánování. Nejčastěji jsou na území České republiky zkoumány vodní plochy na starých topografických mapách od poloviny 19. století, na kterých je již velmi dobrá polohová přesnost topografického zákresu.

Water towers – research project mapping the development and a form of tower water reservoirs on our territory

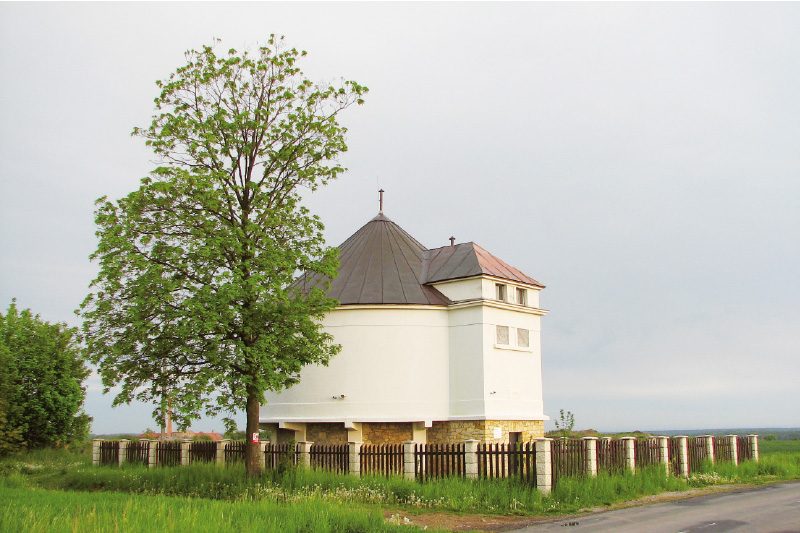
The paper presents a summary of input information about the research project Water towers – identification, documentation, presentation, new use. It deals with the development of tower water reservoirs in the present territory of the Czech Republic from the beginning of their creation to the present.
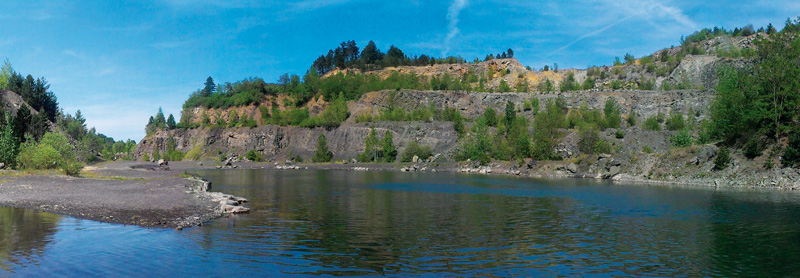
Bathymetric measurement for determination of morphology of water reservoir bottom

Information and communication technologies are currently one of the decisive factors influencing economic and social development. Similar developments and trends in relation to information and communication technologies can be observed in the field of water management.
The assessment of the status of surface water bodies in the Czech Republic for the period 2013–2015

This article aims to present to the general public the results of the assessment of the ecological status/potential and chemical status of surface water bodies categories “river“ and “lake“ for the period 2013 to 2015 in the Czech Republic. The assessment was carried out in 2017 by the Water Research Institute of T. G. Masaryk, p. r. i.

Possibilities of extrapolation of digital terrain model raster DMR 5G

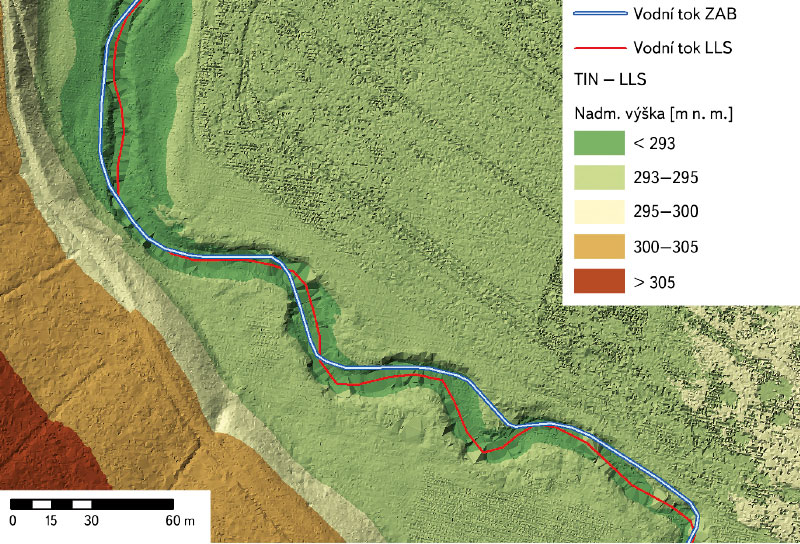
Airborne laser imaging (LiDAR) has been carried out throughout the Czech Republic, enabling the creation of raster of digital model of terrain. This material is widely used in various fields. From the point of view of hydrology demands, however, the shortcoming of this technology resides in the absence of accurate/complete channel topography due to the absorption of the near-infrared laser beams by water.

Surface water body typology category river in the 1st and 2nd cycle of River Basin Management Plans and its consequence to ecological status assessment

Surface water body delineation and setting a typology are one of the initial steps during Water Framework Directive implementation (WFD) [1]. The first delineation and typology was prepared in 2004–2005 for the first plans, but all the results were significantly changed in the second cycle 2009–2010.