Occurrence of pesticides in the Punkva river

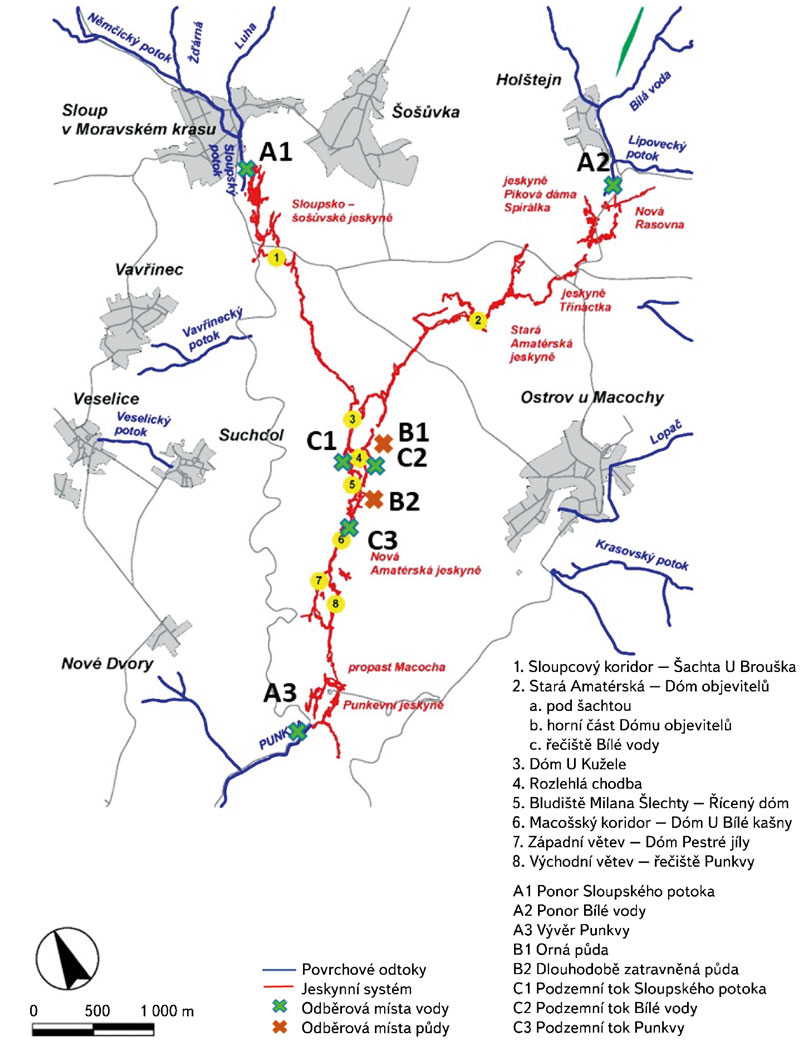
The Moravian Karst is the largest and most karstic area in the Czech Republic, and, as such, it is a protected landscape area (PLA). The karst area occupies a strip of Devonian limestone north of Brno. The north part of Moravian Karst is drained by the river Punkva and its headwaters. One of the biggest cave systems in central Europe is located there, Amaterska cave, which is more than 40 km long.
Despite the strict protection measures that are in place in the PLA, the presence of pollutants and potentially hazardous substances has recently been detected in the Punkva river and its catchment. The sources of this pollution are found both within the territory of Moravian Karst PLA and in the river´s catchment, and they are related to anthropogenic activities and land use. This article focuses on the occurrence of pesticides, especially triazine and azole pesticides and their polar metabolites. In 2020, a new significant contaminant, 1,2,4-triazole, a common relevant metabolite of azole pesticides, was found at the site concerned. These substances can have fatal effects not only on the endemic organisms living in the Moravian Karst, but they can also endanger human health because the local groundwater is used as a source of drinking water. Thanks to the studies carried out, the protection zones around the cave system have been extended, reducing the negative effects of agricultural activities in the area of interest.
Monitoring changes in the landscape development on the northeastern edge of the Hřebeny Mountains with a focus on wetlands

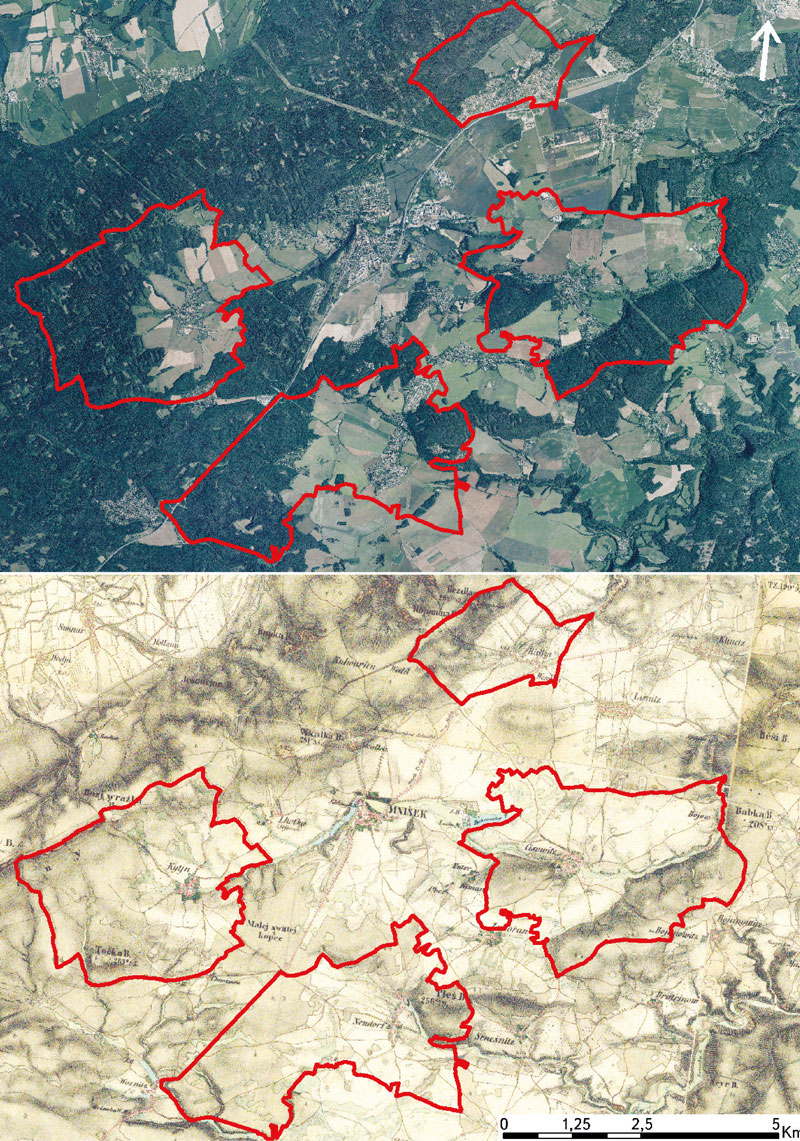
This article deals with changes in wetlands on the north-eastern edge of Hřebeny Mountains in the last 180 years. It assesses the dynamics of these landscape elements in space and time. The cadastral areas of Čisovice, Řitka, Kytín, and Nová Ves pod Pleší were selected, with a total area of 3,785.57 ha. Analysis was carried out on the basis of the Imperial obligatory prints of the maps of the stable cadastre from 1840, an orthophotomap, and field research from 2020; it distinguished wetlands in the monitored area into continuous, extinct and new. The background data were processed in ArcGIS software, version 10.7.1. The area of wetlands decreased from 289.34 ha in 1840 (7.6% of the monitored area) to 39.26 ha in 2020 (1.04% of the monitored area). Based on the study of available data, three types of wetland habitats were classified: wet meadows, wet meadows with woody plants, and ponds.

Comparison of hydrological characteristics of M-day discharges of the reference period 1981–2010 and the considered reference period 1991–2020

According to the Czech technical standard ČSN 75 1400 Hydrological data of surface waters, M-day discharges are a part of the Basic hydrological data [1]. The values of M-day discharges in water gauging stations are derived from time series of observed mean daily discharges over a defined reference period. The reference period 1981–2010 is currently used for design purposes [2]. With the end of the second decade of the 21st century, a change in the reference period for 1991–2020 is being considered. In the past, the Czech Hydrometeorological Institute (CHMI) provided hydrological data for the reference periods 1931–1940, 1931–1960, and 1931–1980.

Balance evaluation of selected water quality indicators on the tributaries of Vranov reservoir

Most of the reservoirs in the Czech Republic have been built as multifunctional reservoirs, with the basic functions being storage and protection. The way the catchment area upstream of a reservoir is used has a significant impact on water quality. Pollution sources can be divided into point, area, and diffuse sources. Being continuous or recurrent, point pollution is not significantly influenced by meteorological factors and it is linked to narrowly delimited areas such as settlements, wastewater treatment plants (WWTPs), industrial plants, agricultural facilities, etc. Area pollution is difficult to observe as it is irregular and depends on meteorological, soil, morphological, and vegetation characteristics [4]. The category of diffuse sources usually includes small diffuse point sources of pollution, namely municipal, agricultural, industrial, as well as traffic pollution, leachates from landfills, etc.

The AdaptaN II Project – from words to action

Over the last few years we have seen – let‘s not be afraid to say it – a flurry of different adaptation strategies, action plans, and other documents describing what to do to prepare for various problems, especially the impacts of climate change. It is therefore time to start fulfilling the ideas of the above-mentioned documents and putting them into practice. The project “Integrated Approaches of the Moravian-Silesian Region Landscape to Climate Change Adaptation” (abbreviated as AdaptaN II), which was launched in July 2021 and will last until 30 June 2024, also aims to contribute to the implementation of one of the above documents, namely the Adaptation Strategy of the Moravian-Silesian Region to the Impacts of Climate Change. This international Project is funded by the Norway Grants, „Bergen“ call for proposals, i.e. support for the implementation of selected nature-related adaptation and mitigation measures (the programme is administered by the State Environmental Fund of the Czech Republic).

Automatic watershed delineatiom in Czech republic using ArcGIS Pro

Manual watershed delineation by watershed divides has traditionally been performed by means of an analysis of topographic maps and contour lines. With the availability of digital elevation models, watershed and streams delineation is performed automatically, which reduces the time spent on manual delineation. In this study, we introduce the process of automatic delineation and the models available within the toolbox Arc Hydro Tool Pro, created by the company ESRI for the ArcGIS Pro software. Automatic delineation was implemented by means of different methods for selected watersheds in the Czech Republic, varying in area and elevation.

Zero isochion in the framework of geomorphological regions in Czechia: its extraction from the MODIS imagery and its dynamics

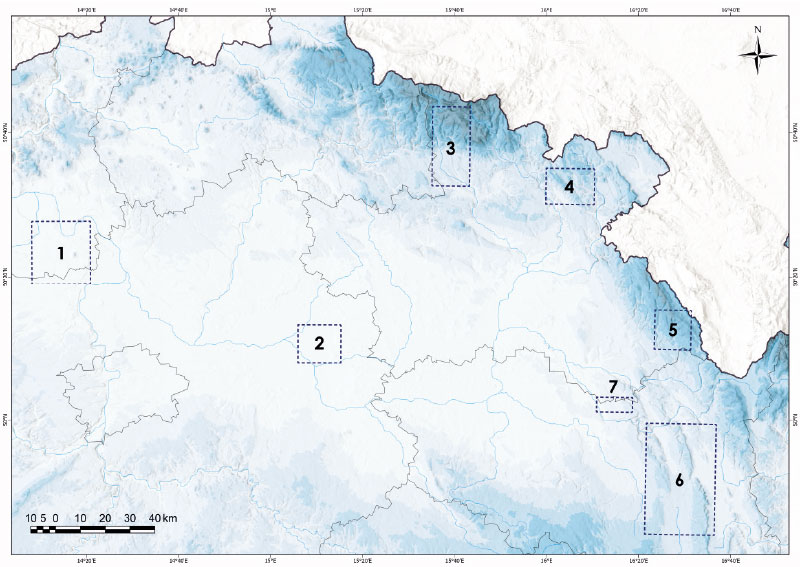
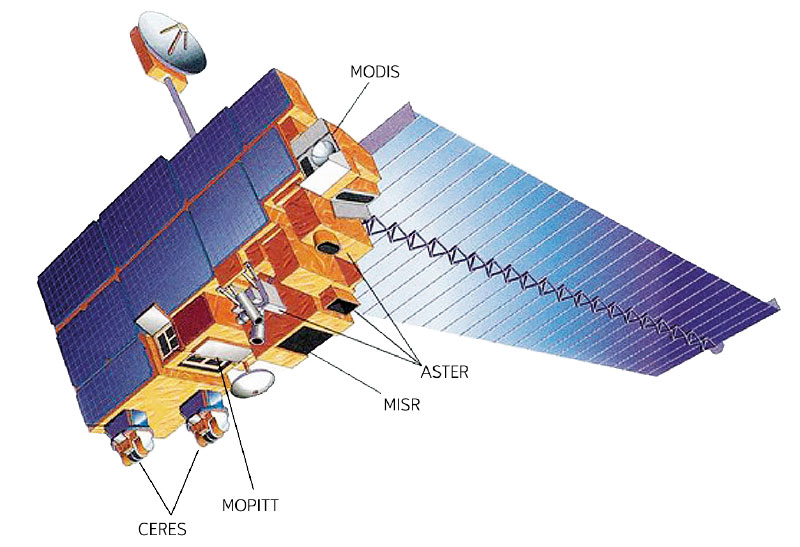
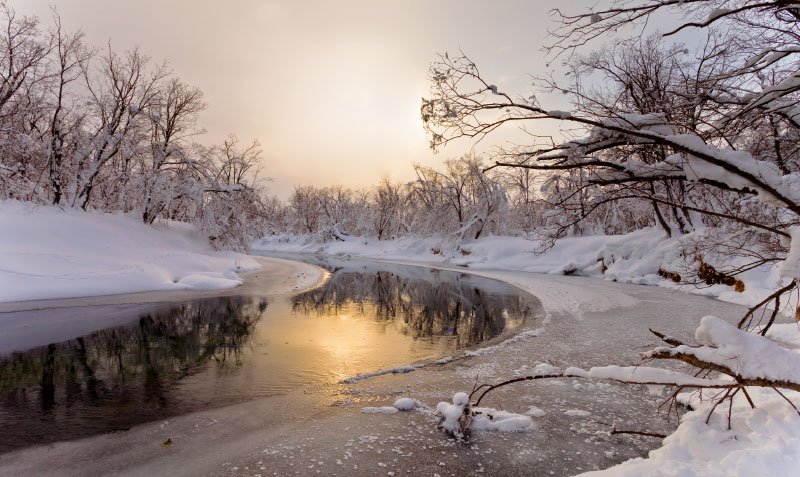
Since December 2012, during every winter season, the altitude of the zero isochion (snowline) has been determined at the Czech Hydrometeorological Institute for the purposes of operational hydrology. The reason is the estimation of the amount of water stored in snow cover, which is inevitable activity for Czech hydrologists who naturally want their forecasting models to give relevant results. In order to get a better idea about current spatial distribution of snow cover in Czechia, the information on the zero isochion has been extracted from the MODIS imagery coming from the Terra satellite.

Possibilities of using spectroscopy for the evaluation of forest soil properties

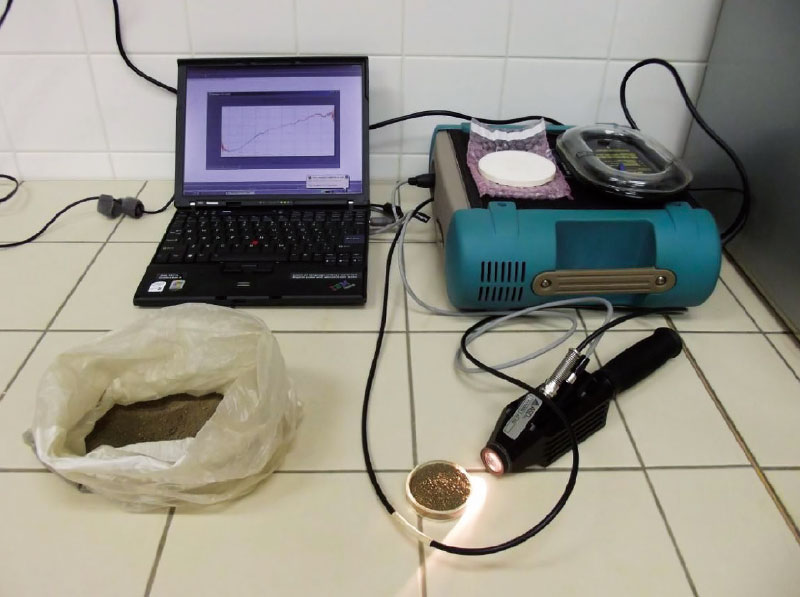
The aim of this study was an objective assessment of application of VNIR spectroscopy for predicting properties of forest soils. For each soil property were found the most appropriate combination of statistical methods for pre-processing (continuum removal, 1. derivation, 2. derivation) and processing (PLSR, PCR, SVM) of certain spectral bands. As generally successful shows a combination of methods 1. derivation and support vector machine throughout the VNIR spectral range (400–2 500 nm). In some cases, however, they proved to other models. Among the best predictable features include pH, content of oxidizable carbon, aluminum, iron, silicon, or calcium (at higher concentrations). Not very high success rate prediction was found in indicators that take low values (sodium, manganese, aluminum or ferrous complexes). The results show that VNIR spectroscopy method is applicable for predicting properties of forest soils. It can not completely replace traditional analysis, but it can very well complement, especially in practice. For example, when the soil mapping can help thicken network data and refine the information better than other methods of spatial estimation. It is applicable in cases where it is required large amounts of data in a short timeframe and at minimal cost. It is suitable for monitoring trends over time, or for a quick survey of an area.

Practical examples of using GIS in hydrology at the Czech Hydrometeorological Institute

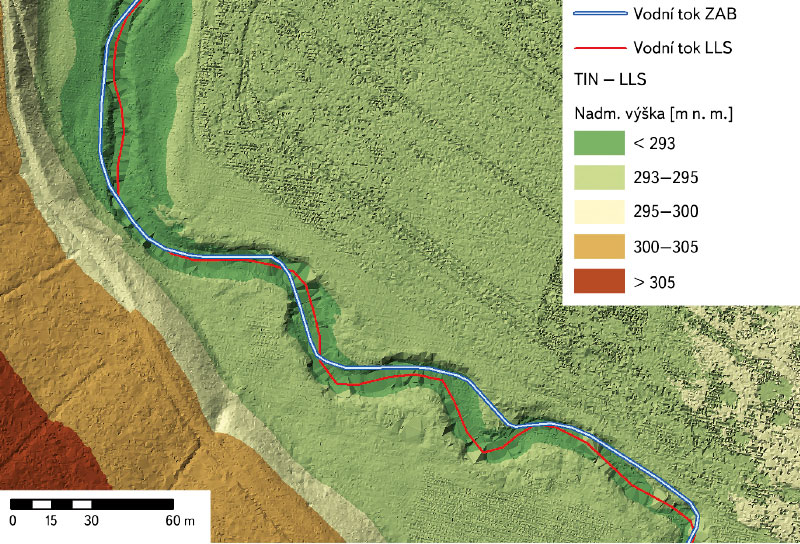
GIS technologies are widely used in the Hydrology Department of the Czech Hydrometeorological Institute (CHMI). The processing of geospatial data, which are used in hydrology for analytical tasks, and the development of GIS technologies in the last two decades have contributed to the spread of GIS in the CHMI practice. The use of GIS tools is shown in four examples. The first one focuses on the creation of GIS data. The second example concerns the preparation of input source data for the derivation of the hydrological characteristics of M-day discharge, which, according to Czech Standard 75 1400 Surface water hydrological data, are among the basic hydrological data. The third example describes the use of GIS in the preparation of hydrological assessments according to the above-mentioned standard (75 1400), which usually result in M-day or N-year-flood discharges in a specified profile of a certain watercourse. The fourth example focuses on the use of GIS in operational hydrological service, specifically in the development of the Flash Flood Indicator, which determines the level of risk of flash flood formation or occurrence based on current land saturation and radar rainfall estimates.

IAHS International Commission on Remote Sensing

The International Commission on Remote Sensing (ICRS), as one of the current ten scientific commissions under the umbrella of the International Association of Hydrological Sciences (IAHS; [1]), has emerged as a logical response to the availability of spatial data associated with the launch of the first satellites in the 1970s that were designed to observe the Earth’s landscape sphere from space, providing a completely new perspective in which the spatial extent of the territory under observation played the major role.

GIS and cartography at the T. G. Masaryk Water Research Institute

Geographic information systems (GIS), data processing, evaluation and interpretation are an essential and integral part of research at present as most information can be related to a specific location on the Earth’s surface. The GIS and Cartography Department at the T. G. Masaryk Water Research Institute deals with research and commercial projects by means of the application of GIS tools.