SUMMARY
Concentrations of selected heavy metals in collected atmospheric precipitation and surface water were monitored at pilot sites in the Jizera Mountains, Moravian-Silesian Beskydy Mountains, and Bohemian-Moravian Uplands (Czechia) over the course of one year to determine the significance of the impact of precipitation on surface water quality in an otherwise relatively low anthropogenically influenced environment. The measurements show that, for some metals, atmospheric deposition in heavily loaded areas can cause significant inputs to surface water. The resulting balance of substance load is strongly influenced by the environment and its load in the past.
INTRODUCTION
The Water Framework Directive (2000/60/EC) [1] requires EU member states to assess the state of groundwater and surface water in regular six-year cycles. In cases of failure to achieve good chemical and/or ecological status, it is necessary to determine the fundamental influences causing this situation and propose measures for its improvement. The assessment of the state of surface water bodies, which has been carried out in the Czech Republic since 2009 in accordance with Czech legislation in three-year cycles, repeatedly shows a high proportion of water bodies not achieving good chemical status in the case of certain priority substances according to Government Regulation No. 401/2015 Coll., and good ecological status in the case of some specific hazardous substances [2, 3]. Failure to achieve good status for some groups of substances is also recorded in water bodies where most of the potential anthropogenic influences can be excluded, and for which the possible main influence is the transfer of pollution to the aquatic environment from the air through atmospheric deposition. These groups mainly include heavy metals and polycyclic aromatic hydrocarbons (PAHs).
The TA CR project SS01010231 “Dopady atmosférické depozice na vodní prostředí se zohledněním klimatických podmínek (Impacts of atmospheric deposition on the aquatic environment with consideration of climatic conditions)” deals with this topic. The project builds on the methodology [4] which, among other things, based on available data, proposes procedures for assessing the danger for surface water bodies from the point of view of atmospheric deposition. The main problem with this part of the methodology was the unavailability of current and comprehensive data, as well as unverified procedures for their use. The aim of the project is to at least partially supplement these missing data and procedures.
Part of the project solution is the quantification of pollution in various environmental components using field monitoring in selected pilot forest catchments. The aim of this activity is to verify the extent to which individual substances can affect the situation in the real environment, and to identify other factors increasing the risk of contamination entering the aquatic environment.
Due to the breadth of the topic and the number of results, it was not possible to process all the findings in one contribution. This article presents the results of the representation of selected heavy metals in the matrices of surface water and precipitation water, which were collected as throughfall and bulk deposition. Additional separate articles will deal with PAHs, a more detailed assessment of the relationships between the load of individual environmental components, and the use of biological materials as an indicator of anthropogenic influences.
HEAVY METALS IN THE ENVIRONMENT
Due to their toxic effects, heavy metals represent a significant source of surface water pollution [5–7]. There are three decisive properties for determining the environmental hazard of metals: resistance, bioaccumulation, and toxicity. Heavy metals that are both persistent and bioaccumulative are more dangerous because they can accumulate in organisms and be transported from one environment to another [8]. Metals that occur most often in surface water and pose a risk to the environment are in particular: mercury (Hg), lead (Pb), cadmium (Cd), nickel (Ni), and arsenic (As), [9, 10]. In addition to natural causes, anthropogenic activities are also responsible for their occurrence in the environment, especially the burning of fossil fuels, industrial activities (metallurgy, surface treatment of metals and enamelling), the use of paints and pigments, and agriculture [11, 12]. Through emissions, heavy metals enter the atmosphere and from the air they subsequently deposit into water and soil [13]. Metal compounds occur in the atmosphere in the form of particles that are sorbed onto aerosol particles. The amount of metals in the aerosol varies throughout the year [14]. Other factors that influence the amount of metals in the atmosphere are: meteorological conditions, site location, possibilities of long-distance transport, and amount of emissions [15]. Long-distance transport of particles can take place in the atmosphere due to air masses, therefore high levels of heavy metal pollution can be found even in places without a direct source of pollution [16, 17]. From the atmosphere, heavy metals are transported to the Earth’s surface by deposition, which is driven by gravity and can occur through two mechanisms: dry and wet deposition. Dry deposition is slower and does not depend on precipitation, while wet deposition is faster and is affected by the amount of precipitation and the rate of capture of particles on the droplet surface [18].
METHODS USED
As part of the project, substances that cause poor water quality and at the same time are expected to be significantly transmitted through the air were examined and evaluated. Thus, the heavy metals As, Cd, Hg, Ni, and Pb were selected. From the point of view of the categorization of substances harmful to the aquatic environment, it should be mentioned that As is a specific pollutant, the other metals addressed in the project are priority substances, and Cd and Hg are priority dangerous substances.
To compare the presence of selected elements in different components of the environment, sampling of the following matrices was carried out in the model catchments:
- bulk deposition (monthly*),
- throughfall deposition (monthly*),
- surface water (monthly),
- river sediment (twice during the year),
- humus – a biologically stable humification layer (H, Oh horizon), after removal of litter layer (Ol) and fermentation horizon (Of) in the overburden
(1x – samples represent a longer period of time), - moss (1x – samples represent a longer period).
Note*: To determine the pollutants of interest in atmospheric deposition, it was necessary to obtain a sufficient volume of samples. In cases of insufficient rainfall, samples were taken after two months of exposure.
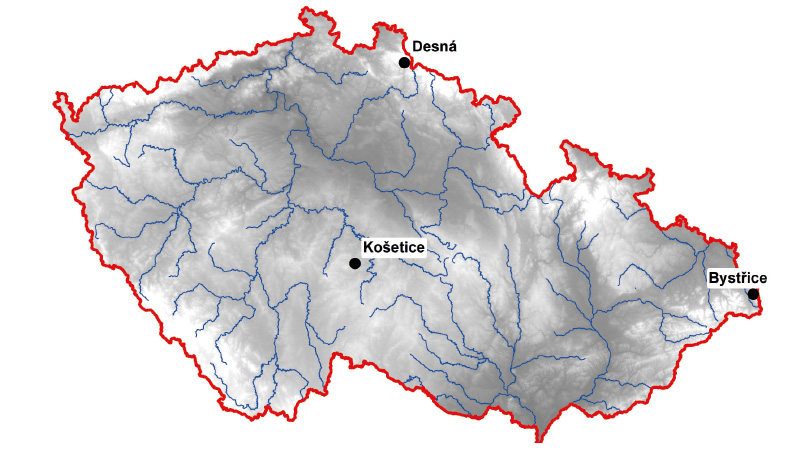
Fig. 1. Location of pilot areas
In water matrices, the total concentration of As, Cd, Hg, Ni, and Pb was determined by mass spectrometry and AAS-Hg methods. Spot samples of surface water were evaluated in the first part of the project by the ETA-AAS method for metals and AMA 254 for Hg. This is also the reason for higher detection limits for some of the results (for surface water in the first six months of monitoring).
For the project, model forest micro-catchments were selected, which were suitable for the monitoring of all the above-mentioned matrices and where, apart from the influence of the actual atmospheric deposition, other anthropogenic sources of pollution were not present.
The following catchments were selected as pilot areas:
- The area east of the Ostrava and Třinec agglomerations, which due to the prevailing air flow is heavily loaded with PAHs and heavy metals from the local power stations and industry, but at the same time it is a mountainous and forested area with no direct discharges into the watercourse. The model upper part of the Suchý stream basin in the eastern part of the cadastral territory of Bystřice has an area of 0.462 km2 up to the sampling point. Suchý stream is part of the catchment area of the HOD_750 – Hluchová water body from the source to the mouth of Olše, which in the third planning cycle does not reach good status due to the presence of PAHs. No other violations of Environmental Quality Standard (EQS) were detected. In the resulting tables, the catchment area is labelled Bystřice (BY), based on the nearest municipality.
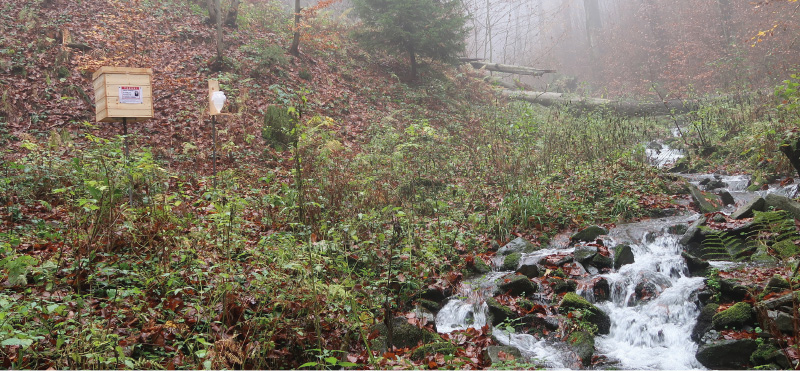
Fig. 2. Precipitation sampling in Bystřice pilot area
- The area of the Bohemian-Moravian Highlands, which is considered to be an area with clean air, mainly influenced only by local heaters. In addition, areas with significant logging are currently expanding in this site after the bark beetle outbreak. It is therefore possible to monitor how deforestation and logging contribute to the leaching of hazardous substances. In contrast, it was necessary to avoid places with current and past mining of mineral resources. The model basin of the Lesní stream, a tributary of the Anenský stream on the north-eastern edge of the cadastral area of the Košetice municipality and the nearby meteorological station of the same name, has an area of 0.292 km2 up to the sampling point. The stream is part of the catchment area of the DVL_0440 Martinický stream water body, which achieved good chemical status in the second and third cycles and EQS for selected substances were not exceeded. In the resulting tables, the catchment area is labelled Košetice (KO), based on the nearest municipality.
- The area of the Jizera Mountains, which in the past was particularly affected by emissions of Cd and other metals from the nearby glass industry, and possibly from coal-fired power stations on the Polish side of the Jizera Mountains (in recent years, however, the air quality has improved). The model catchment of the Hřebový (sometimes also Hřebenový) stream, which is a left-hand tributary of the Souš reservoir in the municipality of Desná and Kořenov, has an area of 1,029 km2 up to the sampling point. The stream is located in the catchment of the HSL_1896_J – Souš reservoir water body on the Černá Desná stream, which in the second planning cycle did not reach good chemical status due to exceeding EQS for Cd, and was not classified in the third cycle. In the resulting tables, the catchment area is labelled Desná (DE), based on the nearest municipality.
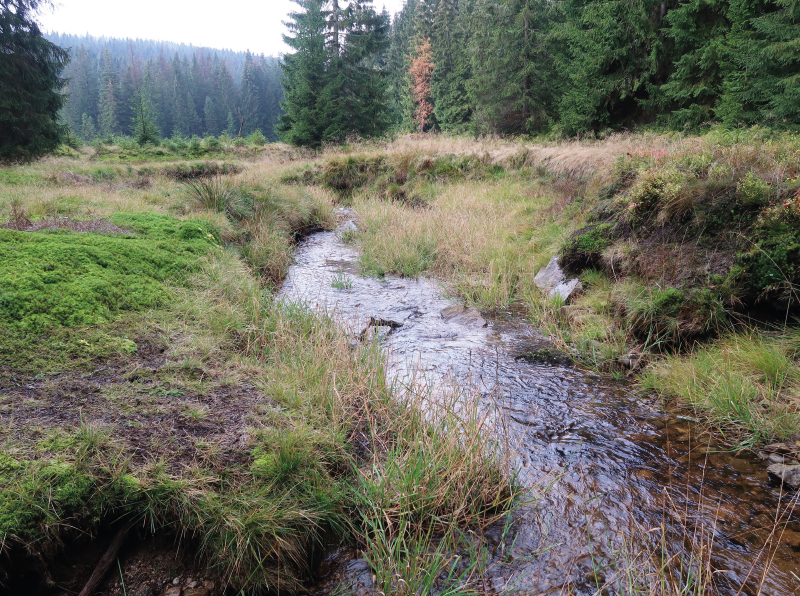
Fig. 3. Hřebový stream in Desná
In these sites, rain gauges were placed near the watercourse, and a mixed sample of precipitation (collected over the entire period of one or two months) was always taken at the end of the given period. For the throughfall exposure, conifers (spruce in all three locations) were chosen because precipitation was also collected in winter. In the snow-free period, the upper part of the rain gauges was equipped with a protective net, so that the coarse solid particles and insects did not get into the collected water phase. The volume of collected precipitation was measured. Each collection campaign was photographically documented. Together with the precipitation collection, point sampling of surface water from the watercourse was carried out near the rain gauge station. The installation of rain gauges for the first sampling campaign took place on 6 October 2020 (BY), 7 October 2020 (KO), and 8 October 2020 (DE).
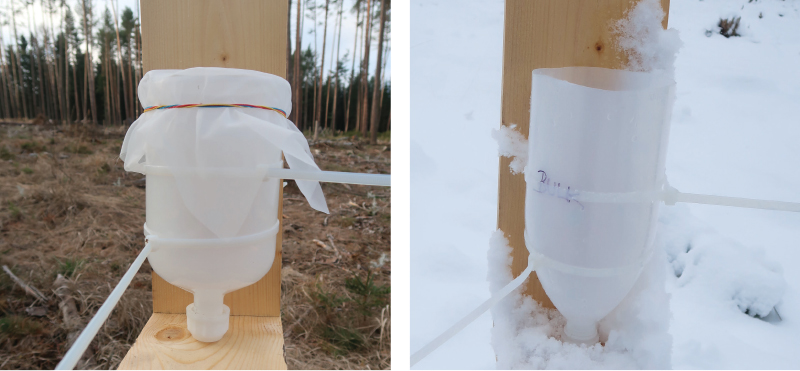
Fig. 4. Bulk precipitation sampling at Košetice pilot site (left: 6 November 2020, right: 7 January 2021)
Data on the amount of precipitation obtained from the Czech Hydrometeorological Institute (CHMI) and confirmed by the actual measurements in the sites were attached to the individual campaigns. The flow rate in the watercourse at the time of sampling was estimated, by analogy with the flow rates at the nearest CHMI gauging stations. The ratio of the flow rate at the observed point of the experimental site and at the nearest gauging station was equal to the ratio of the area of the point catchments. The exception was the site in Košetice, where data was taken from regular measurements carried out by CHMI.
Tab. 1. Monthly precipitation amounts and flow rates at the time of measurement at individual sites
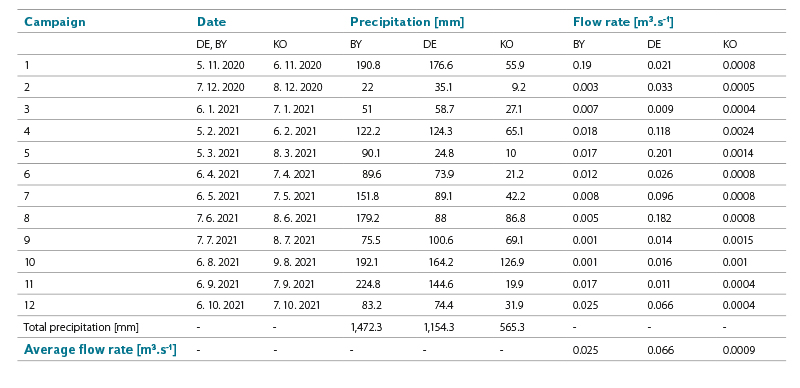
Based on the amount of precipitation and the detected concentrations of monitored pollution parameters in precipitation, an estimate of the total deposition for the given experimental basin was calculated according to the following formula:
RS = ∑Sx*Cx
where RS is annual deposition in the given catchment
Sx amount of precipitation in the given month per area of the catchment
Cx concentration of the pollutant in the throughfall sample of the given month
An estimate of the annual substance load of watercourses for a given pollutant was calculated on the basis of the calculated flow rate and the detected concentrations according to the following formula:
LOD = ∑Qx*Cx*d
where LOD is substance load
Qx instantaneous flow rate at the time of withdrawal
Cx concentration of the substance in the point sample
d length of the period to which the value refers, in this case one month
Values below the limit of determination were not included in the average; for the purpose of calculating the substance load, instead of concentrations below the limit of determination, the average of actually measured values was used if this was lower than the limit of determination, and the limit of determination if the average of the other values was higher. The usual procedure of using half the limit of determination was not used because comparison of the results of both methods of determination shows a large relative error of this procedure.
RESULTS
Due to the different properties of the monitored substances, the results for each metal are presented separately. For informational purposes, the limit of good surface water status based on Directive 39/2013/EU [19] in the case of priority substances Ni, Cd, Pb, and Hg and from the methodology for evaluating the ecological status of surface waters [20] in the case of As is given for comparison. The EQS value means, as already mentioned, the Environmental Quality Standard, AA EQS value the annual average and the MAC EQS value the maximum acceptable concentration. The number of surface water bodies for which the limit for good status was exceeded during the evaluation for the second and third basin plans is also given. The total number of surface water bodies is 1 121 and 1 118 in the second and third planning cycles, respectively. The number of non-compliant water bodies indicates the importance of the substance from the point of view of the assessment of the surface water status. Significant differences between the evaluation in the second and third cycles for Ni and Pb are caused, among other things, by changes in evaluation methodologies, i.e. the use of determining the bioavailability of metals in the evaluation of the chemical status for the third planning cycle. Methodologies and results of status evaluation are discussed in more detail in [3]. In Tab. 2–6, values that are higher than the values of EQS for good surface water status are marked in red. Simultaneously, it must be emphasized that the EQS in the case of Ni, Cd, and Hg are set for the dissolved form of metals, while their total concentration was monitored as part of the project, the marking of values above EQS is therefore only indicative. The average annual value is compared with the value of AA EQS, measurements in individual months with the value of MAC EQS.
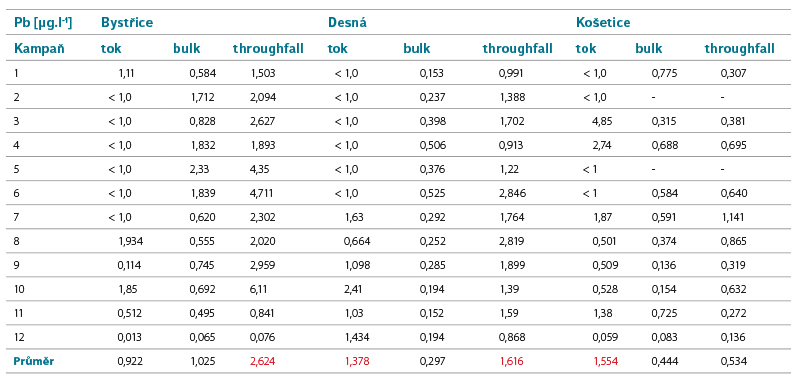
Tab. 2. Lead concentrations in surface and precipitation water
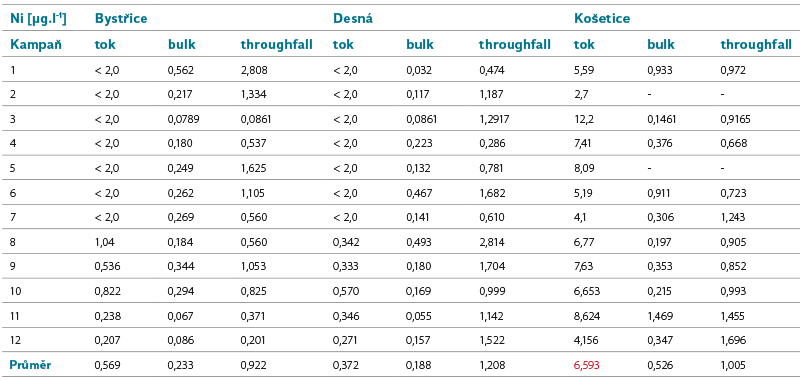
Tab. 3. Nickel concentrations in surface and precipitation water
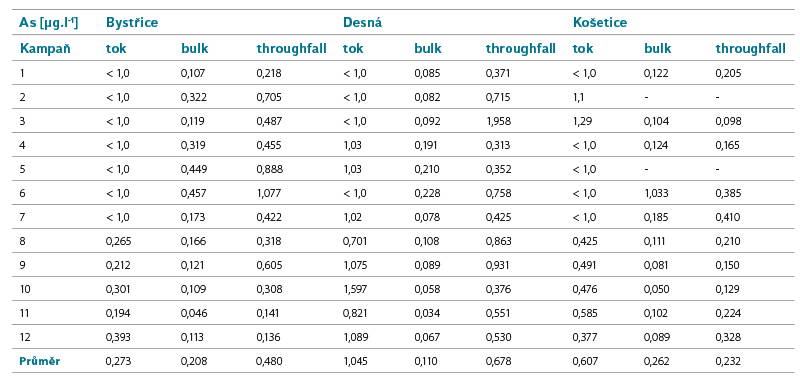
Tab. 4. Arsenic concentrations in surface and precipitation water
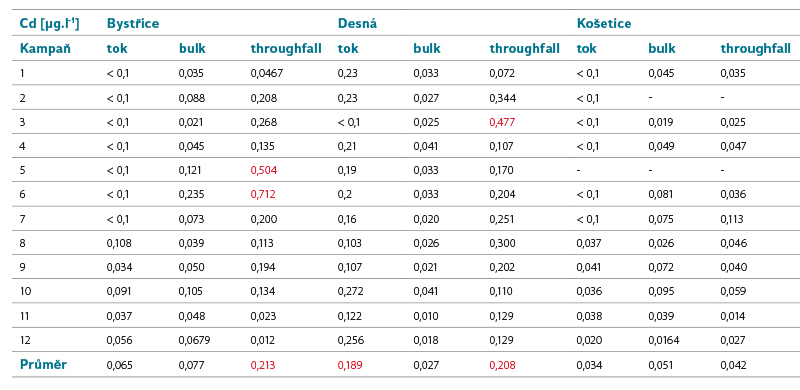
Tab. 5. Cadmium concentrations in surface and precipitation water (the colour marking of values above EQS is based on the limit for hardness class 1, i.e. soft to very soft water)
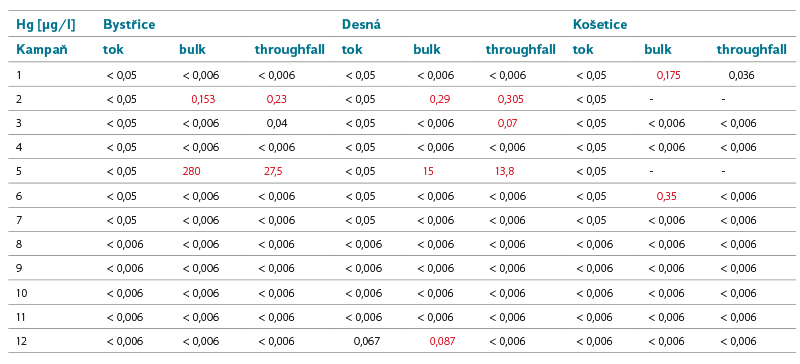
Tab. 6. Mercury concentrations in surface and precipitation water
Lead
The main source of Pb in water is primarily industry, and previously also transport, while a significant means of its penetration into the aquatic environment is transmission through the air. After the ban on the use of leaded fuels in 2001, Pb also enters the water through leaching from contaminated soil.
Limits of good status for surface waters: AA EQS = 1.2 µg.l-1, MAC EQS = 14 µg.l-1.Number of surface water bodies not meeting EQS in the Czech Republic in the second/third planning cycle: 43/4.
Nickel
Ni occurs naturally in the Earth’s crust and is also present in soil. It can be emitted by volcanic activity. In industry, it is often used in the manufacture of batteries, in metallurgy and in the manufacture of electronics. Ni is mainly found in the air as a result of the burning of fossil fuels. It gets into the water mainly by leaching from rocks and sediments.
Limits of good status for surface waters: AA EQS = 4 µg.l-1, MAC EQS = 34 µg.l-1. Number of surface water bodies not meeting EQS in the Czech Republic in the second/third planning cycle: 175/5.
Arsenic
As occurs naturally in the earth’s crust, it can also be present in ore deposits of coal. It can get into water from mine waters, and into the air by burning some types of coal.
Limit of good status for surface waters: AA EQS = 11 µg.l-1.Number of surface water bodies not meeting EQS in the Czech Republic in the second/third planning cycle: 8/13.
Cadmium
Cd is a relatively rare element in nature. It can enter the atmosphere through volcanic activity, during fires, or with dust particles during wind erosion and the burning of fossil fuels. In industry, it is used to a limited extent in the production of batteries, ceramics, electronics, and textile products.
It enters surface waters mainly as part of industrial discharges and waters from the mining of non-ferrous metals or by transfer from the air.
Limits of good status for surface water depending on its hardness classes: AA EQS = ≤ 0.08 (class 1), 0.08 (class 2), 0.09 (class 3), 0.15 (class 4), 0.25 (class 5), MAC EQS = ≤ 0.45 (class 1), 0.45 (class 2), 0.6 (class 3), 0.9 (class 4), and 1.5 (class 5) µg.l-1.
Number of surface water bodies not meeting EQS in the Czech Republic in the second/third planning cycle: 56/26.
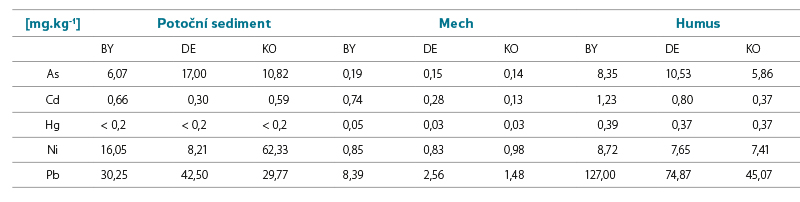
Tab. 7. Indicative comparison of concentrations of selected metals in other monitored matrices
Tab. 8. Calculation of atmospheric deposition and substance load in pilot areas
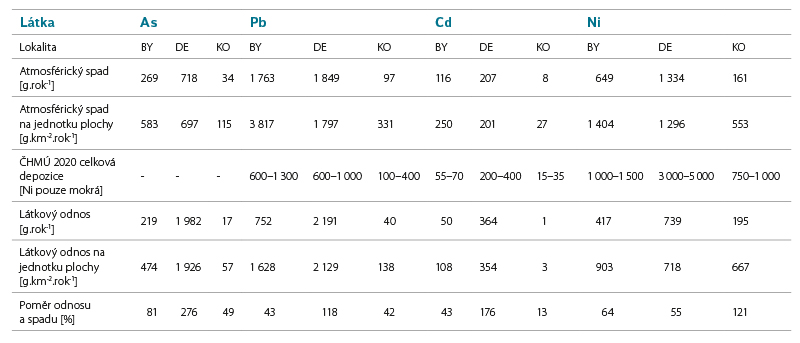
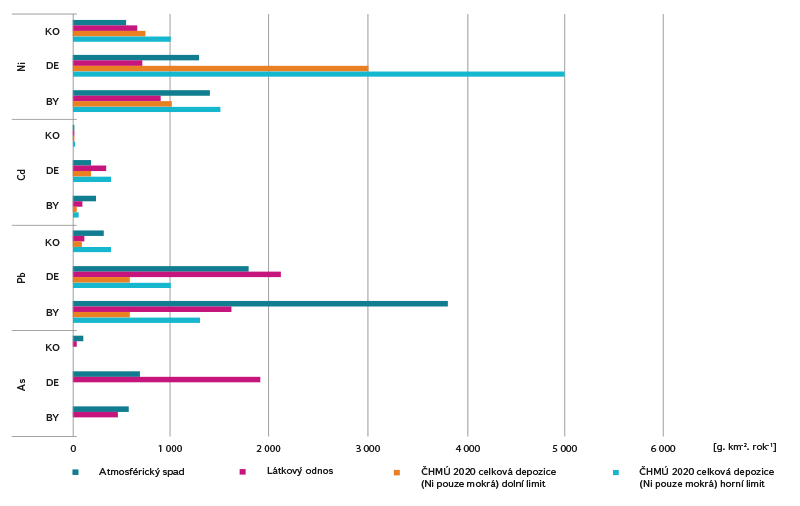
Fig. 5. Calculation of atmospheric deposition and substance load per area unit
Mercury
Hg occurs naturally in rocks and soils. From a global perspective, the increased Hg content of the recent zone reflects recent and past tectonic and volcanic activity.
An increased concentration of Hg in natural waters is usually the result of anthropogenic pollution. Hg compounds can be contained in waste water from some types of industrial production, it can get into the air by burning fossil fuels and by wind drift during surface mining.
Hg has a high accumulation potential, especially in sediments and in aquatic flora and fauna.
Limit of good status for surface water: MAC EQS = 0.07 µg.l-1.
The number of surface water bodies not meeting EQS in the Czech Republic in the second/third planning cycle: 75/95.
The comparison of the calculated relative values shows that the highest values of both deposition and substance load are achieved by concentrations of Pb or Ni, while the lowest values were confirmed for Cd.
The order of concentrations of individual substances in relative atmospheric deposition is Pb > Ni > As > Cd, with the exception of Košetice, where Ni is in first place (Ni > Pb > As > Cd). The order of magnitude of the substance load varies in each site; the lowest values remain common in the case of Cd.
Košetice Ni >> Pb > As >> Cd
Desná Pb > As > Ni > Cd
Bystřice Pb > Ni > As > Cd
DISCUSSION
The measurements carried out confirm that, in the case of some metals, precipitation pollution is comparable to surface water pollution. In the case of metals, no significant seasonality was noted for the pollution of precipitation and surface water. It should be noted that for surface water the result is affected by the high limit of determination in the first half of annual monitoring. The calculated atmospheric deposition is comparable to the calculated substance load in the given basin, although both calculations are burdened with a considerable degree of uncertainty. As expected, higher substance load than deposition was recorded at the Desná site, where a higher load of selected metals in the past is assumed. Closer connections will be possible to evaluate with the involvement of evaluation of other monitored matrices in experimental sites.
Specific assessments for individual metals:
Lead
Pb concentrations are decreasing in the long term [22], both in the air and in surface water. The calculated atmospheric deposition can be compared with the values determined within other projects, e.g. [7] reports deposition of 5.8 or 9.3 kg.km-2.year-1 in two sites in Krkonoše mountains. By comparison with the value of the calculated deposition at the Desná site of 1 797 kg.km-2.year-1, this indicates that there has been a significant reduction in Pb deposition in the past 17 years.
The Pb concentration in precipitation is comparable to its concentration in surface water, but it can be even higher in sites affected by industry (especially metallurgical processing of non-ferrous metals). The concentrations in throughfall precipitation alone can then reach EQS levels, which would pose a risk in the case of an impact on water surface or in the case where precipitation waters are discharged into surface waters without interaction with the environment, if it were a dissolved form of Pb in precipitation water.
The calculated deposition corresponds to the values reported by CHMI for 2020 in the Košetice site; in other sites it is higher, which may be due to local conditions (e.g. in the Bystřice site, a particularly exposed site was chosen; CHMI, on the other hand, works with a modelled network with a step of 1 km), or with a time shift (CHMI year 2020, measurement within the project 10/2020–9/2021).
Nickel
Increased concentrations of Ni in precipitation were not detected in the monitored sites. In the pilot basin of Košetice, higher Ni concentrations were detected in surface water; significant input of Ni to the site from precipitation was not confirmed. It can therefore be assumed that surface water pollution in the Košetice site comes from a different source than the current atmospheric deposition, which is also consistent with the evaluation of other matrices.
The calculated deposition corresponds to the values given by CHMI in the Bystřice site; in the Desná and Košetice sites the values calculated from the data obtained as part of the project were lower.
Arsenic
Precipitation values in all sites including those affected by coal mining and burning are higher, but well below the EQS value for surface water. The highest values in surface water were recorded at Desná, where a higher load can be assumed in the past.
Cadmium
As expected, the lowest concentrations in both precipitation and surface water were measured in the lightly loaded Košetice basin, which served as a reference site for the other two. Higher concentrations in precipitation were measured in Bystřice and Desná, i.e. sites affected by industry and coal burning. These detected concentrations are higher than the EQS values for surface water, if we do not consider the limit values determined for the highest hardness class and the validity of the EQS values for the dissolved form of cadmium. While in the Bystřice site, the highest deposition was recorded, but lower substance load, in Desná, the substance load by the Hřebový stream was, on the contrary, higher. The cause is probably a higher load of cadmium in the given area in the past from nearby sources of air pollution (glass industry) with the accumulation of this pollution in the upper soil layers.
The calculated deposition corresponds to the values reported by CHMI, with the exception of the Bystřice site, where it is significantly higher.
Mercury
Due to the frequent values below the detection limit, it was not possible to determine the atmospheric deposition and substance load. Hg occurred in the surface water of the model areas only once (Desná) in a concentration just below the EQS limit. In the precipitation, we could observe two episodes when Hg was measurable, even in several sites simultaneously. The campaign at the beginning of November 2020 ended with a question mark when there was an increased concentration of Hg in the Košetice site. In the other two areas, increased concentrations did not occur until the December campaign; however, we must consider that the campaigns in Košetice were always concluded one day later than in the other two sites. In the March campaign, on the other hand, increased Hg concentrations in Košetice occurred later and at lower values; however, due to the lack of precipitation, this is a sample taken after a two-month exposure. These increased concentrations of Hg are correlated with the passage of dust from the Sahara Desert through the territory of the Czech Republic, while it is confirmed in literature [23] that areas regularly exposed to these phenomena are also more loaded with Hg. The occurrence of Hg in surface water is sporadic. Nevertheless, due to its high bioaccumulation potential, it is significantly represented in biota, accompanied by the failure to achieve good chemical status of surface waters. However, this problem is not specific only to the Czech Republic; due to the physical-chemical properties of Hg and its behaviour in the environment, it is a worldwide issue.
CONCLUSION
The project confirmed that air pollution can have a significant effect on surface water quality through atmospheric deposition. Environmental characteristics, including historical deposition, also play a significant role. This risk is particularly evident for Pb and Cd. In the case of As and Ni, on the other hand, atmospheric deposition does not appear to pose a threat to surface water quality in the selected sites. Hg is characterized by special properties which, in addition to requiring more complex laboratory processing, also shows much more significant fluctuations in values. In precipitation in particular, the amount of Hg can change significantly, apparently also in connection with distant external influences.
We will provide a more detailed description of the representation of metals in the monitored matrices within the framework of this project and the links between the pollution of individual components of the environment in one of the following articles. All outputs to date are available on the project website [24].
Acknowledgements
This article was supported by TA CR grant SS01010231 „Dopady atmosférické depozice na vodní prostředí se zohledněním klimatických podmínek (Impacts of atmospheric deposition on the aquatic environment with consideration of climatic conditions)”.
This article has been peer-reviewed.
