SUMMARY
This article presents the results of the assessment of the possible impact of climate change on groundwater abstraction for human consumption between 2041 and 2060. Part of the results is the balance of the current amount of groundwater on smaller area units. The methodology is based on the procedures of the water management balance and the assessment of quantitative status of groundwater bodies. First, the balance of current groundwater quantity at the level of working units of water bodies was evaluated, and then the prospective balance including the possible impact of climate change. The current status results were compared; while 12.5% of the area was in poor status for the assessment of the quantitative status of groundwater, 7.3% of the area was at risk for the assessment of working units. This decrease is due to using smaller units for the assessment. Due to climate change, it will probably worsen to 16.1%, that is, by 8.8% compared to the current status. However, it is necessary to keep in mind that the results are burdened with significant inaccuracy. This inaccuracy is mainly due to the method of calculating current groundwater resources, the heterogeneity of groundwater resources in hydrogeological zones, the approximation of groundwater resources into the future, and the high proportion of working units with low abstraction (these units had to be removed from the results because of low reliability).
INTRODUCTION
The impacts of climate change on drinking water supply have been modelled for water reservoirs for some time now. In the long term, the share of groundwater in the supply has been fluctuating between 44–48% of the volume [1], therefore it is necessary to deal with groundwater in more detail. Due to the current drought in the CR, there have already been local problems with groundwater abstraction for households. However, with the increasing impact of climate change, the frequency of occurrence as well as the temporal and spatial extent of extreme hydrological phenomena may be changing. The results of modelling the impact of climate change in the Czech Republic predict a more frequent occurrence of flash floods and long-lasting drought. This fact has been confirmed in many river basins in recent years. The unfavourable situation can also lead to a threat to the reliability of drinking water supply.
The presented balance of groundwater sources and needs for drinking purposes was processed as part of the project VI20192022159 “Water management and water supply systems and preventive measures to reduce risks in drinking water supply“ of the BV III/1-VS programme of the Ministry of the Interior. The project researcher is T. G. Masaryk Water Research Institute (hereinafter TGM WRI). The project was started in July 2019, with completion planned for December 2022. The project is aimed at evaluating the risks of drinking water supply as a result of climate change and creating technical tools for assessing possible measures to mitigate any adverse impact.
METHODOLOGY AND DATA
The water management balance of groundwater is prepared annually for approximately 99 hydrogeological zones out of a total of 152, which is almost 81% of the area of the Czech Republic [2]. Using a similar procedure, but based on additional data on natural resources, the quantitative status of groundwater bodies is processed every six years [3]. However, hydrogeological zones and groundwater bodies are often quite large; some have an area of up to 5,800 km2. As a result, in some bodies, part of the body is poor, but this is not reflected in the result of quantitative status (poor or potentially poor) because the entire area is evaluated. Similarly, a whole unit may be evaluated as poor, while in reality problems occur only in part of it. Fig. 1 shows the result of the evaluation of the quantitative status of the bodies based on data on natural resources and abstraction between 2013 and 2018. Although the former dry period is partly included here, it represents the current quantitative status. There are 34 out of 174 poor and potentially poor groundwater bodies, which make up 12.5% of the total area.
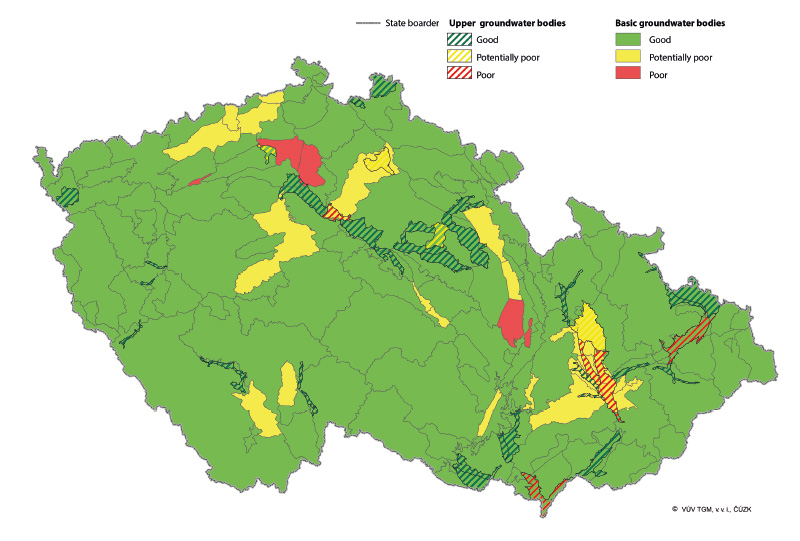
Fig. 1. Quantitative status of groundwater bodies for the third cycle of River Basin Management Plans
Climate change scenarios in water management
For the creation of climate change scenarios in the context of estimating changes in the hydrological balance, the so-called increment method is used as standard in the Czech Republic, especially for studies in monthly steps. This method consists of transforming the monitored data so that changes in the transformed quantities correspond to changes derived from climate model simulations. For the evaluation, various regional (RCM) and global climate models were tested in the Czech Republic. Eventually, the HadGEM2-ES model was selected for evaluation and recommended in studies [4]. To model hydrological balance, the BILAN model is used, which has been developed for more than 20 years in the TGM WRI Hydrology Department [5]. This model calculates the chronological hydrological balance of a basin or territory in daily or monthly time steps. It expresses the basic balance relationships on the basin surface, in the aeration zone (which also includes the vegetation cover of the basin), and in the groundwater zone. Air temperature is used as an indicator of energy balance, which significantly affects hydrological balance. By calculation, potential evapotranspiration, territorial evaporation, infiltration into the aeration zone, percolation through this zone, water supply in the snow, water supply in the soil, and groundwater supply are modelled. Runoff is modelled as the sum of three components: two components of direct runoff (including hypodermic runoff) and baseflow [5–7]. The procedure for modelling the impact of climate change on the hydrological regime is presented, for example, in the article [8].
Fig. 2 shows observed air temperatures for the Czech Republic and the individual time horizons considered: reference period (1981–2010) and prospective periods 2021–2040, 2041–2060, 2061–2080, and 2081–2100. Analogously, precipitation totals and monthly means for individual time periods are shown in Fig. 3.
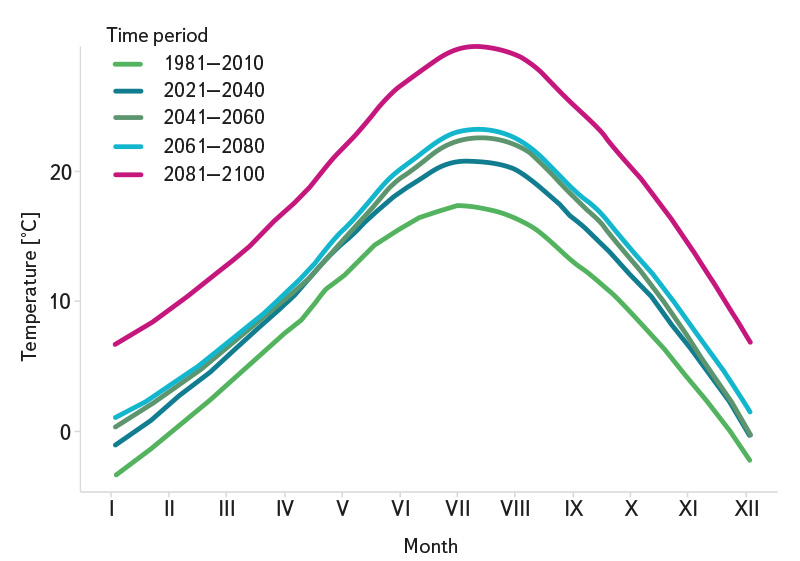
Fig. 2. Air temperatures for the individual time horizons considered
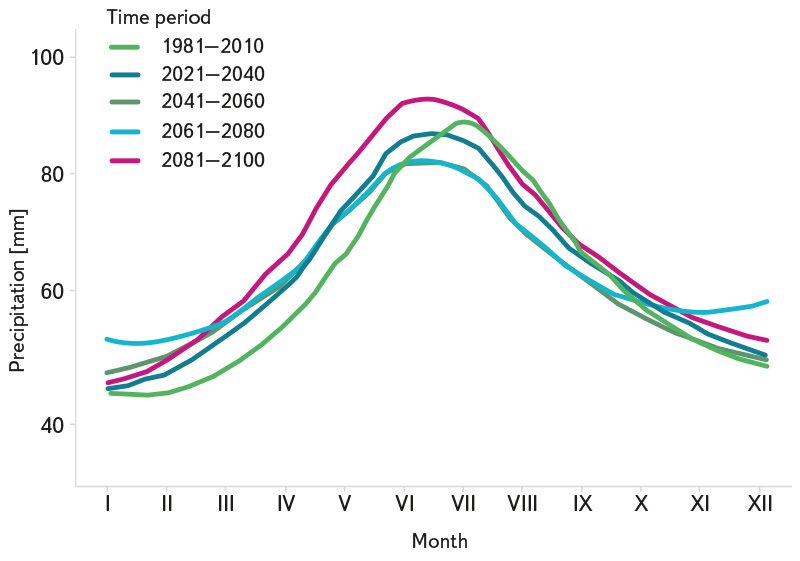
Fig. 3. Precipitation for the individual time horizons considered
In this context, a data set describing the impact of climate change on hydrological characteristics in the aggregation of surface water bodies (processed as part of the “Drought I” (2017–2018) and “Drought II” (2019–2021) projects funded by the Ministry of the Environment) was used to assess the possible impact of climate change on the replenishment of groundwater supplies (partial outputs are available on www.suchovkrajine.cz and hamr.chmi.cz). Changes in hydrological characteristics due to the impact of climate change relate to current conditions represented by the time period 1981–2020. In order to assess the potential impact of climate change on replenishment of groundwater supplies and the prospective balance of groundwater resources and needs (abstraction), data on the change in the values of base-flow median for the time period 2041–2060 were used.
Given that the data set was processed for relatively detailed areas of inter-basin areas of surface water bodies (there are 1,118 of them in the Czech Republic), the data was converted not to 174 groundwater bodies, but to 1,220 working units of groundwater bodies using geographical analysis [9]. Fig. 4 shows the result of the change in base-flow median, expressing the natural resources of groundwater, in the period 2041–2060 compared to the current situation. Although the result is very negative – most areas saw a decrease of at least 25% – it does not in itself say how this decrease in basic runoff may affect demands on groundwater resources for drinking purposes, as it does not consider their size.
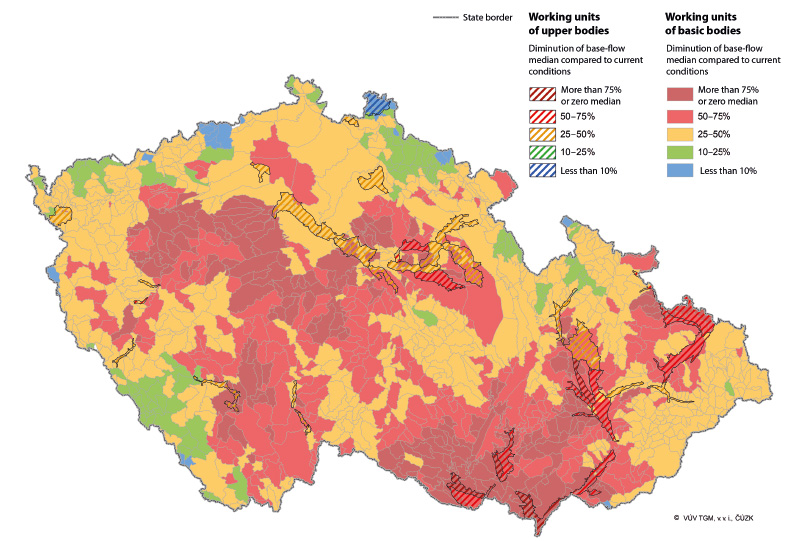
Fig. 4. Diminution of base-flow median in working units of groundwater bodies. Model HadGEM2-ES and time period 2041–2060
Balance of the current amount of groundwater per working units of groundwater
In the balance of the amount of groundwater, the sum of abstraction is compared to the values of natural groundwater resources in the area unit. In the water management balance, this unit is the hydrogeological zone, and hydrogeological units are defined by the Czech Hydrometeorological Institute (CHMI) as natural resources. Other data on natural resources – Hydrogeological zoning [10] and Rebalancing of underground water reserves [11] have always been determined for hydrogeological zones, while more detailed data are not available. In contrast, groundwater abstraction can be differentiated into almost any areal unit. The first step in this project was the division of data on current abstraction and natural groundwater resources (both from the period 2013–2018) into working units. According to the size of the sums of abstraction, the working units were then divided into units without abstraction, with low, medium, large, and very large abstraction. In this division, two versions of the distinction of the size of abstraction were used: in version I, the average annual absolute size of abstraction was decisive (the threshold values were 10, 20 and 50 l.s1); in version II, it was the specific size of abstraction, i.e., the conversion of abstraction per unit of area (the threshold values were values of 0.05, 0.5 and 1 l.s-1.km-2). The results are shown in Fig. 5 and 6 (version I) and Fig. 7 and 8 (version II). It is clear from the maps that version II is better at taking into account the size of working units (most of the large and very large abstraction from version I fell within the category of medium abstraction); on the other hand, the absolute size of abstraction is more important for supplying the population (i.e., version I).
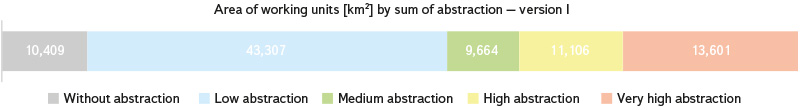
Fig. 5. Area of working units [km2] by sum of abstraction – version I
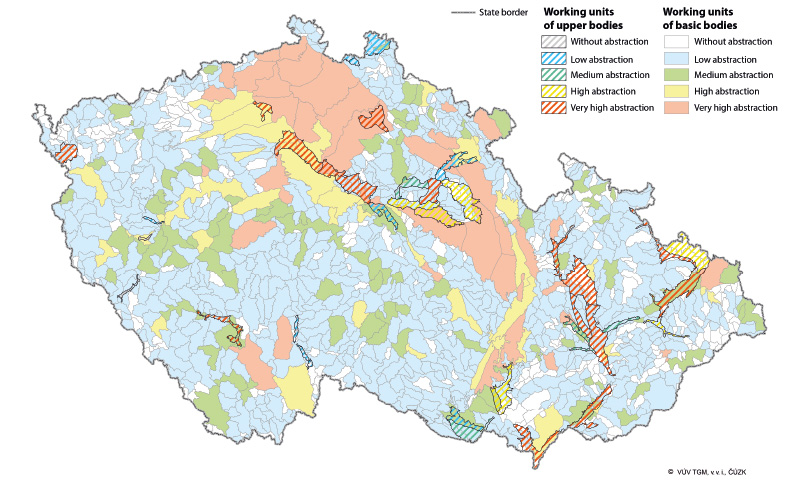
Fig. 6. Working units by sum of abstraction – version I
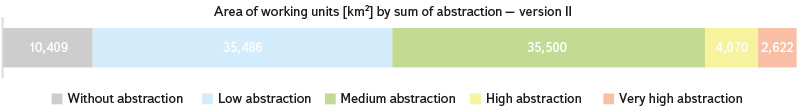
Fig. 7. Area of working units [km2] by sum of abstraction – version II
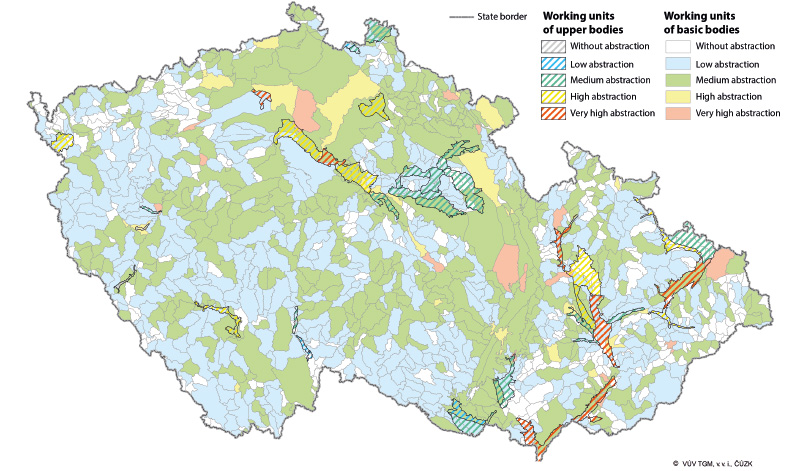
Fig. 8. Working units by sum of abstraction – version II
Although the majority of groundwater abstraction is used to supply the population, it is not the case for all abstraction. For that reason, a map of working units according to the size of abstraction for drinking purposes was also created (the previous maps include all abstraction, regardless of use), see Fig. 10. Since it is only a supplementary map, it is shown here in version I only, i.e., according to the absolute size of abstraction. The same applies to the graph with the size of the areas (Fig. 9).
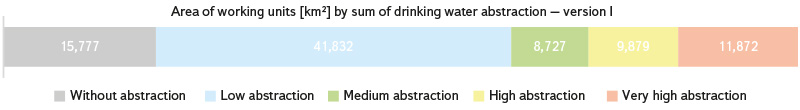
Fig. 9. Area of working units [km2] by sum of drinking water abstraction – version I
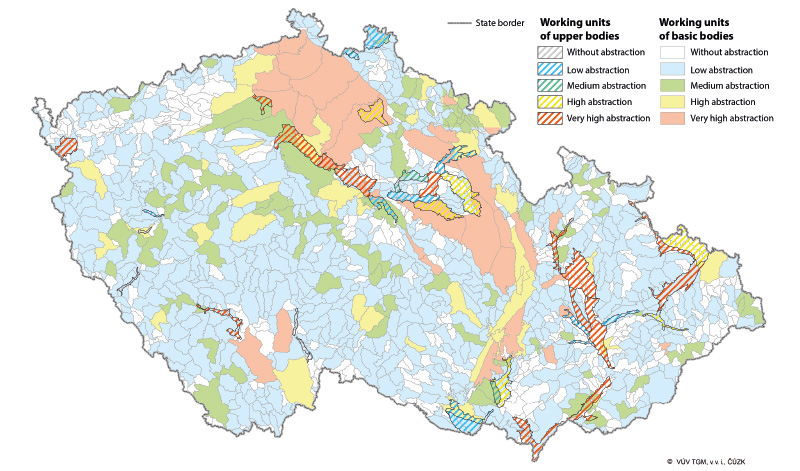
Fig. 10. Working units by sum of drinking water abstraction – version I
If we compare the graphs in Fig. 5 and 9, it can be seen that when taking into account abstraction only for drinking purposes, the areas of working units without abstraction and with low abstraction increased slightly and, similarly, working units with medium, high and very high abstraction decreased slightly. However, the results are not significantly different. Therefore, for further research, all abstraction was taken into account.
For natural resources, the same sources were used as in the assessment of the quantitative status of groundwater (i.e., data from CHMI, data from the Hydrogeological Zoning and from the Rebalancing of Groundwater Supplies). This data was then calculated in the same proportion as the baseflow values were modelled.
The actual comparison of abstraction and natural resources in working units was carried out in the same way as the assessment of the quantitative status of groundwater bodies; however, working units with low abstraction were not evaluated because, with such low abstraction, the comparison is very imprecise. Equally, working units where the natural resources of the current status were zero (and, simultaneously, the amount of abstraction was at least medium) were not evaluated – however, this was the case with only two working units for version I and five for version II.
Balance of the amount of groundwater in the prospective status per working units of groundwater
For the prospective status – that is, for the period 2041–2060 with considered climate change –natural groundwater resources were reduced by the same percentage as baseflow in working units of surface water bodies for the HadGEM2-ES model. As for abstraction, they were considered in the same range as in the period 2013–2018. The comparison of abstraction and resources was then processed in the same way as the balance of the amount of groundwater in the current status.
RESULTS AND DISCUSSION
The result of this assessment was individual working units being at risk, both in the current and prospective status, where the risk refers to the possibility that the natural resources of groundwater due to drought (currently) or climate change (in the future) will decrease to such an extent that it will not be possible to meet the requirements for consumption for drinking purposes. Working units were divided into unassessed (i.e., no abstraction, only with low abstraction and, exceptionally, with at least medium abstraction, but zero natural resources), then into satisfactory both in the current and prospective status, then into potentially at risk or already at risk, and finally again to at risk only in the future. Units potentially at risk differ from units at risk, as in the case of the results of the quantitative status of groundwater bodies – the result at risk occurred either only for maximum but not for average abstraction, or the results differed for differently determined natural resources. Therefore, working units potentially at risk have lower credibility.
The risk was processed for both versions of classification of the level of abstraction, for which the procedure does not differ, but the number of unassessed working units does due to the different method of classifying the size of abstraction.
The results for version I (i.e., for absolute values of annual average abstraction) are shown in the map in Fig. 11, and for version II (for abstraction recalculated according to the areas of working units) in Fig. 12. A comparison of the results of both versions is shown in Fig. 13.
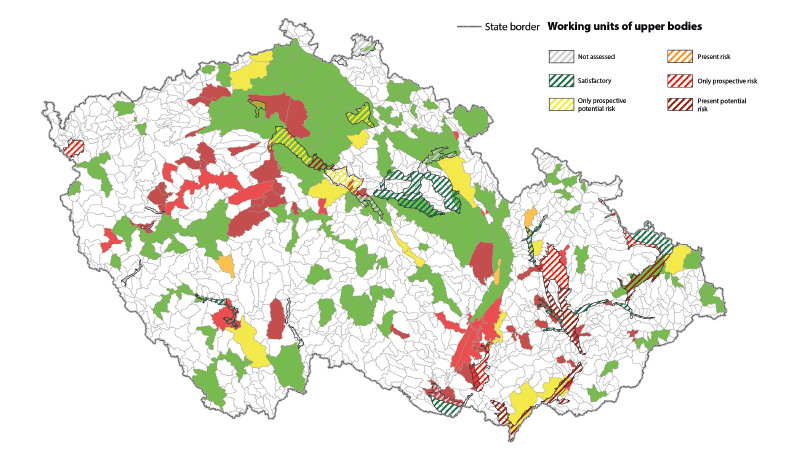
Fig. 11. Risk assessment of working units – version I
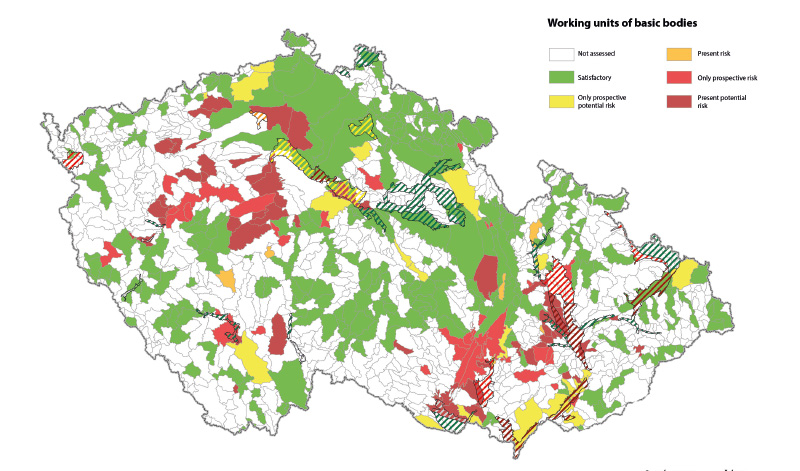
Fig. 12. Risk assessment of working units – version II
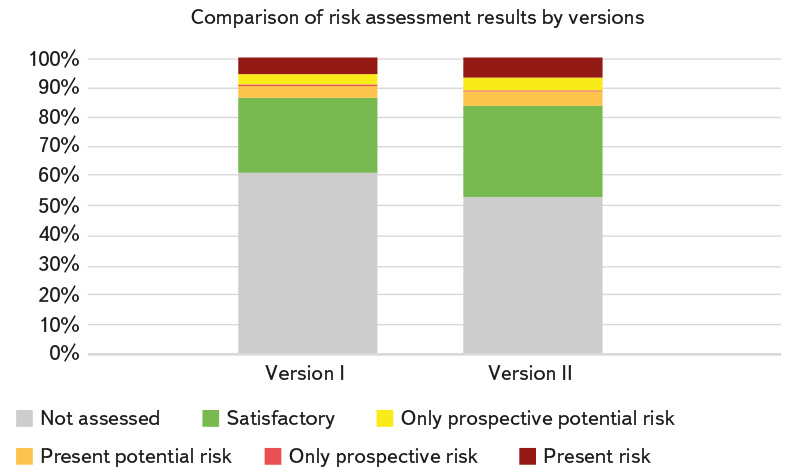
Fig. 13. Comparison of risk assessment results by versions
Note: The areas of working units potentially at risk are currently very low (only 0.37% – version I or 0.29% – version II), so they are not visible in the graph.
According to the maps, the results of the two versions look quite different; however, it is clear from the graph that the difference is due to the fact that there are fewer unassessed working units in version II, while most of the unassessed units in version I are satisfactory in terms of risk in version II.
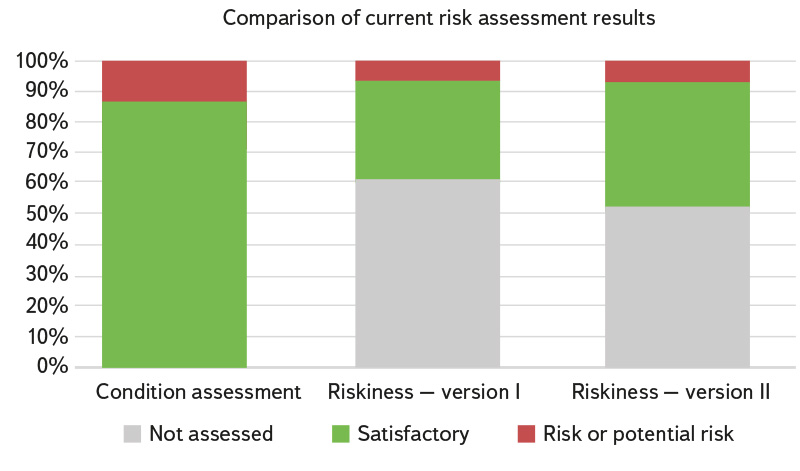
Fig. 14. Comparison of current risk assessment results
It is also interesting to compare the results of the current status at the level of groundwater bodies (quantitative status assessment) and risk for working units – see Fig. 14. There were no unassessed groundwater bodies in the quantitative status assessment, but even so the proportion of poor areas is the highest (12.5%), while in terms of risk it is only 6.2% for version I and 7.3% for version II of areas at risk or potentially at risk. Thus, evaluation in smaller units seems to allow better identification of problem areas. On the other hand, it is necessary to keep in mind that the inaccuracy of data on natural resources, which is considerable (e.g., the determination of natural resources of hydrogeological zones according to the CHMI and according to the results of Rebalance often differ significantly), can worsen when recalculated to smaller units. This procedure assumes that natural resources are more or less homogeneous within the hydrogeological zone, which also does not correspond to reality; for example, the places of concentrated drainage where groundwater is most often abstracted are not taken into account at all. Groundwater abstraction also shows a certain inaccuracy (albeit smaller than with natural resources) both in terms of localization (some large abstracted areas are identified by only one point, even if in reality they would extend into several working units), but also in terms of classification to the horizon; quite often groundwater is abstracted both from the upper horizon (i.e., from the Quaternary) and from basic bodies. In some cases, groundwater abstraction, if located in river alluvium, is subsidized by surface water, and thus – in addition to negative impact on the quality of the water used – worsens the balance assessment result.
Fig. 15 shows the last output of the project, which is an overview of working units that are expected to deteriorate in the future – that is, that the current satisfactory status will change to potentially at risk or at risk. Since the comparison of the two versions showed that there are fewer unassessed working units in version II, we consider the results according to version II to be relevant (although, for certainty, the deterioration in version I was also evaluated). The area of deteriorated working units is only 8.8%; therefore, from this point of view, only 16.1% of the total area would be at risk in the future. However, it is necessary to point out that the mentioned inaccuracy of the data for the current status is increased by approximation for a longer period of time. In addition, it is not clear what the prospect is for working units with low abstraction (excluded due to significant inaccuracy in the assessment) which for option II amounts to 40.7% of the total area.
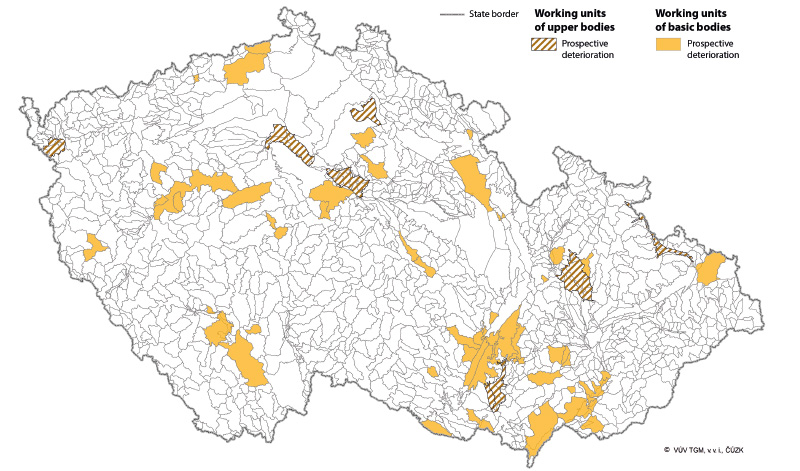
Fig. 15. Deterioration of risk assessment in prospect
CONCLUSION
The aim of the project was to find out how significantly climate change will affect the possibilities of groundwater abstraction for drinking purposes by 2050. Given that the modelled changes in baseflow, represented by natural resources for most groundwater bodies, were processed into significantly smaller area units than hydrogeological zones and groundwater bodies, groundwater abstraction was also aggregated in more detail. In this way, the balance of the amount of groundwater of the current status could be processed on 1,220 working units of groundwater bodies in contrast to 174 water bodies. The methodological solution is based on the procedures of water management balance and assessment of the quantitative status of groundwater bodies. The balance assessment made it possible to evaluate working units potentially at risk and at risk for the current status and their expected deterioration for the period 2041–2060.
When aggregating abstraction into working units, the units were categorized according to the size of the sum of abstraction – both according to the average annual absolute numbers (version I) and according to the conversion to the area of working units (version II). Based on this division, working units without abstraction, with low, medium, high, and very high abstraction were distinguished. In the assessment of risk, units with no abstraction but also with low abstraction were excluded, as there is either no problem for them (if the natural resources are large enough) or the comparison of low abstraction and low natural resources is very imprecise. Due to the fact that the identification of small abstractions was different for the two versions, the results of the risk were also different. When comparing the results, version II turned out to be more satisfactory. According to this version, 7.3% of areas are at risk or potentially at risk for the current status, and 16.1% of areas for the prospect. When assessing the quantitative status of groundwater bodies, which in terms of methodology and period corresponded to the balance assessment of the current status, 12.5% of areas came out as poor or potentially poor, so a more detailed assessment probably means the possibility of better identifying problematic areas. On the other hand, it is necessary to keep in mind that the inaccuracy of the original data is already quite large and may continue to increase when the results are more detailed. Simultaneously, it may later turn out that local problems will occur in some groundwater working units with low abstraction and low natural resources that were excluded from the assessment.
Acknowledgements
This article was written on the basis of research carried out as part of the project VI20192022159 “Water management and water supply systems and preventive measures to reduce risks in drinking water supply” of the BV III/1-VS programme, which is financed by the Ministry of the Interior of the Czech Republic.
This article has been peer-reviewed.
The article was translated on the basis of the Czech original by Environmental Translation Ltd.
