ABSTRACT
The Joint Danube Survey (JDS4), organized in 2019, provided a unique dataset on the occurrence of several hundred newly identified contaminants of emerging concern (CEC) in waters of the Danube river basin, including wastewater from selected wastewater treatment plants. In this study, published JDS4 data were used to assess the significance of individual substances identified in wastewater using the grey water footprint approach. Determining all newly identified contaminants is time-consuming and expensive, so it is reasonable to focus on the „most problematic“ substances. The advantage of the grey water footprint assessment is conversion of the amount of discharged pollutants into the volume of water needed for dilution to an environmentally ‘safe level’, allowing comparison of different substances. Based on JDS4 data, out of several hundreds of substances detected, 33 were identified as potentially risky, according to set criteria. However, this list cannot be taken as definitive, as the level of knowledge about the harmfulness of individual substances quickly develops with regard to the risk currently attributed to them. Similarly, the JDS4 dataset reflects a specific data collection methodology, which may not capture all connections related to the impact of the occurrence of new substances on the environment.
INTRODUCTION
New or „emerging“ contaminants are substances of anthropogenic origin that have been monitored in the environment for a relatively short time. Therefore their occurrence is not entirely mapped, and their effects on organisms, including humans, are not yet fully known. These mainly include chemical substances used and released into the environment through various pathways. In particular, it concerns residues from pharmaceuticals and personal care products (PPCP), pesticides and plant protection products (PPP), and industrial chemicals. They are generally referred to as Contaminants of Emerging Concern (CEC). These substances are not only detected in wastewater but also in surface, groundwater, and even drinking water. One of the main sources of CECs in the environment is wastewater treatment plants, which are not equipped to remove the full range of them [1].
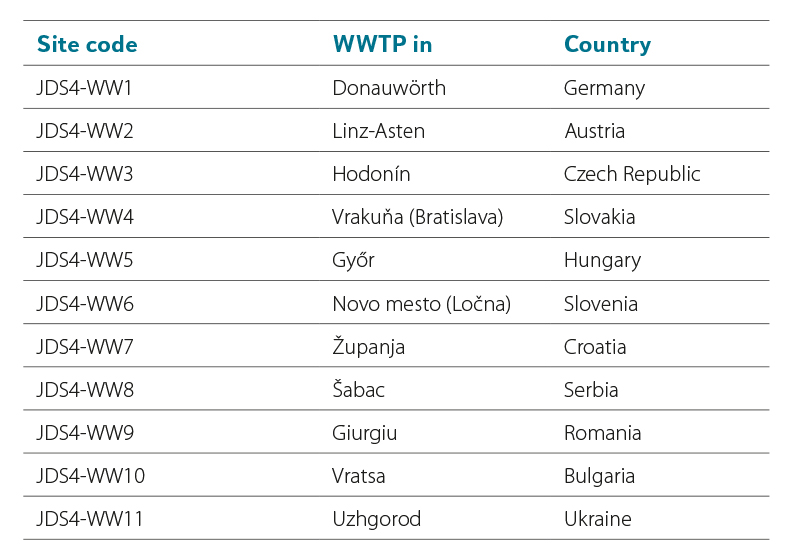
The mapping of CECs in waters was a part of the 4th Joint Danube Survey (JDS4), carried out in 2019, in 13 countries belonging to the Danube river basin, including the Czech Republic. The main purpose of the Joint Danube Surveys is to ensure (in a short period) reliable and mutually comparable information on selected water quality indicators and the state of Danube ecosystems, and its main tributaries [2]. In water samples collected within JDS4, a broad-spectrum targeted screening of 2,362 chemical substances and their transformation products was performed, identifying 586 CECs [3]. One of the matrices analyzed within JDS4 was wastewater from 11 wastewater treatment plants (WWTPs), at their inflows and outflows. Tab. 1 lists the monitored WWTPs.
Tab. 1. List of monitored WWTPs within JDS4
The grey water footprint is part of water footprint methodology, focusing on quantifying water consumption throughout the life cycle of a product, process, service, or within an organization. The grey water footprint is defined as a volume of water required to dilute discharged pollution to environmentally safe concentrations according to set environmental limits [4]. It is an environmental indicator that allows comparison of different pollutants by converting them into water volumes needed. The water footprint concept was introduced in 2002 [5], initially containing only quantitative assessments using blue and green water footprints. The expansion of the concept to also include qualitative assessment (grey water footprint) took place between 2005 and 2008 [6]. One of the first studies addressing the grey water footprint of wastewater treatment plants is a Romanian study from 2011 [7]. Since then, several studies have been published on the grey water footprint of WWTPs, addressing topics such as the impact of WWTPs on reducing the grey water footprint [8–11]; quantifying water and carbon footprints of WWTPs [9, 12]; and quantifying the grey water footprint of industrial wastewater [13–16]. Several studies also focused on pharmaceuticals, which form one part of CECs, and their grey water footprint [17–19].
All three mentioned works dealing with the grey water footprint of pharmaceuticals were limited in the scope of monitored substances. The aim of this study is to use the grey water footprint to assess the significance of individual CECs detected in wastewater during JDS4. Determining all CECs in wastewater is a time-consuming and cost-demanding task. Therefore, for routine monitoring, it is reasonable to select substances with the highest grey water footprint.
DATA AND METHODS
The concentrations of the detected CECs in the form of minimum and maximum values measured in individual matrices were published as supplementary material to an article by Nq et al. [3], together with Predicted No Effect Concentration (PNEC) values. PNEC is the concentration of a chemical substance that indicates the threshold at which adverse effects of exposure in the ecosystem have not (yet) been observed. These values are not intended to predict the upper limit of the concentration of a chemical substance that has a toxic effect [20]. In ecotoxicology, PNEC values are often used as a tool for assessing environmental risks [21], for example by the European Chemicals Agency (REACH Regulation (EC) on Registration, Evaluation, Authorisation and Restriction of Chemicals) and other toxicological agencies for assessing environmental risks [20]. PNEC value can be used in connection with Predicted Environmental Concentration (PEC) to calculate the Risk Characterization Ratio (RCR), also known as the Risk Quotient (RQ) or Hazard Quotient (HQ) [22]. The RCR equals the ratio of PEC/PNEC for a specific chemical substance and is a deterministic approach for estimating environmental risk at the local or regional scale. If PNEC exceeds PEC, it is concluded that the chemical substance poses no risk to the environment.
PNEC can be calculated from data on acute toxicity or chronic toxicity for one species, from data on Species Sensitivity Distribution (SSD), or from data obtained from field studies or ecosystem modelling tests [20, 23, 24]. Depending on the type of data used, an assessment factor is applied, that takes into account the reliability of the ecotoxicological data used when extrapolating it to the entire ecosystem. The value of the assessment factor depends on the uncertainty of the available data and ranges from 1 to 1,000 [20].
When data from acute toxicity tests are used to calculate PNEC values, the quality and relevance of these data must be verified. Ideally, this data should relate to species from multiple trophic levels and/or taxonomic groups [20]. The lowest determined concentration causing a 50% effect (L – lethal, E – effective, I – inhibitory) – LC50, EC50, IC50 – is then divided by the assessment factor for calculating PNEC, which is usually 1,000 [20].
When using chronic toxicity data to calculate PNEC, the No Observed Effect Concentration (NOEC) values are used. NOEC is the highest tested concentration at which no statistically significant (p < 0.05) difference in effect was observed in chronic toxicity tests compared to the control group. The lowest NOEC in the set of test data is divided by an assessment factor of 10 to 100, depending on the diversity of test organisms and the volume of available data. The more species or data there are, the lower the assessment factor is [20].
The Hazardous Concentration for 5 % of species (HC5) can also be used to derive PNEC. HC5 is the concentration at which 5 % of species in the SSD show an effect [10]. A statistical estimate of the SSD value of HC5 can be made from the results of a large number of ecotoxicological tests performed with a single substance using multiple trophic levels of test organisms (fish – invertebrates – algae). To determine PNEC, the HC5 value is then divided by an assessment factor of 1 to 5 [20]. However, in many cases, there may not be sufficiently large datasets available for determining the HC5 value using the SSD statistical procedure. In these cases, the NOEC value is used for PNEC derivation [20].
When using data on the effect of a substance from field studies or model tests, the value of the assessment factor is specific to the particular study or experiment [20].
Since most emerging contaminants do not have a set maximum permitted concentration in the aquatic environment (environmental standard), the PNEC value is used in calculating the grey water footprint according to the Equation 1:
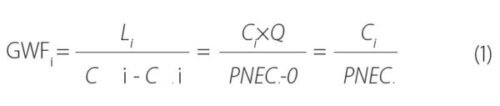
where:
GWFi is grey water footprint of substance i
Li amount of discharged substance i
Cmax,i maximum permitted concentration of substance i in the aquatic environment (environmental standard)
Cnat,i natural concentration of substance i in the aquatic environment; for anthropogenic substances = 0
Ci concentration of substance i in wastewater
Q flow rate of discharged wastewater; considering the study’s objective, Q = 1 was assumed
PNECi concentration of substance i, below which no adverse effect of exposure in the ecosystem is measured
A total of 419 CECs found in wastewater during JDS4 were included in the analysis. Of these, 311 CECs were detected in treated wastewater discharged from WWTPs, and 306 CECs were detected in wastewater entering WWTPs. Only 198 substances were found both in the influents and effluents to/from WWTPs. The largest proportion of detected CECs were pharmaceuticals. With a total of 165 substances, they represent 39.4 % of all detected CECs in wastewater (Fig. 1).
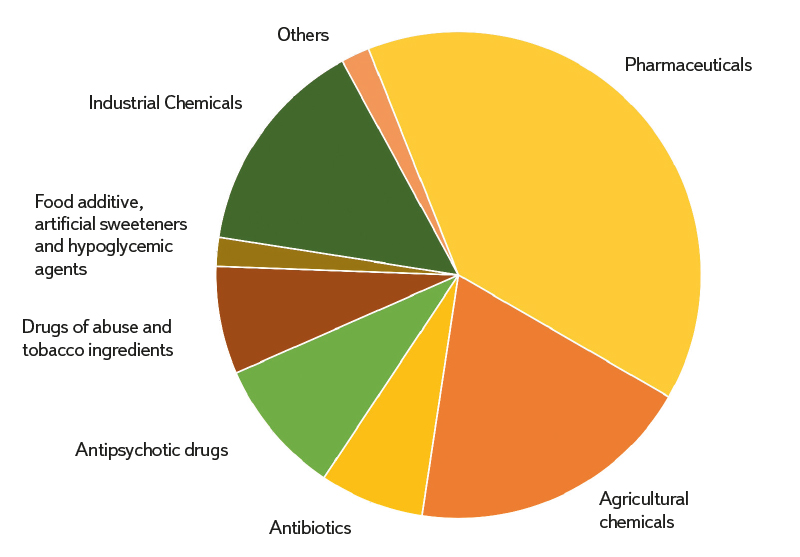
Fig. 1. Groups of emerging contaminants detected in wastewater within JDS4
In the next step, values of the grey water footprint (GWF) of a unit volume were determined according to Equation 1, for the minimum and maximummeasured concentrations of each CEC at the inflow and outflow to/from WWTPs. Substances were designated as risky if their maximum GWF value was higher than 0.1 % of the maximum GWF value of the substance with the highest value (at WWTP inflow or outflow). The value of 0.1 % was chosen with regard to very high GWF values of the substance with the highest value at the inflow or outflow to/from WWTP (see Results) – which statistically represent an outlier value. Another reason that led to the choice of such a wide range is uncertainties associated with PNEC determination (see Discussion) when the assessment factor for different CECs ranges from 1 to 1,000.
RESULTS
Based on the procedure described in the Data and Methods section, 33 CECs were selected (Tab. 2). In total: 6 substances from the Antibiotics group; 1 substance from the Antipsychotics group; 11 substances from the Other Pharmaceuticals group; 9 substances from the Agricultural chemicals group; and 6 substances from the Industrial chemicals group.
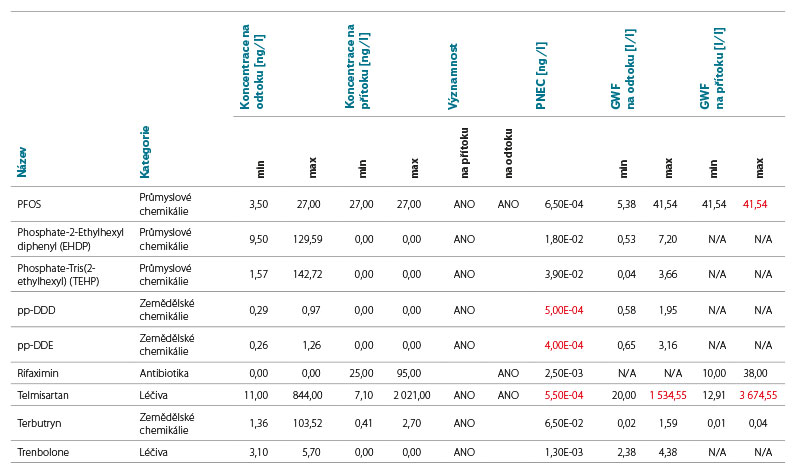
Tab. 2. Risk CECs detected in wastewater during JDS4
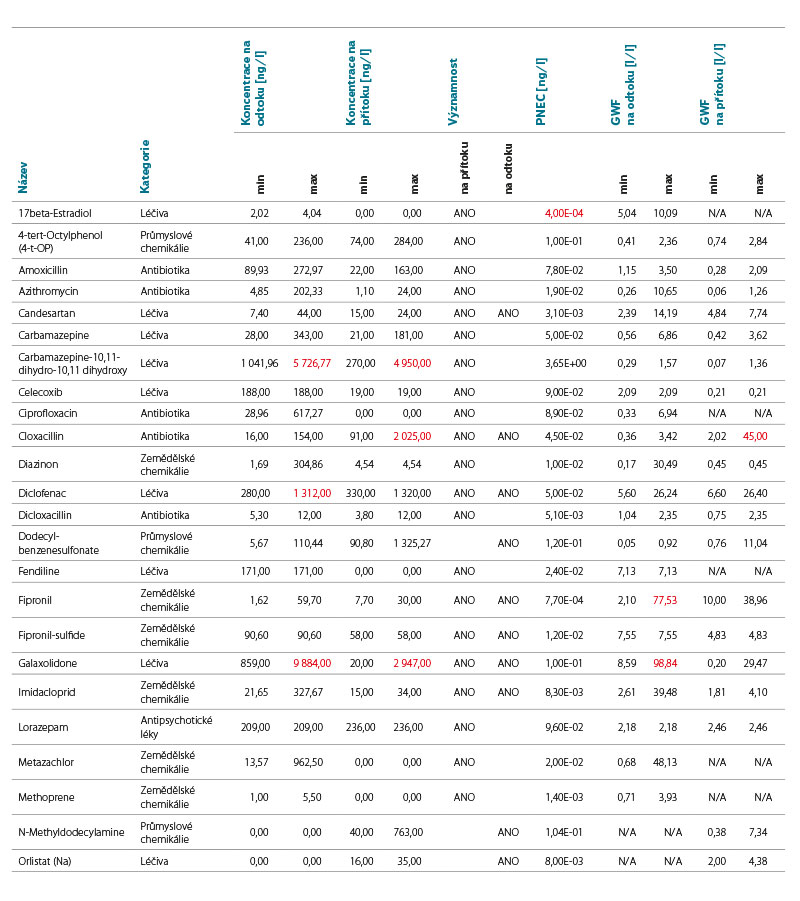
In the columns of maximum concentrations and PNEC, the three highest values are marked in red.
In the columns of maximum concentrations and PNEC, the three highest values are marked in red.
Out of the 33 detected CECs, three substances (Rifaximin, N-Methyldodecylamine, and Orlistat (Na)) were not detected in the WWTPs effluents. And conversely, ten substances (17beta-Estradiol, Ciprofloxacin, Fendiline, Metazachlor, Methoprene, Phosphate-2-Ethylhexyl diphenyl (EHDP), Phosphate-Tris(2-ethylhexyl) (TEHP), pp-DDD, pp-DDE, Trenbolone) were not detected in the WWTPs influents. The criterion of the maximum GWF of a substance being higher than 0.1 % of the maximum GWF of the substance with the highest GWF value is met by 13 substances in WWTPs influents (Fig. 2) and by 29 substances in WWTPs effluents (Fig. 3).
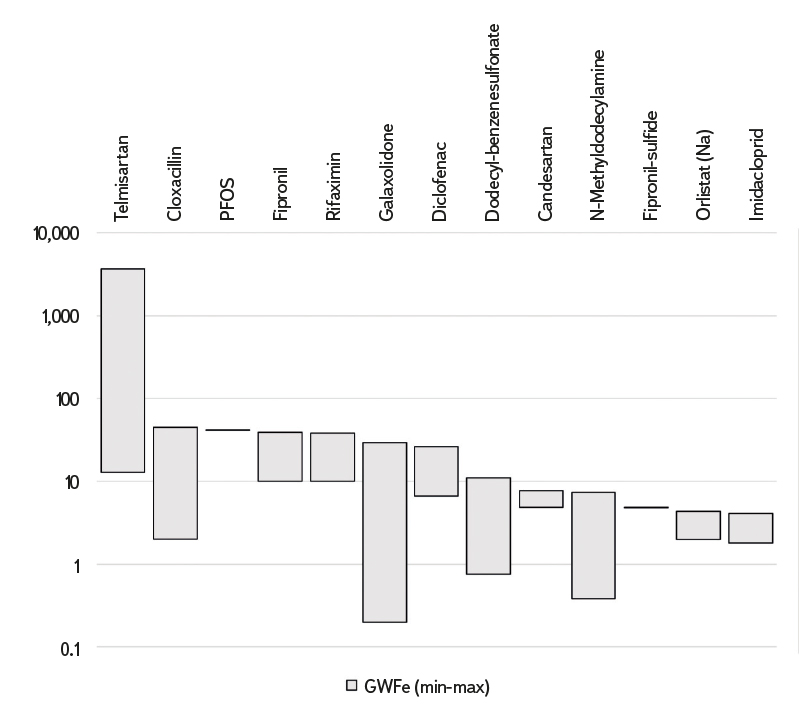
Fig. 2. Maximum and minimum GWF of risk substances at the WWTP inflows
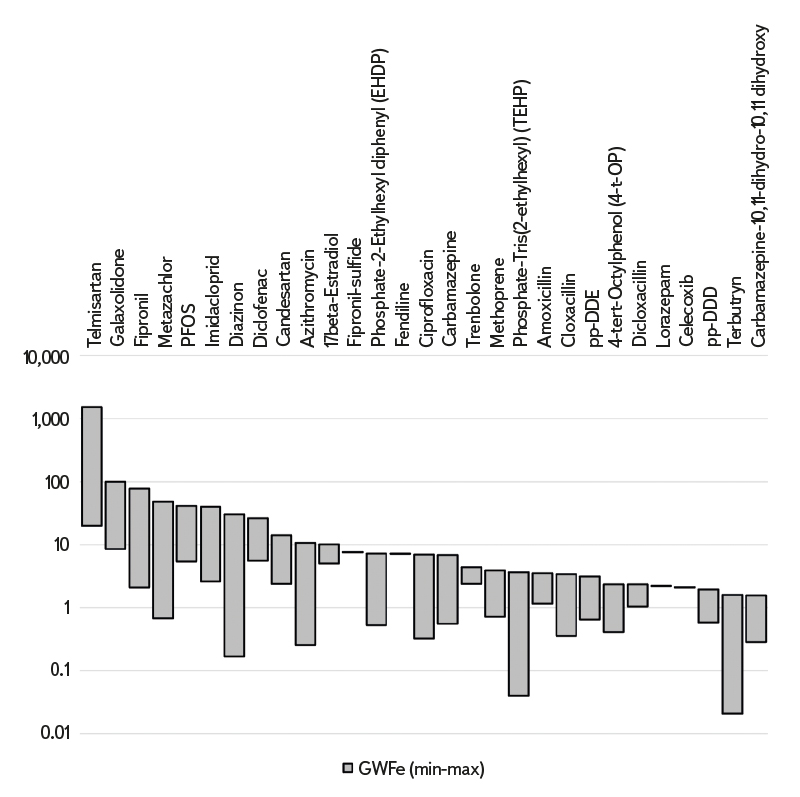
Fig. 3. Maximum and minimum GWF of risk substances at the WWTP outflows
The highest GWF, in both influent and effluent to/from WWTPs, was for Telmisartan (used for treating high blood pressure). The GWF of Telmisartan in the influent of WWTPs is more than 80 times higher than the second-highest GWF caused by the antibiotic Cloxacillin. In the case of WWTP effluents, the GWF of Telmisartan is more than 15 times higher than the second-highest GWF caused by Galaxolidone (a metabolite of the synthetic musk Galaxolide), whose maximum measured concentration in discharged wastewater was the highest among all monitored substances, almost 12 times higher than of Telmisartan. Within the JDS4, Galaxolidone was detected in all studied environmental matrices (WWTP influents and effluents, river water, groundwater, and biota) which confirms its high mobility and potentially high ecological risk.
DISCUSSION
Uncertainties associated with the use of PNEC
The use of PNEC values instead of maximum permitted concentrations (Cmax) in Equation 1 leads to some uncertainties in the results obtained. The first uncertainty lies in the representativeness of the determination of PNEC values for individual substances. PNECs are based on toxicity and ecotoxicology tests that are performed on specific organism species and under certain conditions. Ecotoxicological data used to determine PNEC can be acquired from various studies that differ in the methods and conditions used. These differences can lead to different PNEC values for the same substance. For example, in this study, the contaminant of most concern is Telmisartan. This is due to a combination of high concentrations of this substance in wastewater and concurrently very low PNEC values (55 ng/L), which were adopted from the source study [3]. However, in other studies, even lower PNEC values for Telmisartan can be found, e.g. 37 ng/L [25] or 26 ng/L [26]. In contrast, the continuously updated ecotoxicological database NORMAN [27] reports the last valid value of 49 µg/L (November 27, 2022), i.e. three orders of magnitude higher.
When determining PNEC, various factors must be taken into account, such as the concentration and exposure of the substance in the environment. These factors can be difficult to ascertain, potentially leading to uncertainties in PNEC values. PNECs are often determined using models. When using models for predicting the behavior of substances in the environment, uncertainties may arise as models may not accurately account for all factors affecting the behavior of substances in a given environment. For emerging contaminants, sufficient toxicological data are not always available for a robust PNEC value determination. In such cases, it can be difficult to determine a safe level of exposure in the environment.
Another uncertainty lies in the unclear interaction between individual substances. PNEC values are determined for individual substances and do not provide information on how these substances may interact with other substances in the environment. In ecotoxicology, the interactions of CECs are addressed by the expression of mixture effects [28–30].
Comparison with other studies
The grey water footprint of pharmaceuticals and other CECs in wastewater has so far only been addressed by a few studies [17–19]. However, the aforementioned studies quantified the total GWF, while this study focuses on the GWF of a unit volume of wastewater discharged. A direct comparison of values is thus not possible. Nevertheless, it is possible to compare whether substances monitored in previous studies are also significant CECs according to the results of this study. Martínez-Alcalá et al. [19] focused solely on the four most common pharmaceuticals (Carbamazepine, Diclofenac, Ketoprofen, and Naproxen). Similar to our study, Martínez-Alcalá et al. [19] identified Carbamazepine and Diclofenac as more risky/dangerous/hazardous contaminants. In the study by Wöhler et al. [17], the highest GWF was caused by the Ethinylestradiol hormone, which was not detected in wastewater during JDS4. The main reason for the highest GWF of Ethinylestradiol refers to its extremely low PNEC value (0.00001 µg/L), used in the study by Wöhler et al. [17]. Oxazepam (anti-anxiety and depression medication) was identified as a substance with the second-highest GWF in the Netherlands but was not considered as potentially risky in this study. The reason is the use of very different PNEC values; in our study, a value of 0.37 µg/L was used, while in the study by Wöhler et al. [17], a value of 0.0019 µg/L was used. In contrast, Diclofenac had the second-highest GWF in Germany, which corresponds to the findings in our study, which also ranks Diclofenac among risky substances in terms of grey water footprint.
The GWF of a unit volume determined according to Equation 1 corresponds to the Risk Quotient (RQ) defined as the ratio between PEC and PNEC when applied to wastewater. Usually, RQ is applied to water bodies, such as rivers, lakes, and reservoirs. In some cases it has also been applied to wastewater, as in the study by Chiffre et al. [31] where the highest risk quotients refer to the antibiotics Sulfamethoxazole and Ofloxacin. Ofloxacin was not detected in wastewater at monitored WWTPs during JDS4. Sulfamethoxazole was found in wastewater during JDS4, but the GWF values (alias risk quotient) were very low, and therefore, it was not identified as potentially risky in this study. The difference between these two studies is due to the very different PNEC values for Sulfamethoxazole, which are 0.6 µg/L (this study) and 0.027 µg/L in the study by Chiffre et al. [31]. Similarly, large differences in PNEC values can be found for two other substances, Diclofenac and Ciprofloxacin, which were investigated in both compared studies. For the other monitored substances, these two studies do not overlap. This highlights the great importance of using the most reliable PNEC values based on the most recent findings, as scientific knowledge in the field of PNEC is currently rapidly evolving in relation to the attention paid by society to emerging contaminants.
Another study that dealt with the RQ of emerging contaminants in wastewater is a relatively recent Egyptian study [32]. In this work, Ampicillin, Diclofenac, and Sulfamethoxazole are identified as substances with the highest risk quotient. All these substances were found in wastewater during JDS4, but only Diclofenac was considered as potentially risky. The Egyptian study does not provide the source of the PNEC values used, but comparing the amounts of particular substances in discharged wastewater, it is apparent that effluent concentrations were 1–3 orders of magnitude higher than the maximum concentrations detected in WWTP effluents within JDS4. This implies that the amounts of these emerging contaminants discharged via treated wastewater may depend on various factors. One factor is the technological equipment of wastewater treatment plants and their ability to remove these substances. Other factors include climatic and operational conditions [33]. Another significant factor is the presence of emerging contaminants in WWTPs influents, which is influenced by a character of a sewerage-drained area, population characteristics, social and healthcare habits, etc. [34]. For example, CEC concentrations in untreated wastewater tend to be higher in the Asian region than in Europe or North America [35].
Screening vs. long-term data
Data obtained during JDS4 represent short-term wastewater monitoring. However, the variability of CECs in wastewater is subject to seasonal [36, 37] and daily dynamics. Daily dynamics can be suppressed by taking 24-hour composite samples. Seasonal dynamics cannot be captured by the screening measurements within JDS4. A very interesting insight into the CEC seasonal dynamics in wastewater is provided by a recently published study of two WWTPs in Ireland [38], where most of the monitored CECs showed high variability throughout the year. Given that the published data do not show a clear dependence on the season and often fluctuate randomly in individual measurements, it can be assumed that these data also reflect short-term variability caused by a range of other factors.
Grey water footprint of sludge management
In this study, we did not address the issue of CEC entry into the aquatic environment via sludge dewatering and land application, although it is one of the significant sources [39–41]. Currently, there is no sufficient data to quantify CEC entry from sludge management into the aquatic environment.
CONCLUSION
This study focused on the significance of particular CECs detected in wastewater within the fourth Joint Danube Survey (JDS4). With regard to the objectives of the study – determining the significance of individual substances – the grey water footprint of a unit volume of wastewater was determined (i.e. not the total grey water footprint). Telmisartan, used to treat high blood pressure, has been tagged as the most problematic substance; this is mainly due to relatively high concentrations detected in wastewater and the very low PNEC value. Comparing the results of this study with other studies highlights the main issues that such studies currently have to face. The first issue is the selection of PNEC values. For particular CECs, very different PNEC values can be found in the literature, which can differ by several orders of magnitude. The second issue is the selectivity of most studies, which usually include only a selection of a few CECs. From this point of view, JDS4 provided a unique dataset, even though it only covered 11 selected WWTPs in the Danube river basin. However, the available data did not allow an assessment of absolute significance, for which it is necessary to know the total amount of particular CECs in the wastewater monitored, not just the maximum and minimum concentrations.
The Czech version of this article was peer-reviewed, the English version was translated from the Czech original by Environmental Translation Ltd.
