ABSTRACT
In the Czech Republic, areas morphologically, geologically and hydrologically suitable for surface water storage to mitigate the adverse effects of floods and droughts are defined through the General Plan for Surface Water Accu-mulation Areas. In the context of climate change, these locations create potential for possible adaptation measures. This article describes the assessment of the potential of selected sites for water supply under climate change condi-tions by means of hydrological and water balance modelling.
INTRODUCTION
The Czech Republic has a tradition in water resource planning. The State Plan of the Czechoslovak Republic (1954) was the first comprehensive list of possibilities for water management use of water resources in CR. It also became the basis for spatial planning. In 1975, the Indicative Water Management Plan (Směrný vodohospodářský plán, SVP) was published, where increased attention was paid to the analysis, documentation of the condition, and the possibility of using water resources. It includes the claimed water needs and their outlook for the next 30 years. A total of 581 potential dam profiles suitable for the construction of water reservoirs were selected as part of the SVP, of which 286 sites suitable for this construction were documented in more detail. In 1988, the SVP Publication followed, which updated the data on sites. Due to the limitation of claims for the occupation of agricultural land, protection was cancelled for 253 sites, and 97 sites were completely eliminated. In 1995, another SVP was written, in which it was necessary to take into account the new socio-political situation and the introduction of environmental approaches in water management. The number of protected sites has narrowed to just 35. In 2007, the Plan of the Main River Basins of the Czech Republic was created, which served as a long-term concept in the field of water resource planning. One of its goals was the updating of the existing range of prospective reservoir sites and their territorial protection. The updated list included 186 sites, however, due to public opposition and the interests of nature and landscape conservation, the plan could not be approved. Therefore, in 2011, the document General Plan for Surface Water Accumulation Areas (hereinafter SWAA General Plan) was prepared. The SWAA General Plan was developed following the territorially protected sites in the SVP 1988. Property law, socio-economic and environmental aspects were assessed for individual sites, and the SWAA General Plan in its final form contains 65 protected sites. In 2020, the next and so far last update of the SWAA General Plan took place. The need to update the SWAA General Plan is included in the “Concept of protection against the consequences of drought for the Czech Republic”, which was approved by the government in 2017 and also resulted from the meeting of the National Coalition Against Drought in May 2019. Both the concept and the National Coalition were created as a response to the long-term drought in 2014–2019. As part of the update, the SWAA General Plan is being expanded by another 21 sites. The SWAA General Plan 2020 [1] thus registers a total of 86 sites. of these, 31 are included in category A, i.e. among sites potentially intended for water supply reservoirs.
In the Czech Republic and in the world, considerable attention is paid to proposals for adaptation measures that should mitigate the effects of climate change. One such measure is the long-term sustainable management of water resources. It should be mentioned that adaptation measures should be comprehensive and complement each other. However, it follows from previous studies [2–5] that in the case of ensuring reliable water supplies for industry and the population, one of the appropriate measures is the use of water reservoirs. However, potential reservoirs need to be examined in the context of climate change. In particular, increasing air temperature affects evaporation from the water surface and overall evapotranspiration in the landscape, and as it was shown, for example, in [5], reservoirs in vulnerable sites may have a problem in the future to fulfil supplies with the required reliability. SWAA General Plan 2020 contains only basic data on the possible (potential) volume of reservoirs. In view of the ongoing climate change, it is necessary to check the basic water management function of potential reservoirs on SWAA (Sites for storage of surface water), namely whether these potential reservoirs would be able to compensate for negative changes in the respective catchments. A similar issue was already dealt with [6, 7], however, the results do not include the significant drought period 2014–2019. Therefore, as part of the project “Water management and water supply systems and preventive measures to reduce risks in the supply of drinking water”, 17 potential water reservoirs from SWAA category a were selected and their assessment was carried out using new data until 2020 and new climate change scenarios. Implementation follows on from the partial outputs of the mentioned project, mainly the evaluation of the security of water abstractions from existing water reservoirs [5] and the balance of resources and needs of groundwater for drinking purposes [8].
METHODOLOGY AND MATERIAL
The assessment of the possible impact of climate change on the provision of water supply by water reservoirs is based on methodology [9]. The procedures from the methodology for processing the hydrological and water management balance are applied, including simulation modelling of the storage function of water management systems. The assessment was prepared for the prospective period of 2050, the hydrological balance modelling was also carried out for time horizons with centered year 2035 and 2085.
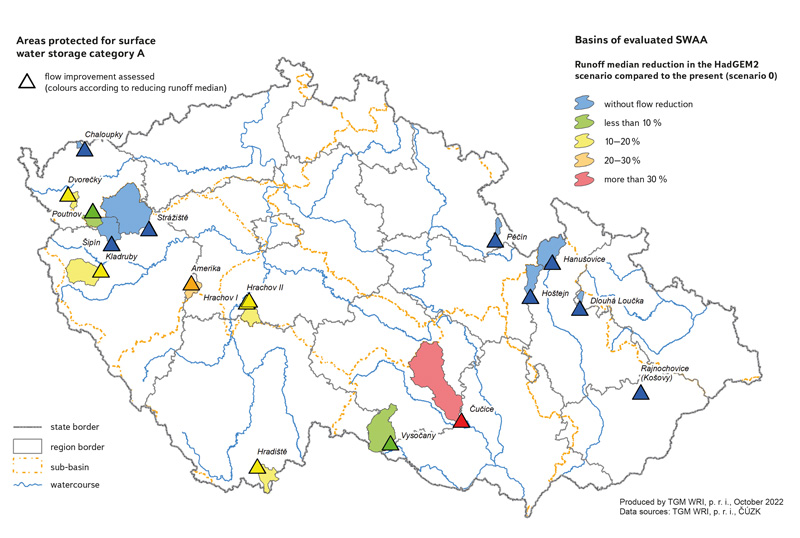
With regard to the solution to the problem of drinking water supply, the selection of evaluated sites was limited to SWAA category A. Out of a total of 31 SWAA recorded in this category, 17 sites were selected. The selection was based on the location of these sites near potentially problematic areas. Fig. 1–3 show the selection. The selected and evaluated sites are highlighted in purple. Fig. 1 shows the location of SWAA category A, in which municipalities affected by the drought in 2015 in terms of drinking water supply were identified as part of the Plans for development of water supply and sewerage for the Czech Republic [10] (the vast majority are problems with groundwater supply). Fig. 2 shows the location of SWAA in relation to ensuring the current requirements for water supply by water reservoirs in conditions of climate change [5]. For easier orientation, abstractions are divided into four groups according to the security achieved by duration and marked using a colour scale, as follows:
- a) water abstractions with reliability of current and permitted abstractions in all evaluated scenarios are marked in blue,
- b) medium-risk abstractions reliability of only current abstractions in all evaluated scenarios are marked in green,
- c) abstractions reliability of current abstractions are marked yellow only in the more favourable scenario of the impact of climate change HadGEM2,
- d) abstractions where reliability is not achieved in any of the climate change impact scenarios are marked red as high risk.
 Fig. 1. Areas protected for surface water storage category A and municipalities affected by drought in terms of drinking water supply; polygons represent municipalities
and population affected by drought
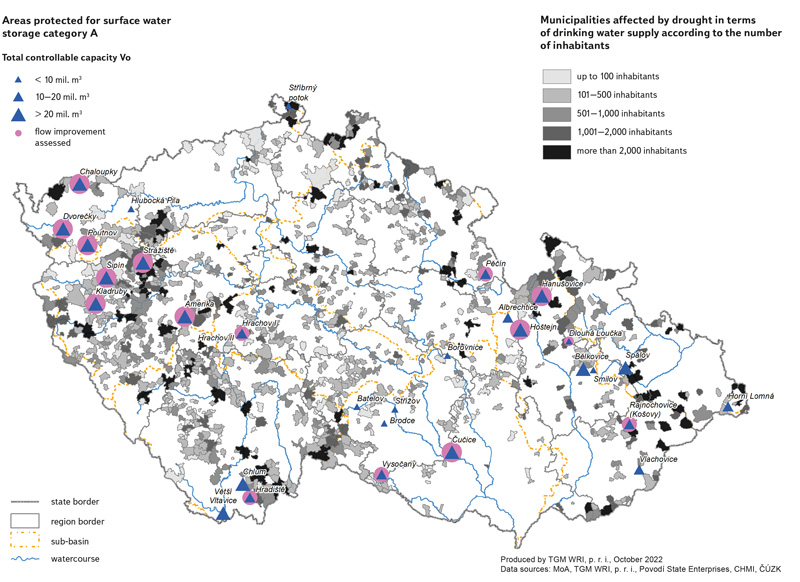
Fig. 2. Areas protected for category A surface water storage and reliability of water abstractions by reservoirs
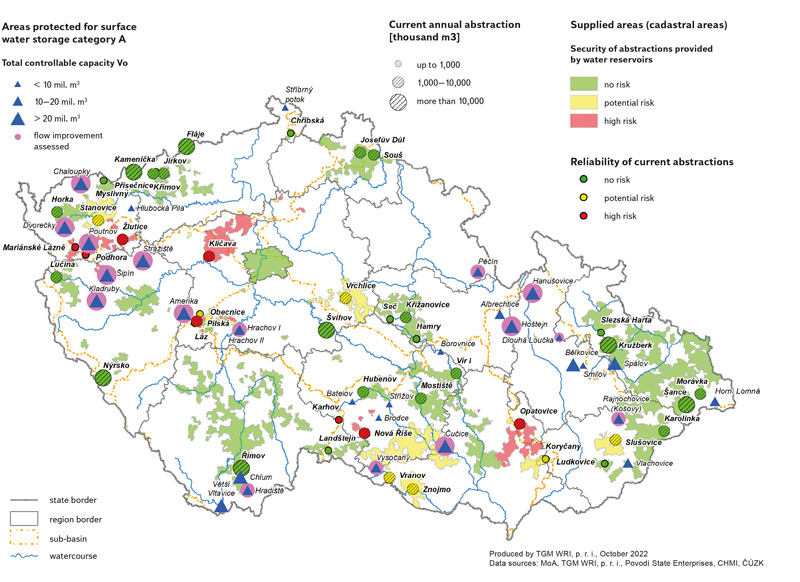
Fig. 3. Areas protected for the accumulation of surface water category A and balance risk working units of groundwater bodies
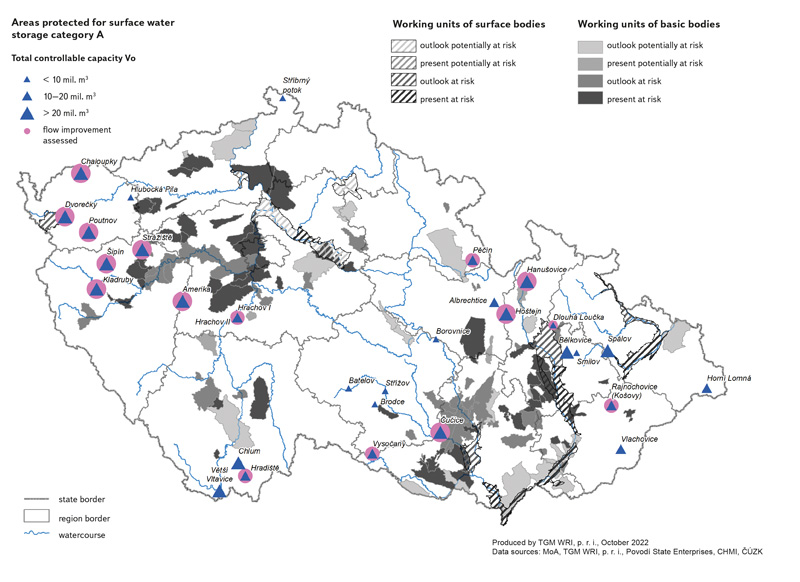
Fig. 3 shows the location of the SWAA in relation to the areas – the so-called working units of groundwater bodies –, that are evaluated as (potentially) at risk in terms of the balance of available resources and groundwater abstractions in current conditions or in conditions of climate change [8]. Selected SWAA and their characteristics are shown in Tab. 1.
Tab. 1. Selected sites and their basic characteristics
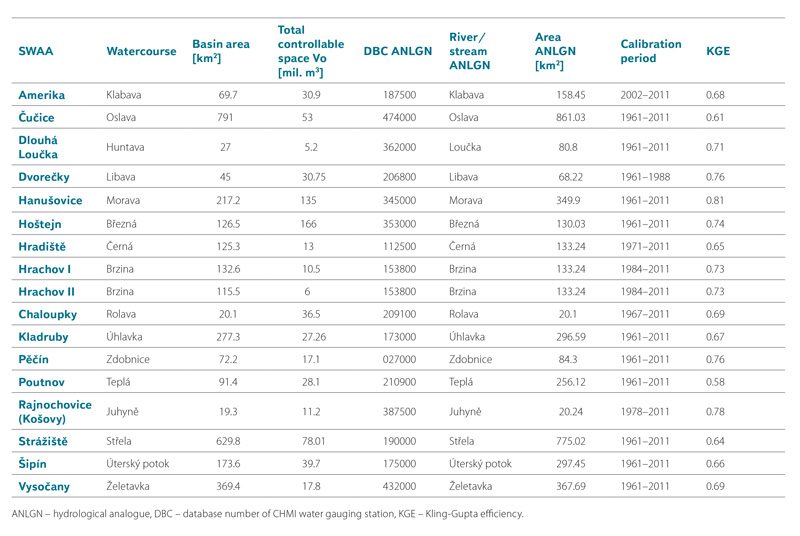
ANLGN – hydrological analogue, DBC – database number of CHMI water gauging station, KGE – Kling-Gupta efficiency.
Current climate conditions
Climate data for the period 1961–2020 was used for the actual assessment of current conditions, time series of air temperatures and precipitation. During this period, a significant increase in temperatures can be observed, especially in recent years.
This increase reaches high statistical significance. The increasing temperature affects the amount of potential evapotranspiration and, if water is available in the soil profile, then also the current evaporation. The reduced availability of precipitation totals was mainly in the periods 1969–1974, 1989–1994, and 2014–2017. When evaluating annual precipitation totals, it is not possible to trace a trend that would be statistically significant. The same applies for outflows, where no statistically significant trend can be found in the long-term average annual outflows (average for the whole of the Czech Republic). In recent years, however, a significant decrease in runoff can be observed in the summer and spring months and an increase in January, which is mainly due to liquid precipitation and snow melting due to increased temperatures.
Climate change scenarios in water management
For the preparation of climate change scenarios in the context of changes in the hydrological balance, the delta change method is used as standard in the Czech Republic, especially for studies in monthly time steps. This method consists in transforming the observed data so that the changes in the transformed quantities correspond to the changes derived from climate model simulations. Changes in average monthly precipitation totals and average monthly temperature are normally considered in the monthly step. In the daily step, it is also necessary to consider changes in the variability of quantities. Therefore, the advanced delta change method (ADC) was used to create climate change scenarios. The essence of the ADC method is to transform the observed data in a way that guarantees that the changes between the transformed and the original series are the same as the changes derived from the regional climate model. For precipitation and temperature (especially in the daily step) it is desirable that the considered transformations take into account changes in both mean and variability. Simply put, this means that the extremes can change differently than the average. When deriving precipitation changes from the climate model, the ADC method also considers systematic simulation errors. Since the temperature is transformed linearly, systematic error has no effect on the resulting temperature transformation [11].
Selected [12] Global Circulation Models (GCM) for sub-basins were transformed by the chosen method, namely:
- NorESM1-M +
- MPI-ESM-LR + HadGEM2-ES +
- GISS-E2-H + MRI-ESM1 +
- CanESM2 + GFDL-CM3
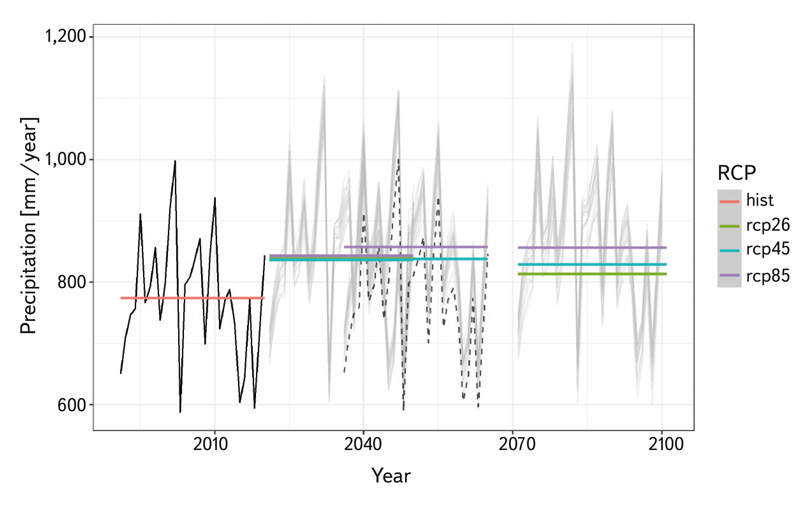
The first model (NorESM1-M) represents the centre of the series of all GCM. The MPI-ESM-LR + HadGEM2-ES models act as the driving GCM for several Euro-CORDEX RCM simulations. The same applies to the selected medium model, which is also controlled by one of the Euro-CORDEX RCMs. The GISS-E2-H + MRI-ESM1 models ensure the fulfilment of the condition to cover the inter-model variability, and the CanESM2 + GFDL-CM3 models enable the fulfilment of the last mentioned selection condition. These climate models were further tested for the possibilities of use in water management, mainly by means of hydrological balance modelling by the BILAN model, including historical runs (simulation on the already observed period). Selected RCM models were also tested. For the assessment itself, the HadGEM2-ES model was chosen, which is referred to by studies [13], recommending a medium scenario of the impacts of climate change in water management. The evolution of temperature for individual selected GCM climate models is shown in Fig. 4, where the thick black line describes the evolution of average annual temperatures for the catchment area of the analysed sites based on observations, the grey line through individual GCM simulations (analogously the annual average for all sites), and subsequent summarization based on RCP emission scenarios. It is clear that the increase in temperature is mainly due to the choice of the emission scenario, which indicates the boundary conditions of the individual GCM simulations. However, it is different for the precipitation totals, which are shown in Fig. 5. Within the simulations, there are also significant differences in the distribution of changes over the course of the year. Most simulations predict an increase in precipitation totals for the Czech Republic, which may be due to the country’s location. This phenomenon and the credibility of the above simulations for the Czech Republic are widely discussed within the professional community. Clarifications should be provided by the outputs of the TA CR “PERUN” and “Water Centre” projects, where this phenomenon is investigated.
Fig. 4. Air temperatures according to observations, individual GCM and emission scenarios RCP (grey lines describe the simulations of individual climate models, coloured lines the mean of simulations for the selected emission scenario)
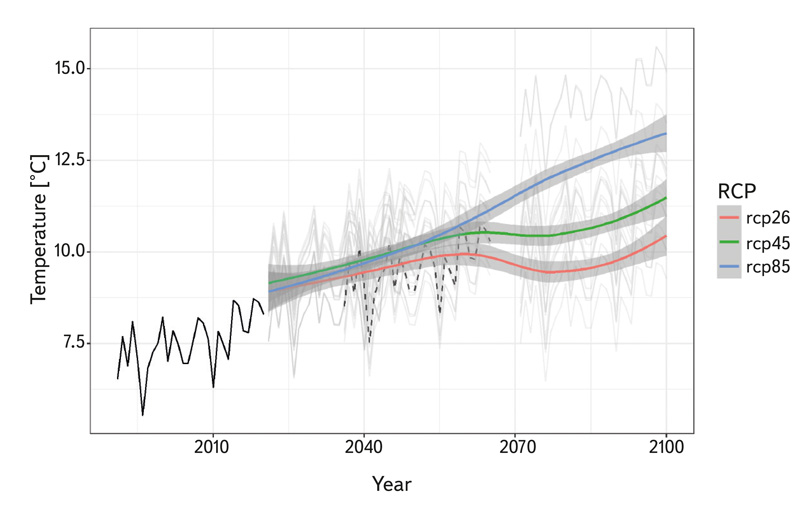
Fig. 5. Precipitation according to observations, individual GCM and emission scenarios RCP (grey lines describe the simulations of individual climate models, coloured lines the mean of simulations for the selected emission scenario)
The following scenarios were selected for the evaluation of the water management balance:
0 – indicating current conditions,
2 – the current climate warmed by +2 °C, this scenario reflects the average warming for the Czech Republic around 2050 and uses unchanged precipitation totals, i.e., it simulates the nature of changes in the hydrological regime if the temperature increase by 2 °C;
HadGEM2 – climate based on the outputs of the HadGEM2-ES Global
Climate Model and the RCPRCP4.5 emission scenario.
Hydrological balance modelling
To model the hydrological balance, the BILAN conceptual model was used, which has been developed for more than 15 years in the TGM WRI Department of Hydrology. The model calculates the chronological hydrological balance of the basin or area in daily or monthly time steps. It expresses the basic balance relationships on the surface of the basin, in the aeration zone, which also includes the vegetation cover of the basin, and in the groundwater zone. Air temperature is used as an indicator of the energy balance, which significantly affects the hydrological balance. Potential evapotranspiration, evapotranspiration, infiltration into the aeration zone, seepage through this zone, snow water storage, soil water storage, and groundwater storage are simulated during the calculation. Runoff is modelled as the sum of three components: two components of direct runoff (including hypodermic runoff) and base runoff [14–16]. The monthly version of the model, which is controlled by eight parameters, was used to model the hydrological balance. The model uses linear and non-linear reservoirs to transform precipitation into runoff. The main inputs of the model are precipitation and air temperature (also measured runoff for calibration), the output is the modelled runoff from the basin and other components of the hydrological balance.
In order to assess the impact of climate change for future outlooks, it is necessary to have a built and calibrated hydrological model for the SWAA profiles, which will allow performing variant calculations according to climate change scenarios. As there is usually no direct discharge observation for the SWAA basins, hydrological analogies must be used. The BILAN model is calibrated to an analogue that overlaps with the original basin, and the resulting parameters are transferred to the SWAA basin. Using these parameters and the new precipitation and temperatures, which are interpolated exactly to the SWAA basin, it is then possible to simulate the outflows directly for the profile of the potential reservoir. A similar procedure is used to simulate the affected outflows according to climate change scenarios. In this case, the inputs are formed by the affected precipitation and temperatures according to climate change scenarios and already known model parameters from the previous calibration.
Model calibration was performed on monthly data obtained by interpolation from a regular grid (25 × 25 km) of precipitation and temperatures for the Czech Republic [18]. The period used to calibrate the model on the analogue is shown in Tab. 1; except for SWAA Amerika, a calibration period achieved more than 20 years. When calibrating the model, emphasis was placed on a more accurate simulation of outflows in the area of lower quantiles. The goodness of fit between the observed and modelled runoff was assessed by the Kling-Gupta metric [19], the values of which are shown in Tab. 1. In general, it can be said that the closer the value is to 1, the greater the fit between modelled and observed runoff.
Hydrological modelling of climate change
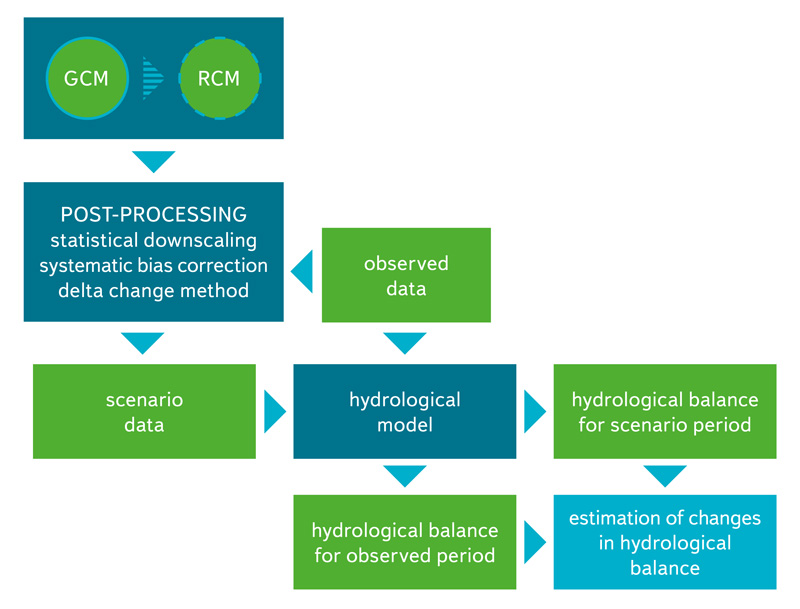
The procedure for modelling the impact of climate change on the hydrological regime (Fig. 6) can be briefly summarized as follows:
1) The selected hydrological model is calibrated for the selected catchment using observed data. A hydrological model should be based on physics to guarantee that it will provide acceptable results even for unobserved conditions.
2) The input quantities from the global and regional climate model are converted into scenario series for individual basins, namely by:
- (a.i.1.a) statistical downscaling,
- (a.i.1.b) post-processing of the output of the climate model, i.e., using the incremental method or correction of systematic errors. It is often necessary to use spatial interpolation to relate the data from the calculation cells of the climate model to the centre of gravity of the given basin. For the correct use of all methods (a–b), it is necessary to have the observed data available.
3) Using a calibrated hydrological model and scenario series, a simulation of the hydrological balance for the scenario period is carried out.
4) Modelled discharge for the present and prospective periods are corrected in individual months using the quantile method [17].
Fig. 6. Scheme of hydrological modeling of climate change impacts
Water management balance
The potential volume of water that can be provided by selected sites with a given reliability for water abstraction or minimum discharge was evaluated using a simulation model of the water management system storage function [20]. The simulation was processed in a monthly step for a total of 39 years (i.e., 468 months) for time series of unaffected monthly mean discharge and evaporation. The time series were processed using the above-mentioned hydrological balance modelling procedure. Variants representing both current hydrological conditions (scenario 0) and climate change impact scenarios were evaluated: the HadGEM2 scenario for the reference year 2050, and a warming by +2 °C scenario (scenario 2). The total controllable volume of the water reservoir listed in the SWAA General Plan [1] was considered as active storage capacity. In this regard, it is necessary to consider the resulting values of reliable abstractions (or improved discharge) as theoretical. Despite this fact, the results give an idea of the possible impact of climate change scenarios on the potential capacity of the assessed sites. In addition to the volume of water, or of the improved discharge, that can be provided by sites with a given level of reliability, other characteristics were also evaluated (see below).
RESULTS AND DISCUSSION
The result of the solution procedure described above was the quantification of the possible impacts of climate change on hydrological characteristics (discharge and evaporation from the water surface and evapotranspiration and the subsequent evaluation of the reliability of water abstractions provided by water reservoirs in these conditions. Fig. 7 shows the changes in natural runoff (scenario/present) for individual simulation scenarios and emission scenarios, in this case for the period 2071–2100. The grey lines are partial simulations for the given sites, the coloured lines are summaries for individual climate models, and the highlighted ones are the simulations used for water management evaluation. A significant variability of changes can be observed, which are mainly determined by the input climate data and uncertainties in the hydrological model simulations. The latter is calibrated on the basis of available input data, while a number of studies and research deal with the calibration strategies themselves. Fig. 8 also shows the reduction of runoff from the catchments of the assessed sites due to climate change for the HadGEM2 scenario to the reference year 2050. of the landscape)
Fig. 7. Reduction of runoff from the catchment area of potential water reservoirs (rcp26, rcp45 and rcp85 indicate groups of emission scenarios, the grey lines describe the individual climate model simulations, the thick red line the + 2 °C warming scenario and the thick turquoise line the selected HadGEM2 scenario)
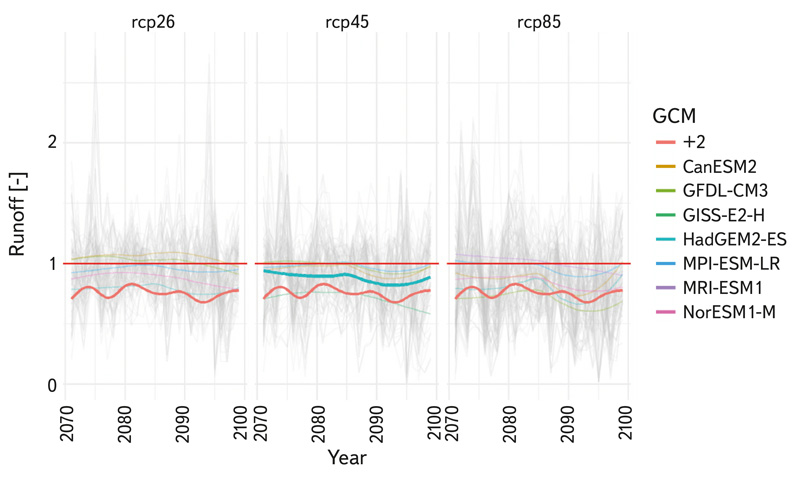
Fig. 8. Reduction of runoff from the catchment area of potential water reservoirs in the HadGEM2 scenario
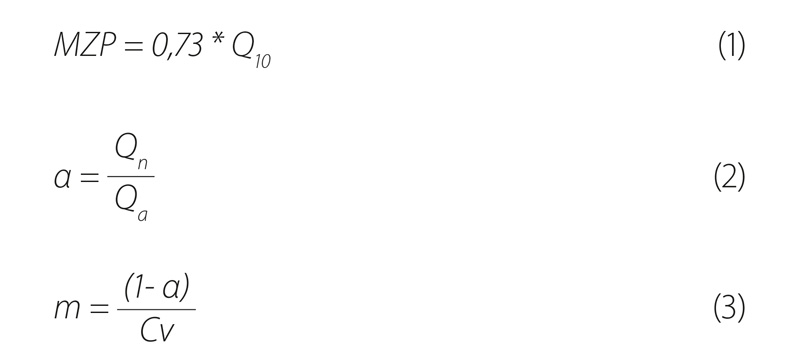
Using the simulation of the storage function of water management systems, a uniform improved discharge Qn was evaluated for individual SWAA and scenarios with reliability according to the duration pt = 99.5 % [21]. The results are shown in Tab. 2. The use of SWAA capacity (or the evaluated improved discharge Qn) for water abstraction is limited by the need to maintain the minimum residual flow rates (MRF) below the water reservoirs. The indicative value of MRF was calculated according to equation (1), where Q10 represents the 90 % quantile of mean monthly discharge. The equation was derived from the analysis of the MRF relationship calculated from daily discharge and the relevant quantile of monthly discharge for most water gauging stations in the Czech Republic. As additional characteristics, Tab. 2 also shows the values of the long-term mean discharge Qa, (which is calculated here as the arithmetic mean of a series of modelled mean monthly discharge), the improvement coefficient α calculated according to equation (2), the coefficient of variation of annual mean discharge Cv and the standardized inflow m calculated according to equation (3). According to [22], reservoirs with m ≥ 1 or m ≥ Cv have a seasonal nature of management, otherwise multi-year nature of management.
Tab. 2. Potential for flow enhancement
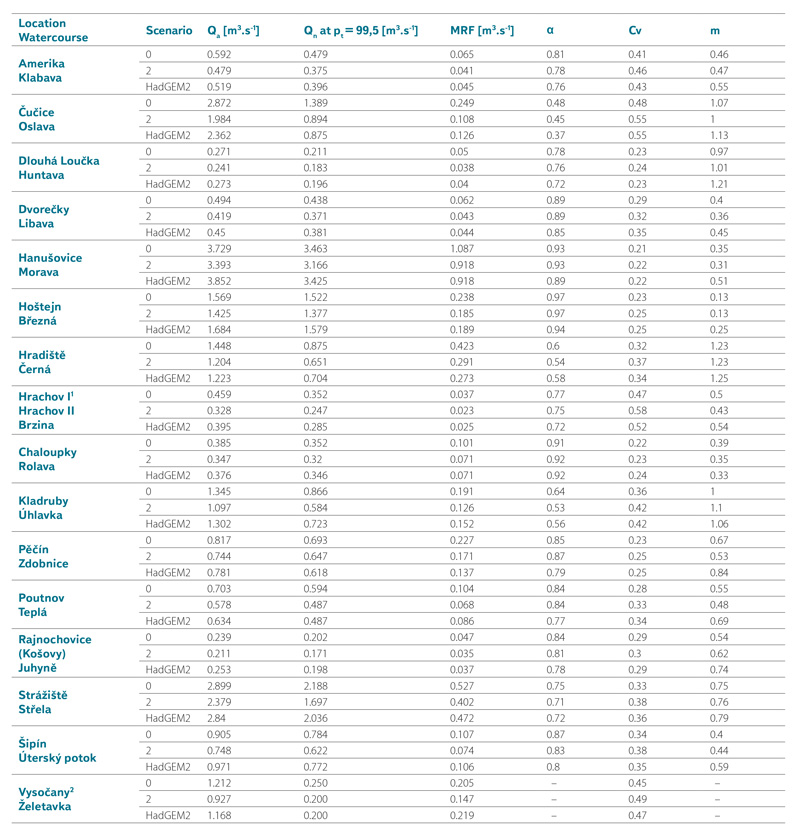
1 Considered as a system Hrachov I – Hrachov II.
2 Considered as a Vysočany – Vranov – Znojmo system. The Qn value represents the added improvement potential to the existing Vranov – Znojmo system.
From the results, by comparing the values of discharge improvement Qn in the scenarios of climate change and current conditions (scenario 0), a more significant reduction in the potential of SWAA to ensure water abstractions is evaluated especially at the sites of Čučice (over 30 % in both scenarios), Kladruby, Hradiště, Hrachov I, and Hrachov II. on the contrary, a relatively low reduction (up to 10 %) of the potential to secure water abstractions was evaluated at the sites of Hoštejn, Hanušovice, Chaloupky, and Pěčín.
Due to its location on the tributary of the Želetavka to the Vranov water reservoir, the Vysočany site was assessed in the Vysočany – Vranov – Znojmo water reservoir system. Therefore, Qn values in Tab. 2 indicate the added potential for improvement to the existing Vranov – Znojmo system for this site. Considering the total capacity of the Vranov water reservoir (in the current conditions of improvement at pt = 99.5 %, it exceeds 4 m3.s-1), the added effect of the Vysočany site is relatively low. The Vranov water reservoir is multi-purpose and current water abstractions from the Vranov – Znojmo system make up a smaller share of the total requirements placed on its storage function. Hrachov I and Hrachov II water reservoirs, on the Brzina river, were also considered as a system.
As part of the water management solution for reservoirs, the entire potential volume of the reservoir listed in the SWAA General Plan [1] was considered as active storage capacity. In this regard, it is necessary to take the resulting values of reliable abstractions (or improved discharge) as theoretical. For example, the volume of dead storage, the values of which are not currently available, was not considered. The improved discharge will thus be lower in real terms. However, despite this fact, the results give a good idea of the possible impact of climate change scenarios on the potential capacity of the assessed sites.
CONCLUSION
The goal of the solution described above was to evaluate the possible impacts of climate change on the capacity of areas protected for surface water storage (SWAA). Considering the significant uncertainties in the prediction of climate change scenarios, a variant solution was chosen: the HadGEM2 climate change scenario for the reference year 2050, and the (less favourable) scenario of a current climate warming of 2 °C were assessed. The evaluation was done for 17 sites considered to ensure water abstractions and located near potentially problematic areas in terms of drinking water supply. Hydrological and water management balance modelling procedures were applied during the assessment of SWAA capacities. The solution results are shown in Tab. 2. A more significant reduction in the capacity to ensure water abstractions due to climate change was evaluated especially at the sites of Čučice, Kladruby, Hradiště, Hrachov I, and Hrachov II. In contrast, a relatively low reduction in capacity was evaluated at the Hoštejn, Hanušovice, Chaloupky and Pěčín sites. With the exception of the Čučice and Kladruby sites, the reduction in capacity compared to current conditions did not exceed 30 % for any site. The results in the form of variant scenarios therefore draw attention to a possible reduction of the improved discharge and an increase in the coefficient of variation, which is an indicator of the fluctuation of the hydrological regime. A more detailed study of the area, including possible water transfers, prospective water needs, etc., is needed to decide whether a given reservoir could help a deficit region.
Acknowledgements
This article was created on the basis of research carried out as part of project VI20192022159 “Water management and water supply systems and preventive measures to reduce risks in the supply of drinking water” of the BV III/1-VS programme, which is financed by the Ministry of the Interior of the Czech Republic.
The Czech version of this article was peer-reviewed, the English version was translated from the Czech original by Environmental Translation Ltd.
