SUMMARY
The basic meteorological variables that affect the hydrological regime are atmospheric precipitation and air temperature. Both fluctuate not only in the short term and in the annual cycle, but also in the long term. Long-term changes in both of these variables have the character of periodic fluctuations around the mean values. Since about 1980, there has been a systematic increase in air temperature in the Czech Republic. This article provides information on how the climate fluctuations that this change brings affect the precipitation and runoff regime in our territory.
In the first part of the study, we used long-term observations of flows in the river Elbe in Děčín since 1851 and precipitation in its catchment area and compared the deviations in precipitation and runoff from the period after 1980 with the extremes of fluctuations in the previous period. Fluctuations in forty-year moving averages of annual and seasonal precipitation and annual and seasonal runoff, with the exception of an increase in winter runoff, did not deviate from the range in which they fluctuated in the period 1851–1980.
In the next part, we focused on the assessment of possible deviations in precipitation and runoff during the warming period in seven major river basins from different areas of the Czech Republic. In the period 1981–2019, compared to the previous period 1961–1980, the average annual precipitation in four river basins increased by 2% to 4%, in the Ohře river basin by 7.5%. In the Elbe river basin (above its confluence with the Vltava) the increase was by about 1%. In the Odra river basin the annual rainfall averages decreased by 3%. The increase in annual precipitation was mainly due to increases in winter and autumn precipitation, with significant decreases in spring precipitation in three river basins and summer precipitation in two river basins. The average flow in the period 1981–2019 was lower at all compared gauging stations than in the period 1961–1980, on a relative scale by up to 17% at the Bohumín (Odra river) station and by at least about 2% at Louny (Ohře river).
When comparing the results for the Sázava, Lužnice, Berounka, and Ohře, we found that, from east to west, the decreases from values slightly exceeding 10% change to practically unchanged flow of the Ohře.
INTRODUCTION
The Hydrological Service in the Czech Republic has traditionally related the characteristics of average flows to a specific „representative“ period from which data were used to derive them. The principal publication [1] Hydrological conditions of the Czechoslovak Socialist Republic was based on the period 1931–1960. A change did not occur until 1980, when the thirty-year period was extended to a fifty-year period of 1931–1980, evaluated in a 1997 study [2]. Further assessment of possible changes in the hydrological regime is contained in [3], which compares the precipitation and flow characteristics from 1981–2010 with those from 1931–1980, which the Czech Hydrometeorological Institute has been using since 2013. The results of this study concluded that there were no significant changes in annual precipitation totals and significant differences in flow characteristics due to natural change in runoff conditions. Immediately after 2013, a multi-year hydrological drought occurred in the Czech Republic, which, according to the study [4], was the longest of all droughts in the Elbe river basin since 1851.
In this study, we try to find out whether using the observed series of precipitation and flows until 2019, which includes the period of drought (precipitation and hydrological), we find the effect of warming on long-term averages of precipitation and flows. In the first part of the study, we took long-term observations of flows of the river Elbe in Děčín since 1851 and precipitation in its catchment area; these were compared with changes in forty-year average precipitation and runoff from the period after 1980 with their fluctuations in the previous period unaffected by intense warming. In the following part, we focused on the assessment of possible changes in precipitation and runoff after 1980 in regional differentiation; that is, we focused on how the average precipitation and runoff in river basins in different areas of the Czech Republic in the period 1981–2019 differ from the averages in the period 1961–1980, in which the air temperature was not yet increasing significantly.
COMPARISON OF PRECIPITATION AND RUNOFF ON THE ELBE RIVER BASIN IN THE PERIOD 1981–2019 WITH THEIR LONG-TERM FLUCTUATIONS
We first dealt with changes in long-term average precipitation and long-term average runoff levels during the warming period compared to their long-term fluctuations between 1851–2019. The choice of the Elbe river basin in Děčín is due to the fact that it occupies a substantial part of Bohemia and a long-term series of average monthly precipitation and runoff from the period 1851–2019 has been prepared for it. Since 1851, water levels have been systematically monitored on the Elbe in Děčín, and later in his work [5] Novotný reconstructed the flows for the historical period. We used flow values supplemented by water abstraction, wastewater discharge, and activities on water reservoirs in the catchment area. These data have only been available since 1979, which may add additional inaccuracy to the comparison results for seasonal and monthly averages.
Average precipitation in the Elbe river basin in Děčín in 1851–1875 is burdened by considerable uncertainty. Until 1828, it is estimated only from observations from Klementinum; from 1829, observations in Havlíčkův Brod were added, and from 1848, observations in Čáslav were added. Data from 55 stations have been available since 1876 and from 382 precipitation stations since 1880.
Air warming, which is part of global climate change, has been intense in the Czech Republic since 1980. This phenomenon is evident in the display of deviations of moving average air temperatures for a forty-year period in the Elbe river basin in Děčín, calculated by the difference in a number of annual averages from 1851–2019 from the average temperature for this period (see Fig. 1). Fig. 1 also shows the deviations of the forty-year moving averages of average annual precipitation and annual levels of runoff from this river basin in the form of relative values in [%] of averages for the whole period.
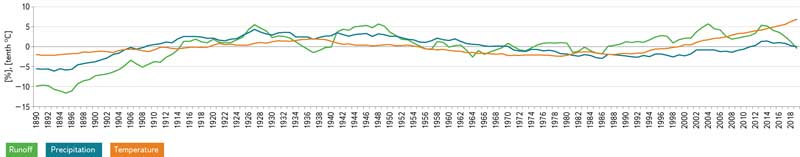
Fig. 1. Relative deviations of forty-year moving averages of average annual precipitation and annual runoff heights in [%] and deviations of forty-year moving averages of average annual air temperatures, scale in tenths of °C
Analysis of the longest series of monitored flows in the Czech Republic, for example in the study of long-term fluctuations of Vltava flows in Prague [6], revealed that average flows fluctuated to a significant degree in the past. The fluctuations have periodic components, which is also evident in the data from watercourses worldwide, as demonstrated by Pekárová [7]. This phenomenon must be taken into account when assessing the possible effect of warming on changes in runoff regime.
Fig. 1 shows that, even with a relatively long averaging interval of 40 years, precipitation averages fluctuate around 10% and the fluctuation has a cyclic character, with a wavelength of about 90 to 100 years. If the nature of the fluctuations has not changed, we are currently on the ascending part of the cycle. Květoň and Žák came to the same conclusion [8] during the evaluation of the precipitation series 1808–2019 from the Prague Klementinum station.
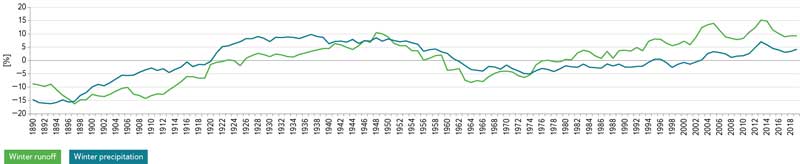
Fig. 2. Relative deviations of forty-year moving averages of average precipitation and runoff heights for the months December to February
Leaving aside the different courses of relative deviations of forty-year moving averages of precipitation and runoff before 1915, which may be related to the uncertainty of precipitation estimates before 1875, we find a similar course of deviations of both quantities until about 1988. Then, until 2013, runoff deviations are relatively greater than precipitation deviations. The following period of drought caused a decrease in runoff; therefore, the forty-year averages of precipitation and runoff for the period 1981–2019 are very close to the averages for the whole period 1851–2019, and thus the effect of warming is not apparent in the long-term annual averages of precipitation and runoff from the period of intense warming in the data for the Elbe river basin in Děčín.
To clarify which phases of the annual runoff cycle contributed to the described difference in runoff and precipitation deviations, we created graphs comparing the relative deviations of the forty-year averages of precipitation and runoff from the four seasons. The year is divided into the period December to February (winter), March to May (spring), June to August (summer), and September to November (autumn).
The courses of forty-year moving averages of seasonal average precipitation and runoff show the following:
Winter precipitation and runoff have had an upward trend since about 1975, and runoff has deviated from the range of values that occurred in the previous part of the series since 2002. This can be explained by the fact that due to higher temperatures, more snow will melt during the winter due to increasing precipitation.
Spring precipitation from the above-average level in 1933 decreased by about 10% to the level of 1983, and then i fluctuated only slightly around this level. Runoff from the maximum in 1927 decreased by about 18% by 1980, and then were increasing until 2013. After a short decrease in runoff, the deviations in precipitation and runoff in the forty-year period 1981–2019 almost agreed at the level of −4% to −5%.
On a relative scale, summer precipitation did not fluctuate much in the long run, in contrast to summer runoff; its course deviates significantly from the course of precipitation than in other seasons. In the forty-year periods ending before 1925, the precipitation estimate is probably less accurate. In the following period, until about 1954, the course of runoff deviations and precipitation deviations did not differ much. After 1954, the difference between runoff and precipitation deviations gradually increased. We explain this by the fact that during the summer floods in 1954, 1981, 1997, and 2002, the runoff coefficient from several days of intense precipitation was significantly higher than from a comparable total of less intense precipitation distributed over a longer period of time. After 2002, the relative deviations of runoff were decreasing, in the forty-year period 1981–2019, after a period of hydrological drought, up to the value of −4%.
Autumn precipitation and runoff were similarly decreasing from the level after 1941 by about 16% until 1988, then again increased similarly to average values; runoff after 2013 decreased to −4%.
The course of the quantities in Fig. 3 to 5 result in the following findings:
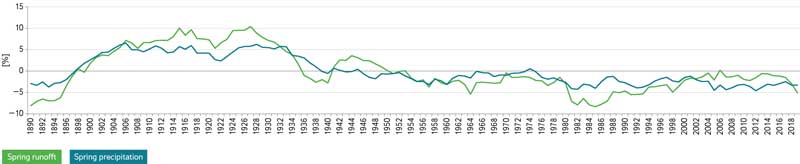
Fig. 3. Relative deviations of forty-year moving averages of average precipitation and runoff heights for March to May
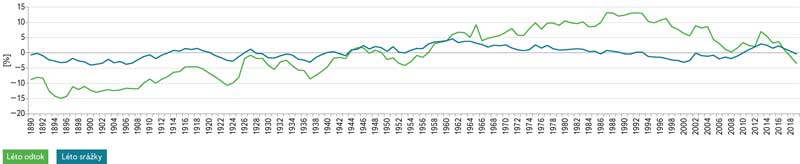
Fig. 4. Relative deviations of forty-year moving averages of average precipitation and runoff heights for the months June to August
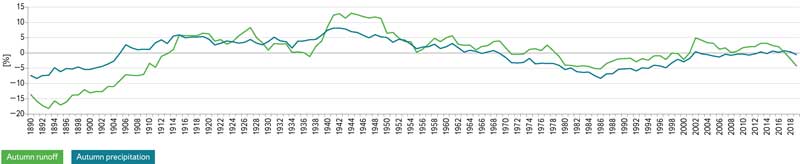
Fig. 5. Relative deviations of moving averages of average precipitation and runoff heights for the months of September to November
The fluctuations of the forty-year moving averages of seasonal precipitation and runoff, with the exception of the rise in winter runoff in the period after 2002, did not deviate from the range in which they fluctuated in the period 1851–2019.
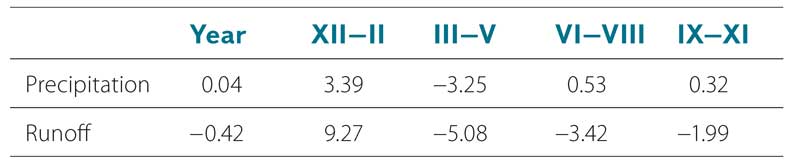
According to the data from Tab. 1, the annual average precipitation in the Elbe river basin in Děčín practically did not change. The increase in winter precipitation and the decrease in spring precipitation are obvious. The changes in runoff are larger on a relative scale; the increase in winter runoff is in contrast to the decrease in other seasons.
Tab. 1. Relative deviations of annual and seasonal precipitation and runoff in the Elbe river basin in Děčín [%] in the period 1981–2019 with respect to the whole period 1851–2019
When assessing the relative deviations of average seasonal precipitation and runoff, it is necessary to keep in mind that they are related to significantly different values of long-term averages, so that their share in the deviations of annual averages is quite different – see Tab. 2, which shows the percentages of averages of seasonal precipitation and seasonal runoff on the annual average.
Tab. 2. Shares of averages of seasonal precipitation and seasonal runoff on the annual average [%]
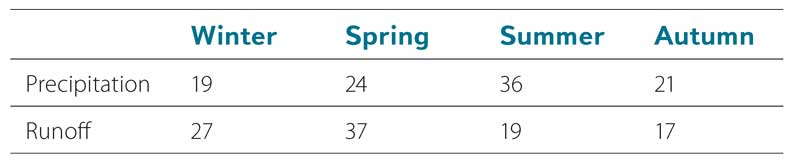
Although summer precipitation outweighs precipitation from other seasons, summer runoff is only half the spring runoff and exceeds the share of winter runoff from significantly less precipitation.
For the analysis of the trend and changes in the trend in the series of annual and seasonal precipitation and runoff, we also used statistical analysis with the software methodologically described in [9]. The CTPA application allows the use of a series of statistical tests that assess, for example, the following hypotheses: the series has a normal distribution; the members of the series are statistically independent; the series has a change in average; the series shows a trend; there is a change in trend in a series. Several methodologically different tests can be used to verify some hypotheses.
For testing, we first used a series of annual precipitation levels and a series of precipitation levels for the seasons defined above. At the significance level of 0.05, the hypothesis of a normal distribution and independence of members for all tested series was not rejected. A statistically significant change in the average was indicated for the annual series in 1991 and for the winter series in 1993. The overall trend of the annual series is upwards by 0.187 mm/year, for the winter series by 0.174 mm/year; however, it is only statistically significant for the winter series.
The results for the runoff series are more uncertain when using the significance level; the series do not correspond to the normal distribution. There are autocorrelations in many annual values. The algorithm used indicated a change in the trend in 1965 from ascending to declining.
The results of the comparisons can be summarized in the conclusion that, apart from the increase in winter runoff, we did not find any changes that would demonstrate a more significant effect of warming on long-term precipitation and runoff. The forty-year averages of precipitation and runoff did not deviate from the range in which they occurred during a period when the air temperature did not increase intensively for a long time.
COMPARISON OF AVERAGE PRECIPITATION AND RUNOFF IN THE CZECH REPUBLIC
We assessed the variability of precipitation and runoff changes in the Czech Republic according to the deviations of the averages from the period 1981–2019 from the averages from the period 1961–1980. The choice of these periods was influenced by the requirement for available data – synchronous observation of precipitation and runoff at gauging stations. We assessed averages from whole years, seasons and, partly, from individual months. We selected a set of river basins which allows us to assess regional differences in changes in precipitation and runoff. In the first stage, data from the final gauging stations of large river basins were used; later, the assessment was supplemented by stations characterizing the variability of conditions from mountain to lowland river basins.
Comparison of precipitation and runoff averages 1981–2019 and 1961–1980 for the Elbe river basin in Děčín
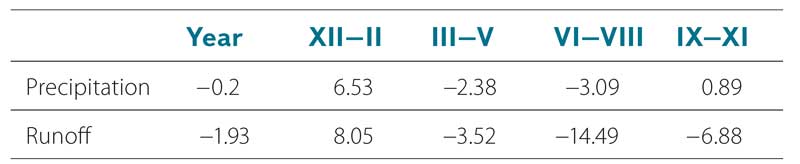
The relative deviations of annual and seasonal precipitation and runoff in the Elbe river basin in Děčín [%] in the period 1981–2019 from averages of the period 1961–1980 are shown in Tab. 3. In comparison with Tab. 2, we find that the significant deviations are similar in both tables; a larger difference in Tab. 3 is in the decrease in autumn runoff and it probably affects a larger – albeit statistically insignificant – decrease in the annual average.
Tab. 3. Relative deviations of annual and seasonal precipitation and runoff in the Elbe river basin in Děčín [%] in the period 1981–2019 with respect to the period 1961–1980
A comparison of relative changes in precipitation and runoff levels [%] in individual months for the Elbe river basin in Děčín is shown in Fig. 6. There is a continuous increase in precipitation from December to March, with the exception of February. It is worth noting that, after the increase in March, precipitation decreases in April. Decreases in runoff from May to September can be attributed to less precipitation in the spring and more intense evapotranspiration during the growing season due to rising air temperatures.
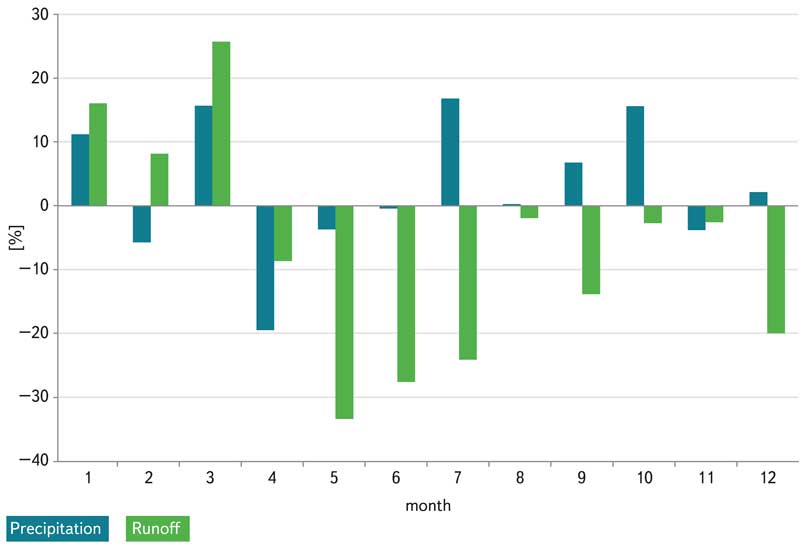
Fig. 6. Relative deviations in average precipitation heights and runoff heights in individual months for the Elbe river basin in Děčín in the period 1981–2019 with respect to the period 1961–1980
Comparison of precipitation and runoff averages 1981–2018 and 1961–1980 in large river basins
In the next stage of the calculations, we processed data from the river basins of gauging stations which are close to the lower profiles of the larger river basins of watercourses listed in Tab. 4. Relative deviations of average annual and average seasonal precipitation in the period 1981–2019 with respect to the period 1961–1980 are listed in Tab. 5 and shown in Fig. 7 and 8.
Tab. 4. List of river basins of gauging stations representing large river basins in the Czech Republic
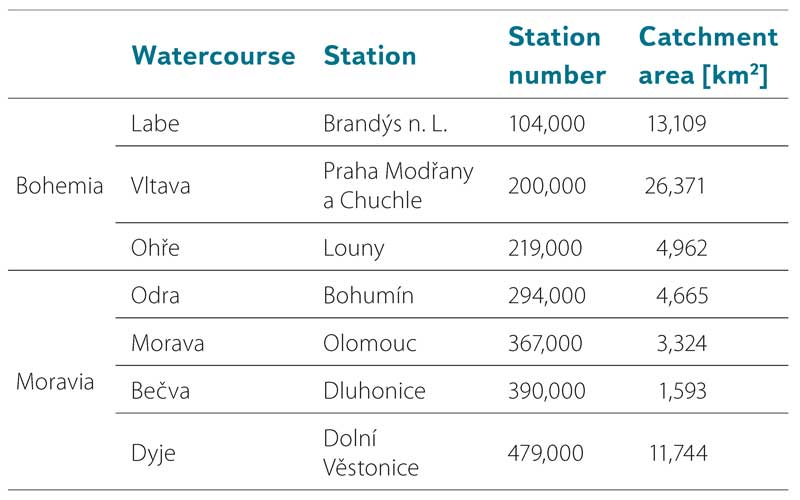
Fig. 7 shows that in most river basins in the period 1981–2019, compared to the previous period 1961–1980, the average annual precipitation increased by 2% to 4%, in the Ohře river basin by 7.5%. In the Elbe (above the Vltava confluence), at the Brandýs n. L. station, the annual precipitation averages decreased slightly, and the annual precipitation averages in the Odra river basin decreased significantly.
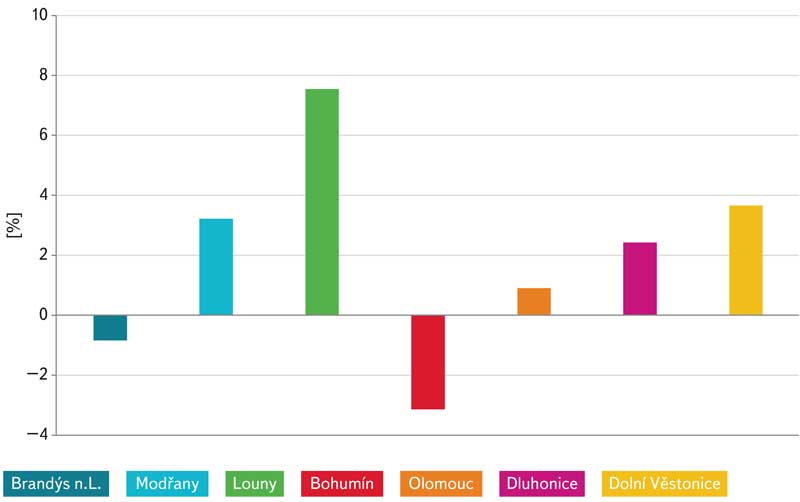
Fig. 7. Relative deviations of annual precipitation averages in the catchment area of gauging stations in the period 1981–2019 with respect to the period 1961–1980
Fig. 8 and Tab. 5 show that the increase in annual precipitation was mainly due to increases in precipitation in the winter and autumn months, only in the Ohře river basin and slightly in the Vltava river basin was it also due to summer precipitation. Decreases in spring precipitation are more significant in the Elbe and Odra river basins. Summer precipitation decreased in the Odra and Moravia river basins. Changes in precipitation in the Czech Republic in the warming period, assessed according to average precipitation in selected larger river basins, are clearly different in the river basins in the northern part of the territory from the river basins in the southern and western parts of the Czech Republic.
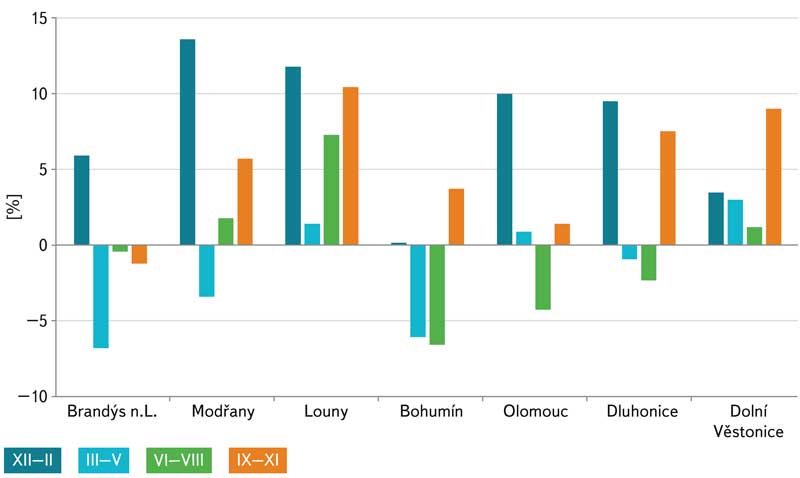
Fig. 8. Relative deviations of seasonal average precipitation in the catchment area of gauging stations in the period 1981–2019 with respect to the period 1961–1980
Tab. 5. Relative deviations of average annual and average seasonal precipitation in the period 1981–2019 with respect to the period 1961–1980 in [%], decreases are highlighted
Changes in average precipitation from individual calendar months listed in Tab. 6 and shown in Fig. 9 reach larger values on a relative scale than the deviations of the seasonal averages. The fluctuation of changes in the neighbouring months during the year is confirmed. January averages (excluding the Elbe and the Odra) show increases of over 20%, with slight declines prevailing in February, with the exception of Bečva, where an insignificant increase was recorded. In March, precipitation increased or did not change in all river basins, and decreased (with one exception) from April to June. The July increase (except for the Odra and Morava) is followed by slight and small disparate changes in August. In September, precipitation increased in all river basins in Moravia even above 20%; the increase in October is especially noticeable on the Vltava and Ohře rivers. In November (except Ohře) there is a typical decrease below 10%, in December an increase of 6% to 10%, in Brandýs n. L. only by 1%.
Tab. 6. Relative deviations of average monthly precipitation in the period 1981–2019 with respect to the period 1961–1980 in [%]
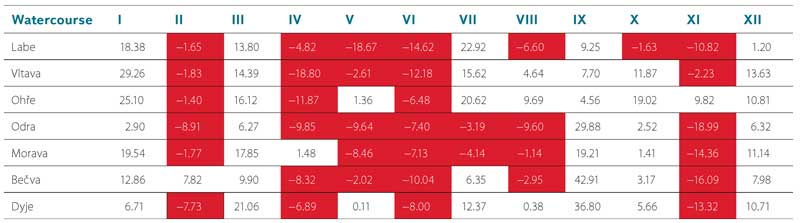
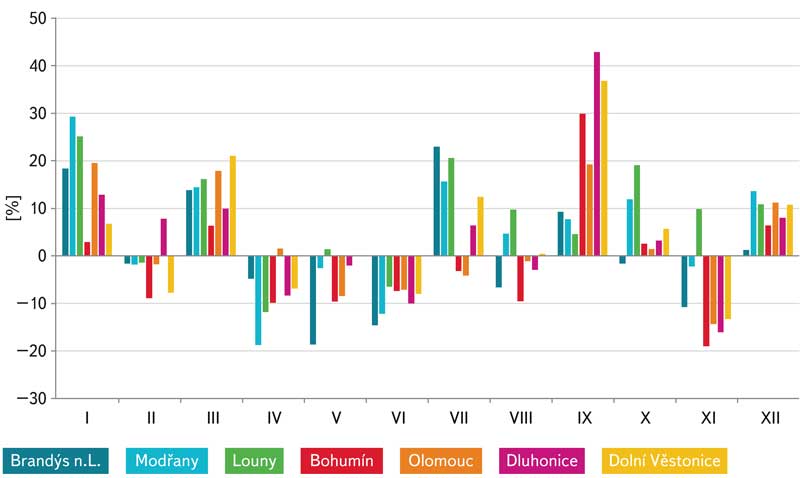
Fig. 9. Relative deviations of monthly precipitation averages in the catchment area of gauging stations in the period 1981–2019 with respect to the period 1961–1980
As the changes in precipitation in the neighbouring months have the opposite trend prevailing; in the January–February, March–April, June–July, and November-December pairs in particular, changes in seasonal averages expressed in percentages are levelled to significantly smaller values. The constant decrease in precipitation in the period from April to June is unfavourable for the agricultural sector.
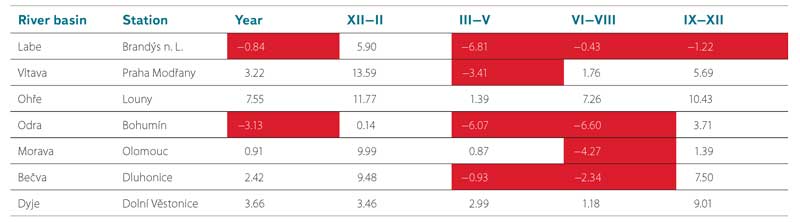
Deviations of annual flow averages in Tab. 7 and Fig. 10 show that the average flows in the period 1981–2019 were lower in all compared stations than in the period 1961–1980, on a relative scale by up to 17% at the Bohumín station on Odra, and at least by about 2% in Louny on Odra.
Tab. 7. Relative deviations of average annual and average seasonal flows in the period 1981–2019 with respect to the period 1961–1980 in [%]
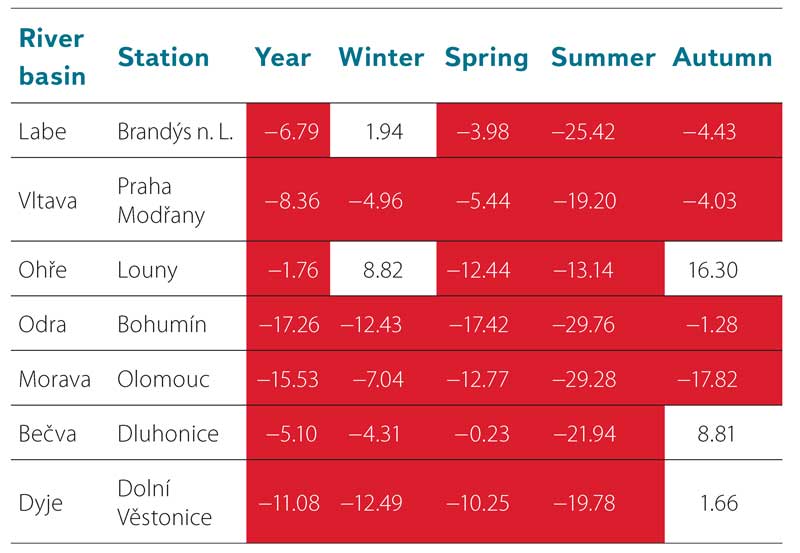
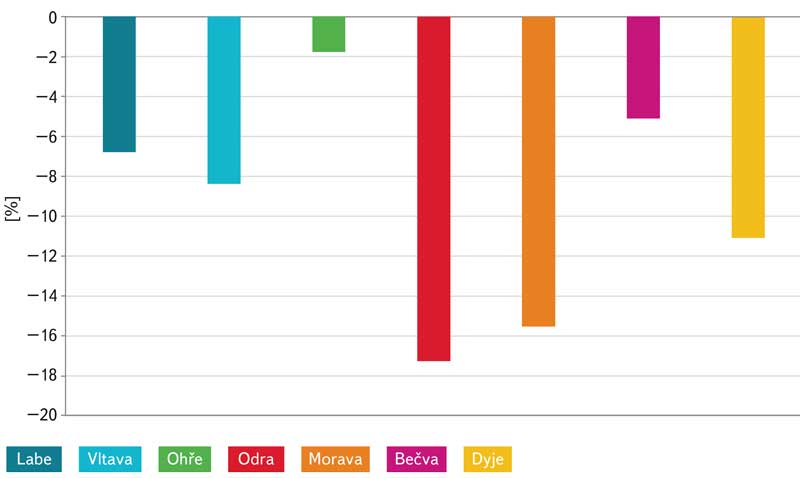
Fig. 10. Relative deviations of average annual flows in the period 1981–2019 with respect to the period 1961–1980
Relative deviations of seasonal average flows are shown in Tab. 8 and Fig. 11. In the winter, the flow averages did not decrease only on the Elbe in Brandýs n. Labem and in Louny. In the spring and summer, the flows at all monitored stations decreased, mostly on the Odra in Bohumín by 17% in the spring and by about 30% in the summer. Autumn flows decreased on the Elbe, Vltava, Odra, and Morava (here more significantly – by about 18%), while the largest increase was recorded on the Ohře.
Relative deviations of the average monthly flows from individual months in the period 1981–2019 with respect to the period 1961–1980 in [%] are listed in Tab. 8.
Tab. 8. Relative deviations of average monthly flows in the period 1981–2019 with respect to the period 1961–1980 in [%]
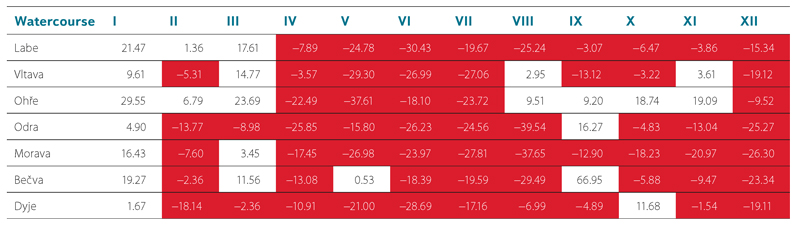
Fig. 11. Relative deviations of seasonal average flows in the period 1981–2019 with respect to the period 1961–1980
Fig. 12 shows that the change in seasonal distribution of flows in the Ohře is different from the Vltava and Elbe river basins; the changes for the Moravian watercourses differ significantly only in September, see Fig. 13.
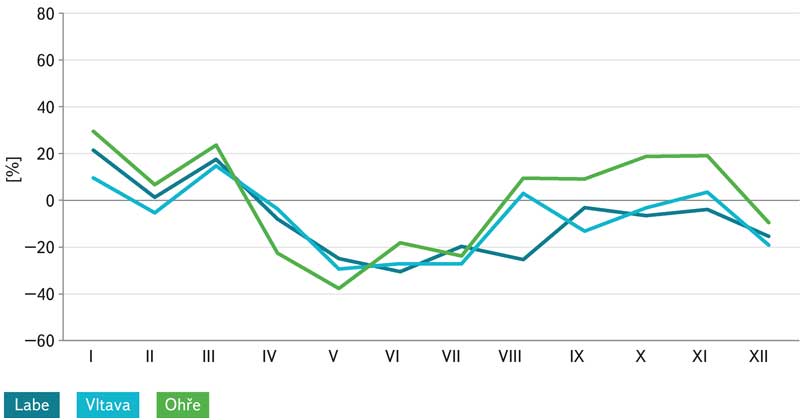
Fig. 12. Relative deviations of monthly average flows in the period 1981–2019 with respect to the period 1961–1980 – river basins in Bohemia
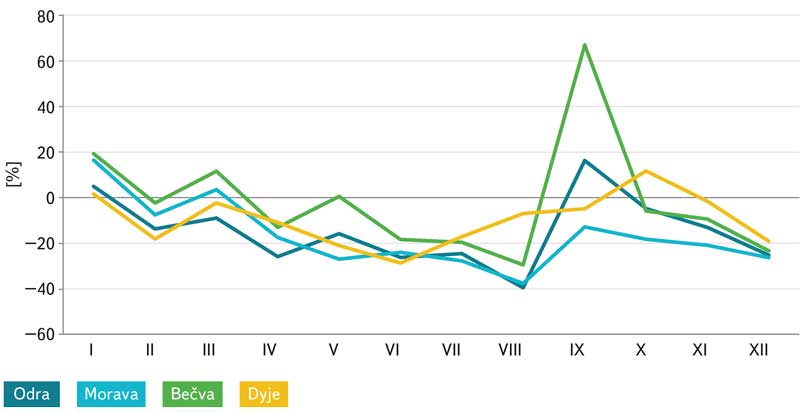
Fig. 13. Relative deviations of monthly average flows in the period 1981–2019 with respect to the period 1961–1980 – river basins in Moravia
Variability of changes in average precipitation and runoff in sub-basins
In the following stage, we focused on the variability of changes in average precipitation in 41 sub-basins. We limited the evaluation to annual and seasonal averages. The variability of changes in annual and seasonal precipitation averages is shown in Fig. 14.
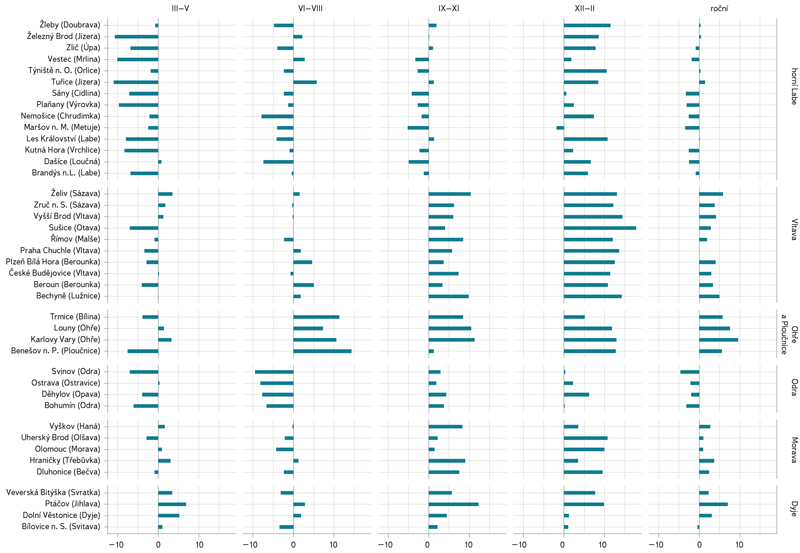
Fig. 14. Deviations of annual and seasonal averages of precipitation in sub-basins in the Czech Republic in the period 1981–2019 with respect to the period 1961–1980
A slight decrease in annual precipitation in the sub-basins that are part of the Elbe above the Vltava confluence is similar at most stations, namely about 2% to 3%. In the mountain basins (Vestřev – Krkonoše, Týniště n. O. – Orlické hory, Železný Brod – Jizerské hory), the changes in precipitation averages are negligible. In the group of river basins in eastern and central Bohemia, which form a continuous strip from Loučná to Výrovka, a decrease in precipitation ranged from 1.9% to 3.1%. Only the result for Doubrava in Žleby deviates from this. A decrease in precipitation in the lower profile of Brandýs n. Labem by 0.88% is thus a superposition of unchanged precipitation in mountain areas and decreases in sub-basins at a lower altitude.
In the sub-basins of the Vltava, the average annual precipitation in most stations increases by about 3% to 4%, with the exception of the Malše river basin in Pořešín. On the Ohře, the increase in precipitation decreases from the highest value in Karlovy Vary by almost 10% downstream. According to data for Bílina in Trmice and Ploučnice, this is a decrease towards the north. Decreases in annual precipitation averages of about 2% to 4% in the Odra River Basin are similar in all sub-basins. In the Morava and Dyje river basins, an increase of about 2% to 3% is usually recorded; in particular the data for the Jihlava river basin up to the Ptačov station deviates from this (by about 7%).
In the winter period from December to February, precipitation increased (with one exception) on all river basins. In Bohemia, the increase is greater in the Vltava, Berounka, Ohře, and Ploučnice river basins, generally falling within the range of 10% to 15%. In the period from March to May, precipitation clearly decreased in most tributaries of the Elbe above the Vltava confluence and also in the Odra and Dyje river basins. Changes in precipitation between June and August are mostly, except for the increase in the Ohře and Ploučnice river basins, in the range of −5% to +2%; only in the Odra, Loučná, and Chrudimka river basins are there noticeable decreases in the range of −10%. The distribution of precipitation changes between September and November shows a significant difference between small decreases in the Elbe above the Vltava confluence and increases in the sub-basins of the Vltava, Berounka, and Ohře river basins, ranging from 3% to 10%. The increases in the Odra and Upper Morava river basins are smaller, only up to 5%.
In summary, it can be stated that only in the winter period in the Vltava river basin did precipitation increase slightly above 10%, while in the spring period there was a steady decrease in precipitation in the Elbe river basin. The changes in the summer period are generally small; precipitation has been steadily increasing in the Ohře river basin and slightly decreasing in the Odra river basin. In autumn, precipitation decreased slightly in the Elbe river basin, and increased in the Vltava river basin and in the Ohře river basin. The results show that the relative deviations of the seasonal precipitation averages are usually significantly larger than the deviations of the annual averages. Differences in changes in annual averages are the result of decreases in spring and autumn precipitation in the Elbe and Odra river basins and an increase in autumn precipitation in the Vltava river basin.
The variability of changes in annual and seasonal runoff averages is shown in Fig. 15.
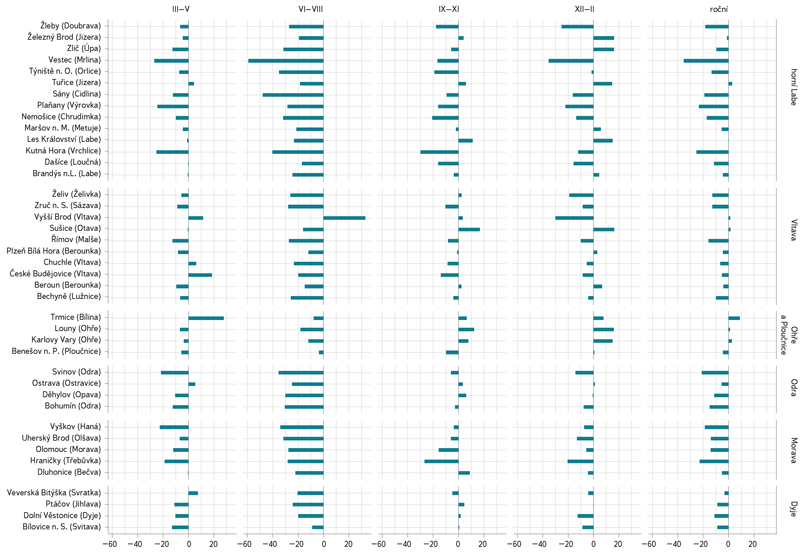
Fig. 15. Relative deviations of average annual and seasonal flows in the period 1981–2019 with respect to the period 1961–1980
The mountain basins of the Upper Elbe and Jizera are characterized by very small changes in annual averages. Decreases in tributaries of the Elbe are changing from about 5% to 10% in the upper stream up to the level of 25% for tributaries of the Middle Elbe; the maximum decrease of about 35% is evaluated in the Mrlina river basin. In the Vltava river basin, the changes in flows are very small at the stations in the Šumava region. When comparing the results for Sázava, Lužnice, Berounka, and Ohře, we find that, from east to west, the decreases change from values slightly exceeding 10% up to a practically unchanged flow of the Ohře. We do not use the increase in the Bílina river basin in this regard due to the uncertainty of elimination of the influence of flows. Stations from the Odra, Morava, and Dyje river basins also show only a very small decrease in flows in mountain river basins (Ostravice, Bečva). Larger river basins, even if they are part of a mountain area, are characterized by clear decreases in the range of about 10% to 15%, with the exception of the Odra in Svinov.
In the period from December to February, in mountain river basins and in the Ohře river basin, the averages increase up to the level of about 15%. In contrast, in the area of tributaries of the Middle Elbe, flows decrease on average by about 15%; in the Odra, Morava, and Dyje river basins this was mostly by 10%. In the spring period from March to May, flows decreased in most stations, slightly in mountain basins, usually in the range of up to 10%; however, in the area of tributaries of the Middle Elbe is was by more than 20%. Summer flows between June and August decreased in all river basins, in the Elbe river basin by more than 30% (the most by 59% in Vestec on Mrlina), in the Odra and Morava river basins usually by about 30%, in the Vltava river basin mostly by about 26%. The results from September to November are more volatile than in other seasons. Areas with constant decreases of more than 15% are tributaries of the Middle Elbe; in other stations, decreases of up to 10% were found. There is also an increase in flows; however, they reach more than 10% only occasionally.
COMPARISON OF CHANGES IN PRECIPITATION AND RUNOFF
Fig. 16 shows deviations of the average annual precipitation and deviations of the average annual runoff in the scale of precipitation and runoff levels in the river basin in mm; it is clear that the runoff decreases show a free dependence on the change in precipitation. The regression relationship between the change in precipitation (dP) and the change in runoff (dR) is shown in Fig. 17. The zero change in precipitation during warming in individual river basins, which ranges from 0.68 to 0.94 °C, corresponds to a decrease in runoff of about 30 mm/year, according to the regression relationship.
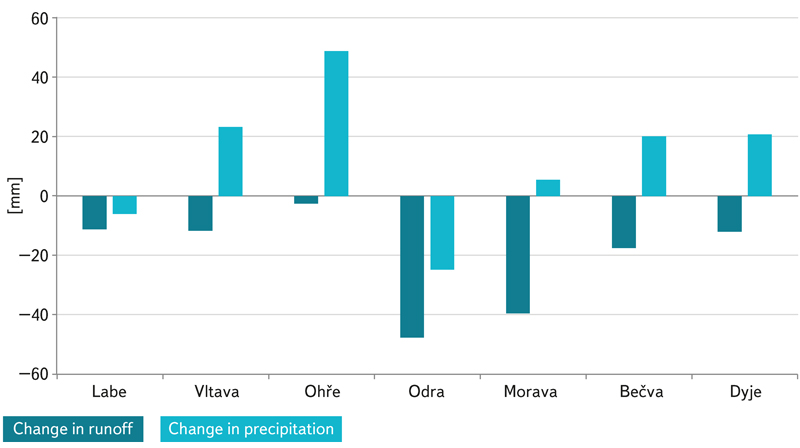
Fig. 16. Deviations of average annual precipitation and average annual runoff heights in the period 1981–2019 with respect to the period 1961–1980
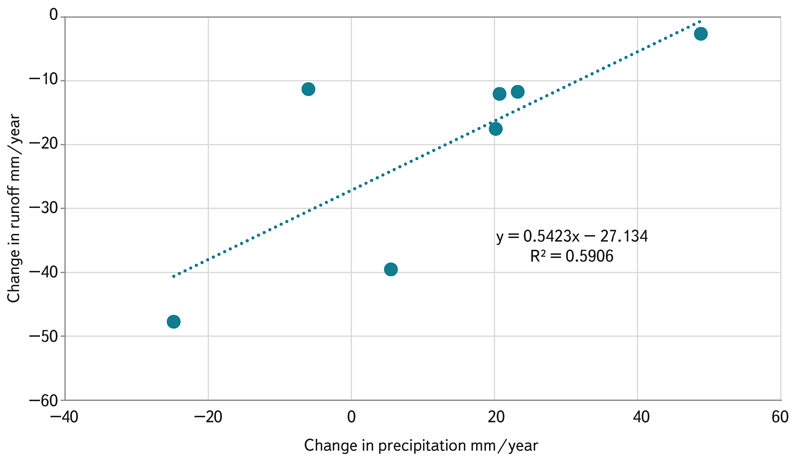
Fig. 17. Correlation relation of the deviations of runoff depending on the deviations of precipitation for the river basin from Fig. 16
The relationship between increase in air temperature and change in runoff in individual river basins is very loose; it is characterized by a coefficient of determination of 0.16.
For a general estimate of the decrease in runoff due to the increase in air temperature in the period 1981–2019, we used a calculation based on the assumption that in each of the monitored river basins, the average long-term territorial evaporation is proportional to the long-term average precipitation. Based on the evaporation/precipitation ratio determined from the period 1961–1980, we calculated the evaporation estimate for precipitation from the period 1981–2019. When we subtract from it the value of evaporation in the area, which is given as the difference between the observed precipitation and the observed runoff, we obtain an approximate estimate of the part of the runoff decrease that can be attributed to the effect of warming. The results of this calculation in Fig. 18 show that the effect of warming varies in the monitored river basins in a fairly wide range. The average value of runoff decreases due to warming is 27 mm.
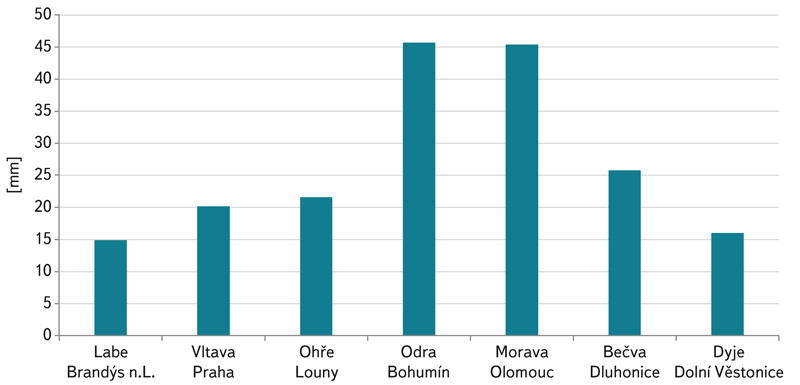
Fig. 18. Estimation of the contribution of warming in the decrease of the average annual runoff in the period 1981–2019 compared to the period 1961–1980
CONCLUSION
Based on a comparison of the course of forty-year average precipitation in the Elbe river basin in Děčín and runoff levels from this river basin for the period 1951–2019, it can be stated that after 1980 there were no changes deviating from fluctuations in the previous period. This applies to averages from whole years as well as to averages from four seasons. A similar finding applies to fluctuations in the forty-year moving averages of annual and seasonal runoff levels from the said river basin, with the exception of the increase in winter runoff.
A comparison of possible changes in precipitation and runoff during the warming period in seven larger river basins of Bohemia and Moravia showed that in the period 1981–2019, compared to the previous period 1961–1980, average annual precipitation in four river basins increased by 2% to 4%, in Ohře river basin by 7.5%. On the other hand, in the Elbe above Vltava confluence and in the Odra river basin, the average annual precipitation decreased by about 1% and 3%, respectively. The increase in annual precipitation was mainly due to increases in precipitation in the winter and autumn months, as there were significant decreases in spring in three river basins and summer precipitation in two river basins. The average flows in the period 1981–2019 were lower in all compared stations than in the period 1961–1980; they decreased on a relative scale, with the exception of the Bečva and Ohře river basins, by 5% to 17%. Changes in runoff levels are regionally different and reach values that affect the flow regime. The annual flows of the Bohemian river basins decreased from April to August or September. In the Moravian river basins, the decrease also begins in April, deepening until August; however, in the autumn months the courses different a lot.
It is worth repeating that these figures are characteristic of the averages over 40 years, when the temperature was increasing with slight fluctuations, not of the conditions at the end of this period.
The summary processing of data from 41 sub-basins showed that the nature of the changes determined on the basis of data from seven large river basins is similar for most of the sub-basins that are a part of them. Exceptions are relative changes in flows in river basins located in mountainous areas, which are very small.
The estimate of the share of warming in the decrease of the average runoff level, determined on the basis of the above-mentioned indicative results, ranges from 15 mm to 45 mm, i.e., on average 30 mm per year. However, these are only indicative results. For more reliable estimates, it will be necessary to use more complex methods describing the relationships between balance sheet quantities.
The paper has been peer-reviewed.
