ABSTRACT
The article presents the results of the Czech Hydrometeorological Institute (CHMI) obtained when addressing the sub-objectives “Scenarios of future water needs for different climate scenarios and individual sectors of water use” (DC 1.1) and “Identification of areas with deficient water resources” (DC 1.2), which are part of TA CR project No. SS02030027 “Water systems and water management in the Czech Republic in conditions of climate change (Water Centre)” and constitute specific tasks within the work package WP1 focusing on the future of water. The aim of the CHMI was to calculate and analyse how river flows upstream of gauging stations in Czechia are influenced by water use and to determine how this influence may change in relation to climate change. Mainly, the monthly data of the total discharge influence at gauging stations for the reference period 1991–2020 were analysed. The emphasis was placed on identifying trends in the total influence within individual river basins and localising areas at potential risk of declining water availability and increasing societal demands. For instance, trend slopes were compared across different time periods. Furthermore, an attempt was made to identify areas with deficient water resources based on the SSP2-4.5 and SSP5-8.5 climate scenarios using regional climate models developed at the CHMI. The analysis of the impacts of water withdrawals and climate change on water resources in Czechia revealed significant regional variability. In some regions, such as southern Moravia, northwestern Bohemia, and the Bílina River basin, significant changes in surface and groundwater withdrawals were observed, potentially affecting water availability. Climate scenarios indicate rising air temperatures, with the more pessimistic SSP5-8.5 scenario predicting an increase of up to 5 °C by the end of the century. Regarding precipitation, the SSP2-4.5 scenario suggests a slight increase, while SSP5-8.5 predicts more pronounced changes with higher precipitation totals in the western and southern parts of Czechia. The calculation of the Standardized Precipitation Index (SPI) confirms the occurrence of extreme dry and wet periods, with differences between river basins highlighting the need to tailor water management measures to regional conditions. Adaptation to changes in the hydrological regime, improvement of water resource protection policies, and prevention of the impacts of extreme climatic events must become priorities.
INTRODUCTION
Water is essential for the existence of all living organisms and determines the functioning of human society. As a result of climate change, extreme weather fluctuations are increasingly occurring, leading to a lack of precipitation and the occurrence of droughts or, conversely, to extreme precipitation and floods. One of the causes of these changes is human society and its ever-increasing demand for water and other strategic raw materials [1].
The flow rate of most watercourses in Czechia is influenced by anthropogenic activity, and since the 1950s there has been an extreme increase in pressure on water resources worldwide [2]. The values measured at water-gauging stations more or less reflect human activities, which include the withdrawal of surface water and groundwater for agricultural purposes, especially irrigation, and for supplying the population and industry. On the other hand, there is the wastewater disposal into surface waters (and rarely into groundwater), as well as the deliberate increase or decrease in the flow rate of a watercourse by operating reservoirs [3].
Water is often abstracted from one catchment and disposed into another several kilometres away. For example, in the Svitava catchment, groundwater is abstracted to supply the Brno agglomeration with drinking water and, after use, is led to the Brno-Modřice wastewater treatment plant, which flows into the Svratka [4]. This means that the measured values in both catchments are strongly influenced by anthropogenic activity, and therefore natural discharge cannot be measured directly, but must be calculated [2].
Since a watercourse is the main variable that connects ecosystem components through hydrological, biological, geomorphological, and water quality processes, the estimate of natural discharge (in our case, the so-called unaffected discharge; further generally referred to as QNE) is usually used as a reference quantity for estimating hydrological response to the climate regime, for assessing the ecological status of a river, and for estimating the amount of potentially available water [5].
This paper focuses on the analysis of the impact of water withdrawal, disposal, and accumulation on flow rates at water-gauging stations in Czechia for the reference period 1991–2020. It also includes an assessment of regional differences in the hydrological regime of Czech river catchments and the identification of areas where significant changes in water availability occur. It also assesses areas with potential water resource deficits, based on the SSP2-4.5 and SSP5-8.5 climate scenarios. The results of this analysis will contribute to effective water resource management and a deeper understanding of changes in the water regime.
METHODOLOGY AND DATA USED
Analysis of the influence of water use on discharge (DC 1.1)
In addition to the activities of other consortium members already presented in [6], the main task of the CHMI in DC 1.1 was to analyse the impact of water use on discharge in Czechia. The basis was monthly data on total influence on discharge at water-gauging stations, expressed in percentage as the ratio of discharge changes to QNE. In practice, this variable (and its time series) was designated by the abbreviation OVLTOT. Formally, its calculation can be expressed as

where:
DELTA represents
the total impact of operated reservoirs in the catchment above the given station (or the difference between volumes at the beginnings of the months)
SUMA is
the sum of impacts by withdrawals and disposals
Each variable related to the influence was first converted to m3 · s–1 and given an adequate sign. Negative values of OVLTOT then indicated a predominance of withdrawals (including water accumulation in reservoirs), while positive values were associated with a predominant disposal (including water discharge from reservoirs). These data are regularly uploaded once a year to a CHMI database together with other available data on impacts valid for water-gauging stations (in accordance with Act No. 254/2001 Coll., on waters, as amended; with Decree of the Ministry of Agriculture No. 431/2001 Coll., on the content of the water balance, its method of compilation and on data for the water balance, and to a certain extent also with Decree of the Ministry of Agriculture No. 252/2013 Coll., on the scope of data in records of the state of surface and groundwater and on the method of processing, storing, and transmitting this data to public administration information systems). When calculating QNE, special attention is paid to the distinction between withdrawals only from surface waters (which is reflected in the SUMAY characteristic, which results in unaffected discharge values in the database abbreviated as QNEY) and total withdrawals (i.e. withdrawals from surface water including groundwater; which is reflected in the SUMAX characteristic, which results in unaffected discharge values in the database abbreviated as QNEY). To maintain homogeneity of the time series, only territorially relevant objects with a permit for the withdrawal or disposal of more than 6,000 m3 per year or 500 m3 per month are included in the calculation of the SUMA characteristic. The DELTA characteristic only considers reservoirs with a permitted volume of surface water accumulated or dammed greater than 1,000,000 m3. The reference period 1991–2020 was selected for the current analyses, with a total of 346 gauging stations meeting the criterion for the completeness of the time series.
Simultaneously, an R script for the actual calculation of QNE series was developed at the CHMI. The script functionality depends on using coordinates for the correct location of the influencing object, and therefore it was necessary to check the coordinates of the input data of the influence. Special attention was paid to appropriate location of the beginnings and ends of the conduits in the system of watershed divides so that the point of withdrawal (or disposal) logically falls into the catchment area with the loss (or gain) of water. At the end of work on WP1 (June 2024), the most detailed vector layer published as of 1 July 2024 on the CHMI website with open spatial data [7, 8] was already considered for localising the objects. This layer was constructed on top of the fifth generation Digital Terrain Model of the Czech Republic (DMR 5G; [9]). The resulting QNE values were compared with the values obtained at the TGM WRI, which has been performing their annual calculation and submitted them to the CHMI.
For the purposes of developing the R script and calculating the M-day discharge cadastre for the reference period 1991–2020, input data on discharge influences were compared between three main sources, which were the Integrated System for Fulfilling Reporting Obligations (ISPOP system), files (exports) from the River Basin Authorities, state enterprises, and geographic layers from the VODA Water Management Information Portal available at https://voda.gov.cz/. It was found that the sources differ in the number of objects and the values themselves; however, updating (also in terms of error corrections) of these sources is somewhat decentralised, which can be seen as a great uncertainty. Therefore, a general check of the location of objects, their duplicates, and the values of withdrawals and disposals was performed [10].
Data from the VODA Water Management Information Portal was considered more as supplementary because, at the time of processing (i.e. at the end of work on WP1), it only reached the year 2020, compared to the status on the portal from August 2024 with data reaching back to 2014. Based on gaps in the time series, or changes in the object name and other attributes, objects were selected that could potentially be combined or divided. An analysis of water bodies was also carried out, where both water body and watercourse withdrawals can be reported at the same time. Therefore, objects situated in close proximity to reservoirs were located. All this information about selected objects was subsequently sent to the CHMI regional offices for manual checks via the PostgreSQL database with support for GIS tools (i.e. PostGIS).
For map outputs of the total influence, a third-order catchment layer was selected, including 346 selected water-gauging stations with a complete time series of the total percentage of influence for the hydrological period 1991–2020. The time series of other studied elements were also complete. For each station, the total area of the catchment above it and its share of the area of the third-order catchment in which the station is located were first calculated. The total percentage of influence for each catchment was calculated as the sum of total influence at all stations in the given catchment, with the weight of each station being the calculated share of the catchment area above the given station. The total percentage of influence in individual catchments therefore corresponds primarily to the stations at the mouth or near the mouth, where the largest area is drained.
In the next phase, a trend analysis was performed to determine whether there were statistically significant gradual changes in the time series of elements affecting the discharge of Czech rivers in the selected period. Two statistical significance levels were chosen, namely α = 0.05 and α = 0.01. The Mann–Kendall test for the presence of a trend [11–13] and its modification proposed in the article [14] were applied so that, in the case of a significant autoregressive coefficient with the assumed first-order autoregressive model, variance of the test statistic was corrected [15–17]. Results for each station and month were summarised in the value of the standardised test statistic Z (indicating the direction of a possible trend), the p-value, and Sen’s nonparametric estimate of the trend direction, denoted SEN [18]. These analyses were performed for both monthly and annual time series.
The results were processed using the R package modifiedmk [19]. Cases where the p-value fell below the chosen significance level were plotted on maps using arrows at the locations of water-gauging stations. The arrow deviating from the horizontal direction, depending on the sign of the Z or SEN values, represented an increasing trend (number of values without a sign) or decreasing trend (number with a minus sign), similar to what was done in other papers dealing with trends in the components of the hydrological cycle in Czechia [20–22]. Map outputs were subsequently created from these analyses.
Identification of areas with deficient water resources (DC 1.2)
Unlike precipitation, air temperature is, as expected, more evenly distributed between individual river catchments, which allows for analysis of its changes for entire Czechia. Compared to the normal from 1991–2020, changes in the average monthly temperature oscillate between 0 °C and +2 °C for both scenarios until approximately 2055 (Fig. 3). From this year, a more significant increase in the change in air temperatures can be observed for both scenarios, especially for the more pessimistic scenario SSP5-8.5. This is also confirmed by the calculated average temperatures for individual decades of the 21st century. While the change in average monthly air temperature compared to the normal in the first four decades (between 2020–2060) on a nationwide scale is around +1 °C, between 2060 and 2070 it exceeds +2 °C in the SSP5-8.5 scenario and continuously increases to an extreme +5 °C towards the end of the century. In contrast, according to the SSP2-4.5 scenario, a more moderate increase in air temperature can be expected, with a maximum change of +2.4 °C between 2080 and 2090.
For precipitation, predictions are more variable, with the course of events according to different scenarios differing significantly (Fig. 4). From a nationwide perspective, according to the SSP2-4.5 scenario, monthly precipitation totals have been around the average of the reference period 1991–2020 (59.9 mm/month) in the long term. From approximately 2040, there is a positive change in precipitation totals, which lasts almost until the end of the century.
In contrast, the SSP5-8.5 scenario suggests more significant changes, similar to the development of air temperatures. Around 2055, there is a positive change in monthly precipitation compared to the 1991–2020 normal. According to this scenario, average monthly totals will increase by up to 15 %, with this growth trend continuing constantly until the end of the century.
Although the outlook for the nationwide average monthly precipitation totals may seem relatively optimistic, averages for individual decades show significant differences between third-order river catchments. From the map outputs for both analysed scenarios (Figs. 5 and 6), a recurring pattern can be seen at first glance across individual decades. This is the transition of higher precipitation totals in the west of Czechia through a precipitation-poorer area that stretches from north to south, back to the precipitation-richer east of the country. This transition is especially evident in the SSP2-4.5 scenario. While in the west of the country, a positive change in monthly precipitation compared to the normal prevails across all decades, in the northern, central, and southern parts of Czechia this change is slightly negative. The exception is the decade 2020–2030, characterised by a negative change in almost all catchments (national average -7.4 %) and, conversely, the precipitation-rich decade 2070–2080 (average +8.4 %). The scenario SSP5-8.5 predicts an increasing negative change in average monthly precipitation for the north-south belt of Czechia in the first three decades compared to the 1991–2020 normal, while in the east and west there is a transition from slightly positive to zero values. However, for the rest of the century, the prediction ranges exclusively in positive changes in total precipitation across all river catchments. The nationwide average will not fall below +10 % from 2050, with maxima in the decades 2070–2080 (+16.3 %) and 2090–2100 (+17.4 %).
To clarify the map outputs of both air temperatures and precipitation, it should be added that values in some border catchments can sometimes differ significantly from values in neighbouring catchment. This difference is caused by cropping a raster of a certain size by a smaller area of the catchment, which can result in the extraction of only one value/pixel (i.e. the value of the average monthly precipitation/air temperature) for the part of the studied catchment. This is therefore not a calculation error, but the result of the necessary raster extraction.
The last analysis performed was the SPI index calculation, which is used to estimate wet/dry conditions based on total precipitation. Specifically, it is the standard deviation by which observed precipitation would differ from the long-term average and, before calculation, the precipitation time series must first be transformed into a quantity with a standard Gaussian distribution (through its quantile function) using the cumulative distribution function of the probabilistic model which is assumed to be a good description of empirical values [33]. In this case, the index calculated for a twelve-month time window SPI12 (with potential removal of seasonality) with a gamma distribution was chosen.
According to simulated values of total precipitation using the scenario SSP2-4.5, extremely dry periods can be estimated during the 2020s and around 2065, 2082, 2091, and 2094. Exceptionally to extremely dry conditions occur less frequently in the Oder catchment, while the Bílina and Ohře catchments show a more significant episode around 2058. Extremely and exceptionally wet conditions across the catchments were simulated in the late 2040s and especially in the second half of the 2070s, and in the Morava catchment especially in the early 2070s. According to the more pessimistic SSP5-8.5 scenario, dry and wet episodes do not alternate as much. Two more significant periods were simulated. The first period, 2035–2050, includes four significant dry episodes, while the second period, 2075–2095, includes six significant wet episodes. Here, obvious differences can be found between the catchments. For example, the dry episode around 2040 is not evident in the Ostravice, Opava and Morava catchments, while the wet episode in 2055 is not evident in the Oder catchment and in 2086 in the Elbe catchment.
RESULTS AND DISCUSSION
Analysis of the influence of water use on discharge (DC 1.1)
As shown in Fig. 1, the highest values of total surface water influence were achieved in the catchments in southern Moravia and the Osoblaha catchment, the Elbe from the Orlice to the Loučná, and in particular the Bílina catchment (however, in this catchment, data were entered from only one gauging station); in contrast, the lowest values were achieved in the catchments of the Rybná and the Lužnice from the Rybná to the Nežárka, the Sázava from the Želivka to the mouth, and the Dyje from the Svratka to the mouth. When groundwater withdrawals were included, high values were again found in the catchments in southern Moravia and in the catchments of western and northwestern Bohemia. The highest values of the degree of influence can be observed in the catchments of the Loděnice, Osoblaha, and Oslava. In contrast, the lowest values were measured in the tributaries of the Freiberg Mulde, Šopava and Flöha, in the catchments of the Morava from the Bečva to the Haná, the Rybná, and the Lužnice from the Rybná to the Nežárka and the Svitava.
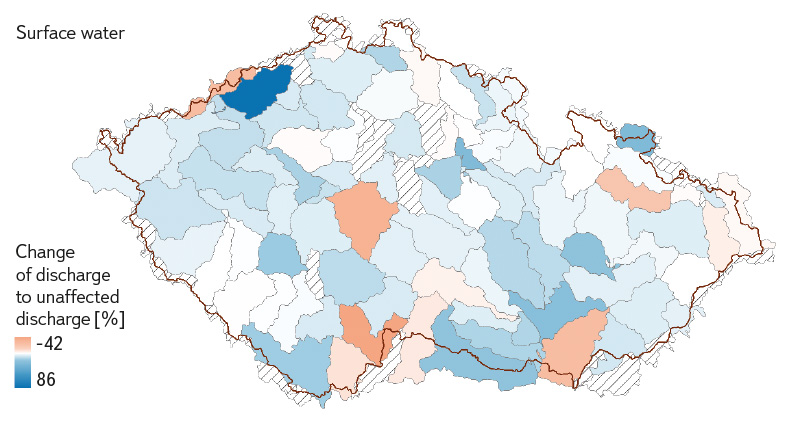
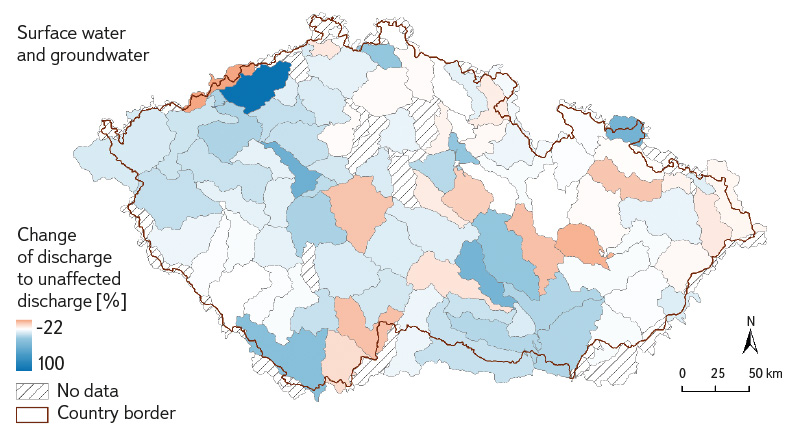
Fig. 1. Ratio of total discharge influence for third-order catchments (reference period 1991–2020)
From the trend analysis for the reference period 1991–2020, different behaviours can be observed in water withdrawals and disposals at selected water-gauging stations, often creating noticeable clusters in several areas (Fig. 2). Overall, however, a zero trend prevails across water withdrawals and disposals. This was found in each of the monitored groups at approximately 230 of the total 346 water-gauging stations (around 65 % of all stations).
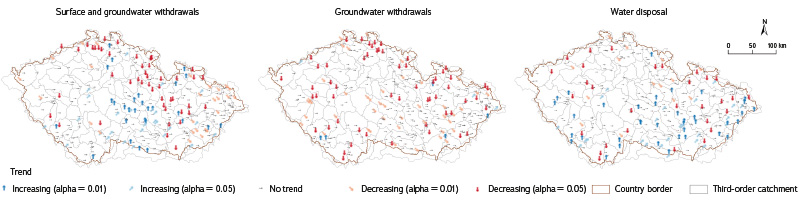
Fig. 2. Trend analysis for water withdrawals and disposals (reference period 1991–2020)
In the case of surface water withdrawals, including groundwater, a slightly decreasing and slightly increasing trend was observed at approximately 8 % of all monitored stations. The same ratio was measured at stations with a significantly increasing trend. A significantly decreasing trend was then detected at 47 stations (almost 14 % of all stations), forming noticeable clusters at stations in northern Bohemia (especially the Ploučnice catchment) and eastern Bohemia (the Metuje catchment, the Orlice from the confluence of the Divoká and Tichá Orlice to the mouth, and the Loučná and Elbe from the Loučná to the Chrudimka). Other catchments with a predominance of significantly decreasing trends are the catchments of the Moravská Sázava and the Morava from the Moravská Sázava to the Třebůvka, of the Třebůvka and Svitava. Clusters of slightly decreasing trends can also be observed in the catchments in Silesia (the Opava to the Moravice, the Olše and the Oder to the Opava). In contrast, the observed increasing trends create clusters in the Vysočina region (especially the Sázava catchment to the Želivka, the Svratka to the Svitava, and the Oslava and the Jihlava from the Oslava to the Rokytná) and in the Dyje catchment.
In the case of withdrawals considering surface water only, a minimum of stations with an increasing trend were found. Decreasing trends were recorded at less than 30 % of the monitored stations, which are relatively evenly distributed throughout Czechia. The predominance of significantly decreasing trends can again be observed in the area of northern Bohemia, especially in the catchments of the Lužická Nisa to the Mandava, the Jizera, and the Kamenice. Other areas with decreasing trends are the catchments of the Berounka and its tributaries, the upper and middle reaches of the Morava, and the catchments of southern Bohemia (the Vltava to the Malše and the Nežárka).
A slight predominance of increasing trends (a total of 62 stations) was found in water disposals compared to decreasing trends (34 stations). Areas with a predominance of increasing trends are the catchments of western Bohemia (the Mže to the confluence with the Radbuza and the Otava to the Volyňka), southern Moravia (the Svratka and Svitava) and eastern Moravia (the Vsetínská and Rožnovská Bečva or the Ostravice). Decreasing trends are more point-wise distributed; smaller clusters occur in the catchments of the Vltava to the Malše, the Rakovník Stream and the Metuje.
Identification of areas with deficient water resources (DC 1.2)
Unlike precipitation, air temperature is, as expected, more evenly distributed between individual river catchments, which allows for analysis of its changes for entire Czechia. Compared to the normal from 1991–2020, changes in the average monthly temperature oscillate between 0 °C and +2 °C for both scenarios until approximately 2055 (Fig. 3). From this year, a more significant increase in the change in air temperatures can be observed for both scenarios, especially for the more pessimistic scenario SSP5-8.5. This is also confirmed by the calculated average temperatures for individual decades of the 21st century. While the change in average monthly air temperature compared to the normal in the first four decades (between 2020–2060) on a nationwide scale is around +1 °C, between 2060 and 2070 it exceeds +2 °C in the SSP5-8.5 scenario and continuously increases to an extreme +5 °C towards the end of the century. In contrast, according to the SSP2-4.5 scenario, a more moderate increase in air temperature can be expected, with a maximum change of +2.4 °C between 2080 and 2090.
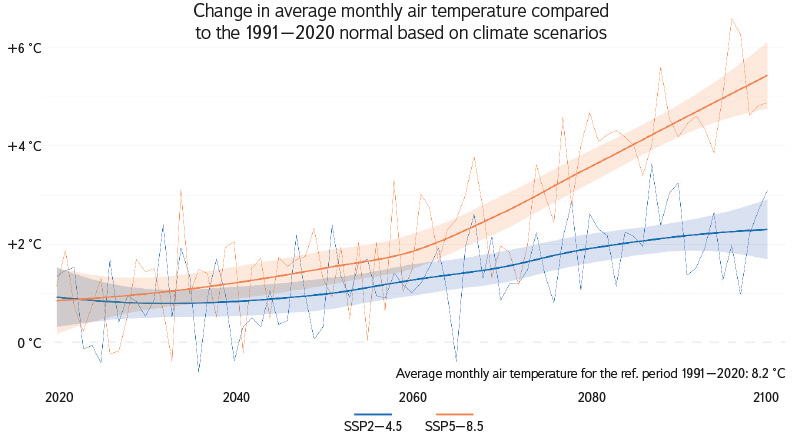
Fig. 3. Change in average monthly air temperature compared to the 1991–2020 normal based on climate scenarios; LOESS regression [36] with a 95% confidence interval shown in bold
For precipitation, predictions are more variable, with the course of events according to different scenarios differing significantly (Fig. 4). From a nationwide perspective, according to the SSP2-4.5 scenario, monthly precipitation totals have been around the average of the reference period 1991–2020 (59.9 mm/month) in the long term. From approximately 2040, there is a positive change in precipitation totals, which lasts almost until the end of the century.
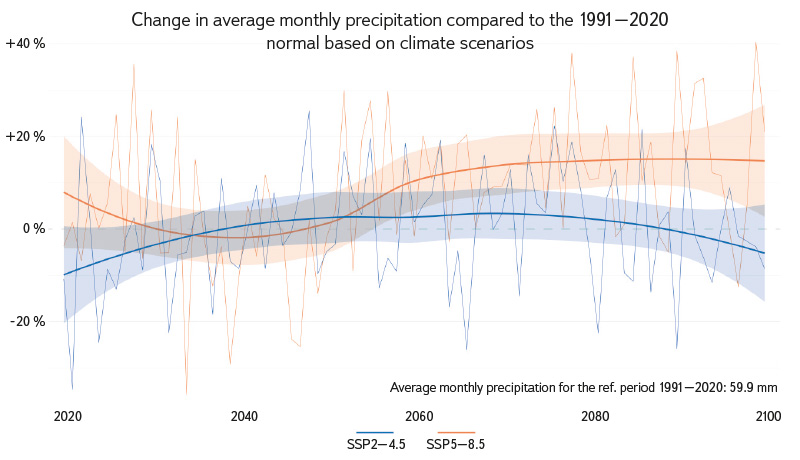
Fig. 4. Change in average monthly precipitation totals compared to the 1991–2020 normal based on climate scenarios; LOESS regression [36] with a 95% confidence interval shown in bold
In contrast, the SSP5-8.5 scenario suggests more significant changes, similar to the development of air temperatures. Around 2055, there is a positive change in monthly precipitation compared to the 1991–2020 normal. According to this scenario, average monthly totals will increase by up to 15 %, with this growth trend continuing constantly until the end of the century.
Although the outlook for the nationwide average monthly precipitation totals may seem relatively optimistic, averages for individual decades show significant differences between third-order river catchments. From the map outputs for both analysed scenarios (Figs. 5 and 6), a recurring pattern can be seen at first glance across individual decades. This is the transition of higher precipitation totals in the west of Czechia through a precipitation-poorer area that stretches from north to south, back to the precipitation-richer east of the country. This transition is especially evident in the SSP2-4.5 scenario. While in the west of the country, a positive change in monthly precipitation compared to the normal prevails across all decades, in the northern, central, and southern parts of Czechia this change is slightly negative. The exception is the decade 2020–2030, characterised by a negative change in almost all catchments (national average -7.4 %) and, conversely, the precipitation-rich decade 2070–2080 (average +8.4 %). The scenario SSP5-8.5 predicts an increasing negative change in average monthly precipitation for the north-south belt of Czechia in the first three decades compared to the 1991–2020 normal, while in the east and west there is a transition from slightly positive to zero values. However, for the rest of the century, the prediction ranges exclusively in positive changes in total precipitation across all river catchments. The nationwide average will not fall below +10 % from 2050, with maxima in the decades 2070–2080 (+16.3 %) and 2090–2100 (+17.4 %).
 Fig. 5. Change in average monthly precipitation totals compared to the 1991–2020 normal according to the SSP2-4.5 scenario in individual decades for third-order catchments
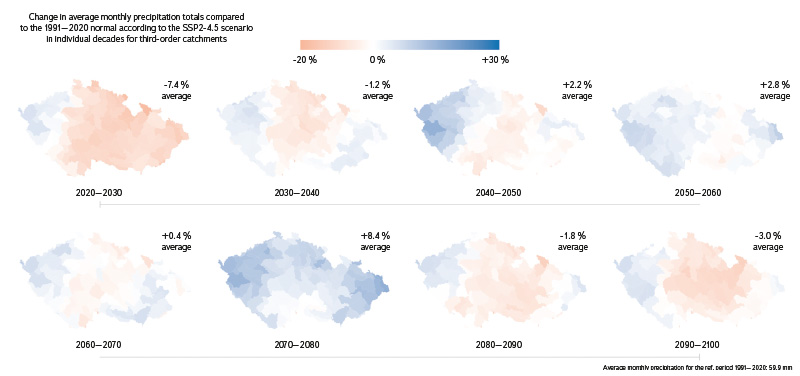
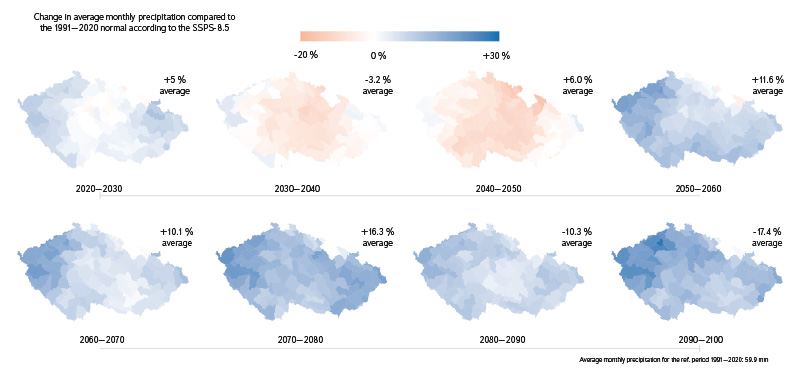
Fig. 6. Change in average monthly precipitation totals compared to the 1991–2020 normal according to the SSP5-8.5 scenario in individual decades for third-order catchments
To clarify the map outputs of both air temperatures and precipitation, it should be added that values in some border catchments can sometimes differ significantly from values in neighbouring catchment. This difference is caused by cropping a raster of a certain size by a smaller area of the catchment, which can result in the extraction of only one value/pixel (i.e. the value of the average monthly precipitation/air temperature) for the part of the studied catchment. This is therefore not a calculation error, but the result of the necessary raster extraction.
The last analysis performed was the SPI index calculation, which is used to estimate wet/dry conditions based on total precipitation. Specifically, it is the standard deviation by which observed precipitation would differ from the long-term average and, before calculation, the precipitation time series must first be transformed into a quantity with a standard Gaussian distribution (through its quantile function) using the cumulative distribution function of the probabilistic model which is assumed to be a good description of empirical values [33]. In this case, the index calculated for a twelve-month time window SPI12 (with potential removal of seasonality) with a gamma distribution was chosen.
According to simulated values of total precipitation using the scenario SSP2-4.5, extremely dry periods can be estimated during the 2020s and around 2065, 2082, 2091, and 2094. Exceptionally to extremely dry conditions occur less frequently in the Oder catchment, while the Bílina and Ohře catchments show a more significant episode around 2058. Extremely and exceptionally wet conditions across the catchments were simulated in the late 2040s and especially in the second half of the 2070s, and in the Morava catchment especially in the early 2070s. According to the more pessimistic SSP5-8.5 scenario, dry and wet episodes do not alternate as much. Two more significant periods were simulated. The first period, 2035–2050, includes four significant dry episodes, while the second period, 2075–2095, includes six significant wet episodes. Here, obvious differences can be found between the catchments. For example, the dry episode around 2040 is not evident in the Ostravice, Opava and Morava catchments, while the wet episode in 2055 is not evident in the Oder catchment and in 2086 in the Elbe catchment.
CONCLUSIONS AND RECOMMENDATIONS
This paper presented the basic results that the CHMI reached within the work package WP1 of the “Water Centre”. In addition, the shortcomings and uncertainties that accompanied the analyses were briefly outlined. For example, the situation surrounding data related to the influence of discharge in Czech rivers can be understood as very urgent. There are several sources of this data that are not correctly updated, for example, regarding the errors found. Moreover, these data are used in various other projects, which results in the creation of new web (map) applications offering their presentation, which then worsens the orientation of the processors of such data [10]. Given that from 2025 (i.e. initially with data for 2024) the calculation of the unaffected mean monthly discharges will be transferred under the responsibility of the CHMI, it will be necessary to carefully consult the quality of the affected data with the employees of the River Basin Authorities, state enterprises. Otherwise, the developed R script for calculating unaffectedness may be perfect, but it will still not give satisfactory results. For this reason, further maintenance and versioning of the script is planned via the GitHub development platform (e.g. https://github.com/ledvinkao). Its variants are also possible, depending on the data source.
The analysis of the influence on discharge and water resources in Czechia, both in the area of surface and groundwater withdrawals and in relation to climate change predictions, shows the complex and regionally differentiated nature of these changes. The analysis results show significant variability between river catchments, which underlines the need for an individual approach to assessment and management of water resources in different parts of the country. In areas such as southern Moravia, northwestern Bohemia, and the Bílina catchment, significant changes in groundwater and surface water withdrawals are being observed, which may have long-term consequences for water availability in these regions. Conversely, lower impact values were observed in some areas of southern and eastern Bohemia – this may indicate greater water regime stability in these regions.
Climate scenario predictions indicate rising air temperatures throughout the 21st century, with the more pessimistic SSP5-8.5 scenario even suggesting a significant temperature increase of up to 5 °C by the end of the century. Changes in air temperature will have a direct impact on the water balance in Czechia, with regions with higher temperatures facing increased evaporation and changes in the availability of water resources. As for precipitation, the scenario SSP2-4.5 shows a rather moderate increase in precipitation totals with regional differences, while the scenario SSP5 8.5 suggests a significantly higher increase in precipitation, especially in the western and southern parts of Czechia.
SPI index calculation confirms the occurrence of extreme dry and wet periods during the 21st century and there are obvious differences between individual catchments. The scenario SSP2-4.5 predicts periods of extreme drought around 2065 and in the 2090s, while extremely wet periods will occur in the late 2040s and 2070s. In the SSP5-8.5 scenario, these fluctuations are less frequent, but more frequent dry and wet periods are still expected in specific decades, with some areas, e.g. the Oder catchment, facing more frequent wet episodes.
Overall, the results indicate the need to adapt water management to the changes that climate change will bring. It is necessary to focus on regional specificities, as climate change will not affect Czechia evenly. It will be necessary to adapt water resource management with regard to the expected development in river catchments, which show different trends in water withdrawal and disposal. This includes not only improving water management policies and strategies for protecting water resources, but also reassessing infrastructure projects and measures to mitigate the impacts of extreme climate conditions such as drought and floods. Preventive measures aimed at retaining water in the landscape will also play an important role.
With regard to the existence of climatological data in grid form, the number of which will certainly rise, Czechia has taken a step in the right direction. Czech water managers may be assisted by additional information derived from grids, such as antecedent precipitation indices or seasonal hydrological predictions whose development has, in fact, already begun with these grids [37, 38].
Acknowledgements
The article was prepared as part of project No. SS02030027 “Water systems and water management in the Czech Republic in conditions of climate change” implemented with financial support from the Technology Agency of the Czech Republic within Subprogramme 3 – Long-term Environmental and Climate Perspectives of the SS programme – Programme for the Support of Applied Research, Experimental Development and Innovation in the Field of the Environment – Environment for Life. The authors thank both reviewers for their inspiring comments, which significantly contributed to improving the manuscript quality.
The Czech version of this article was peer-reviewed, the English version was translated from the Czech original by Environmental Translation Ltd.
