ABSTRACT
The article describes software aimed at analysing water management infrastructure and identifying critical points for water supply and assessing possible measures aimed at optimising the water supply function of the water management system. The computational procedures integrate the evaluation of hydrological characteristics of an area, parameters of water management and water supply systems, and water supply requirements. The solution uses graph theory and network flow optimization (out-of-kilter algorithm is applied). The program is implemented as a PC application and equipped with a user interface.
INTRODUCTION
In the Czech Republic, like elsewhere in the world, we are increasingly encountering local and regional water shortages. The reason is both the changing demands (of the population, industry, power engineering, agriculture, etc.) for water supply, and in particular changes in the availability of water resources, caused primarily by changes in climatic conditions. Possible future negative impacts of drought can be mitigated or eliminated by a number of preventive measures. The measures under consideration are still mainly oriented towards increasing the capacity of water resources as such; however, much less attention is paid to the possibility of optimizing the use of these resources. These measures also include optimization of the storage function of water management and water supply systems (WS), including their interconnection or modification of their technical parameters.
The risks of the climate change impact on water resources and their use have been the subject of a number of research projects and studies in the last 15 years, in which T. G. Masaryk Water Research Institute (TGM WRI) has also significantly participated. These studies were mainly focused on the assessment of possible future risks in securing water supply requirements and they mainly used hydrological and water management balance modelling methods, including simulation models of the storage function of water management systems. The need to focus also on the assessment of possible mitigating measures at risk locations aimed at streamlining the management of water resources in this context led to the need to supplement these already existing and used tools with another tool aimed at optimizing the WS parameters and water distribution from water resources, especially water reservoirs, to consumption areas. When creating this tool, the significant methodological background was used which was created at TGM WRI (Václav Zeman, Břetislav Lank et al.) at the turn of the 1980s and 1990s, when the Model system for designing water management systems was designed and implemented [1]. Part of these models was also the Network model of water management system [2]. At the beginning of 1990s, this model was experimentally verified in a pilot catchment area. However, the then state of information technology development significantly limited its application. According to the solution principles of this model, the software “Optimization network model of water management and water supply systems” (system designation VSTOOLS.OPTIM) was developed as part of the project “Water management and water supply systems and preventive measures to reduce risks in the supply of drinking water” (project no. VI20192022159), financed by the Ministry of the Interior as part of Security Research of the Czech Republic in 2019–2022. The software is designed to analyze water management infrastructure and determine critical points to ensure water supply and assess possible measures to optimize the storage function. The application thus functionally complements existing tools for solving the climate change impact on water management systems and water supply with an optimization element.
METHODOLOGY
Software implementation of the optimization network model is based on the concept of the so-called „Network model of the water management system“, defined and described in detail in [2]. This concept is based on the system concept (a system as a set of elements that have certain mutual relationships between them), from graph theory (vertices on the graph represent elements of the system and the edges of the graph represent links between the elements), and methods of network flow optimization. In this sense, the water management system is therefore considered as a set of elements that have certain relationships with each other, creating a purposeful whole.
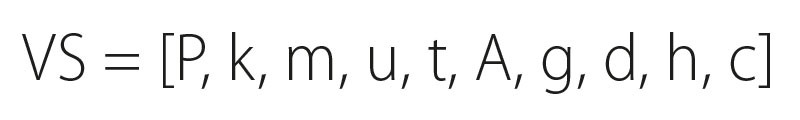
According to [2], the water management system (WS) can be described as follows:
where
P is the set of WS elements
k
function which assigns an integer k(p) to each element p of the set P, which is an identifier of the time period
m
function which assigns an integer m(p) to each element p of the set P, which is an identifier of the water circulation subsystem
u
function which assigns an integer u(p) to each element p of the set P, which is an identifier of the position of WS profiles
t
function which assigns an integer t(p) to each element p of the set P, which is an identifier of the type of the WS element
A the set of activities of WS elements
g
mapping of set A to set P2, where P2 is the set of all ordered pairs of elements belonging to P
d
function which assigns a positive real number d(a)to each activity a of the set A, called the lower bound of the activity capacity
(edges of the graph)
h
function which assigns a positive real number h(a) to each activity a of the set A, called the upper limit of the activity capacity
(edges of the graph)
c
function which assigns a real number c(a) to each activity from the set A, called the cost of the activity (flow along the edge of the graph)
For activities representing input variables of the system function, d(a) = h(a) applies; for activities representing output variables of the system function, d(a) < h(a) applies.
If the input and output activities are determined in such a way that there is more than one output activity solution for a certain choice of input activities, for complete function identification it is possible, for example, to determine the method of selecting the output activity values by specifying a purpose function. Each activity is assigned its „cost“ evaluation c(a).
The method of selecting a solution is that we require that

c(a) is the „cost“ evaluation of activity a
x(a) value of flow through activity a
On the WS model defined in this way, the optimal values of „activities“ or water circulation are assessed. To determine the optimal network flow, the model uses the out-of-kilter algorithm [3].
The water management system model is based on the decomposition of the system in terms of:
- influence of water circulation on environmental subsystems of surface water, groundwater and water use, as well as the types of elements
(e.g. water reservoir), which determine what „activities“ these elements exhibit
(e.g. water accumulation in a reservoir), - space (WS elements and flow relationships between them),
- time (transfer of water supplies from one period to another through the accumulation of water in water reservoirs).
Among WS subsystems and their elements, the structural model recognizes the following activities:
PZAS initial water supply in reservoirs
PPPO natural inflow from inter catchments
AGVY aggregate water discharges (sum of discharges in an inter catchment)
PPPZ abundance of groundwater source
KZAS final water reserves in reservoirs
LOOD water consumption
AGOD aggregated water abstractions
VYPA water vapour
ODTO the run-offs from the last WS profile
OPPZ abundance of the groundwater source unused for the abstraction
PRUT flow in a watercourse between WS profiles
PREV water transfer between WS profiles
VODO water supply (transport route in the water use subsystem)
KUPR water treatment plant capacity
MZAS interim water reserves in reservoirs
CTOK total water flow through network
WS element types determine what activity the element exhibits in the water cycle structure. The types considered are:
NAD water reservoir
POV surface water abstraction
POD groundwater abstraction
VYP discharge to surface water
BPF balance (control) profile on the river network
SPO consumption area
UPR water treatment plant
UZL transport route junction (in the water use subsystem)
The activities of WS elements are illustrated in Fig. 1. Here, ZAC represents the beginning of the system, PVS represents WS elements, and KON the end of the system. The system elements are shown in more detail in Fig. 2. PRF represents the profiles on the river network (water reservoirs, points of water abstraction and discharge, and balance profiles), POD represents points of groundwater abstraction, UPR represents water treatment plant, and SPO represents consumption area. (Surface water subsystem elements and activities are shown in blue, groundwater subsystem in green, and water use subsystem in yellow, system elements are shown in grey.)
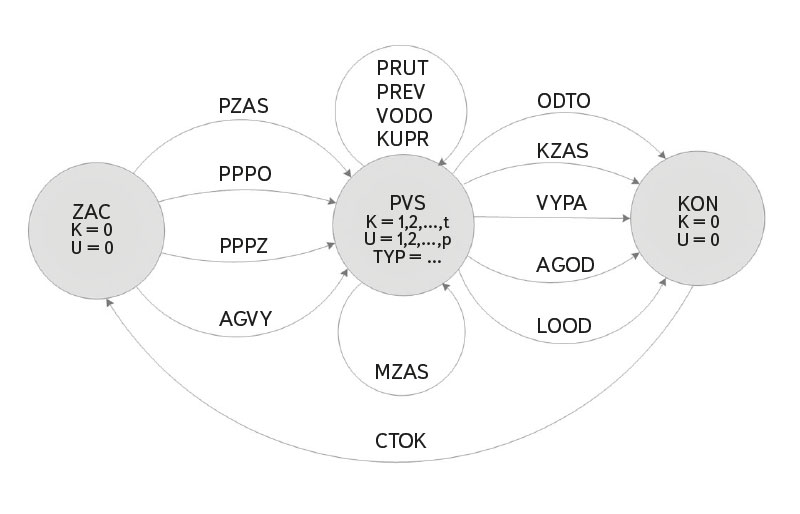
Fig. 1. Water management system model: system element and its activities
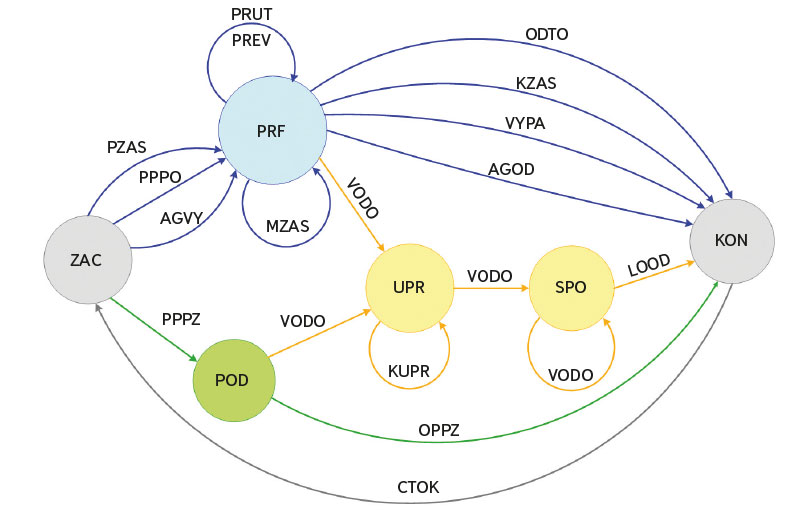
Fig. 2. Water management system model: elements of the surface water, groundwater and water use subsystems
When applying the model, the following modifications can be introduced:
- Aggregation of abstractions and discharges: Since there are a large number of specific elements, especially water abstractions and discharges, and for practical reasons it is not expedient to define them all as WS elements, only decisive objects and profiles are selected that represent the WS in its function. The influence of other elements is aggregated to these objects and profiles.
- Grading of activities: The above-mentioned activities of the system elements can be „graded“ for the required determination of the purpose function, i.e., the activity of the element can be divided into several edges of the graph with different cost assessment. This is typically expedient, for example, for the MZAS activity, which can be divided according to the volumes of reservoirs defined by dispatcher graphs, for the LOOD activity in the event that a possible deficit in water supply is required to be distributed over time, or for the PRUT activity for the need to ensure minimum flows.
- Water treatment plant capacity: Since flow capacity can only be assigned to graph edges (not vertices) in the model, it is necessary to represent the water treatment plant with two vertices and to assign the treatment plant capacity to the edge between these vertices.
The model application requires the following input data (in the range given by the WS in question):
- Description of the watercourse network.
- Identification and location of relevant elements (profiles, objects), including the position of profiles on the watercourse network.
- Identification of water transfers and transport routes (water pipes), determination of the initial and final object/profile.
- Time series of natural flows in WS profiles.
- Requirements to maintain minimum flow rates.
- Requirements for water abstractions.
- Data on water discharge.
- Technical parameters of the objects – volumes of water reservoir storage space, capacity of water transfers and transport routes (water pipelines), capacity of water treatment plants.
- Priorities for meeting requirements for water use – water abstractions, maintenance of minimum flows, maintenance of reservoir water volume.
The model application takes place in the following steps and the relevant algorithms:
- Filling in the model input data (see above).
- Transformation of WS objects and links between them into the form of an oriented graph in the form of the structural model described above.
- Filling the lower and upper limits of the capacities of the graph edges, representing the individual activities described above (see the input and output variables of the system functions above).
- Determination of the objective function through the „valuation“ of the edges of the graph. The valuation is based on the specified priorities for fulfilling individual requirements for water use.
- Calculation of the optimal network flow using the out-of-kilter algorithm.
SOFTWARE
The optimization network model software (VSTOOLS.OPTIM) is designed as an application to run on a user‘s local computer. The condition for running the application is the latest version of Microsoft Windows operating system with the current version of Microsoft NET Framework platform installed. Hardware requirements are determined only by the requirements of the operating system and the Microsoft NET Framework platform; however, the quality of the hardware equipment determines (in direct dependence on the scope of the processed data) the speed of the calculations performed by the application. The software was implemented using the Microsoft Visual Studio development environment in the Visual Basic programming language. From the point of view of the development and implementation of software applications, it is a proven complex tool used as standard for the development of both simple and very complex applications.
The application structure is made up of individual cooperating program modules, which together form a so-called „assembly“. From the functional point of view, it mainly concerns the application administration environment, calculation modules, editor and data viewer, and configuration files of the application and user settings. Part of the application is a purpose-built geodatabase organized on the principle of relational databases. Data sets (input data for calculations and calculation results) are stored in the format of structured text files (txt, semicolon separator, header in the first line of the file). Reference datasets (especially vector map layers) are stored in Esri shapefile (shp) and mif/mid MapInfo formats, and the underlying reference raster data in hrr format. The use of the mentioned data formats was chosen with the aim of maximally simplifying the handling of data even outside the means of the implemented software, so that the users can also access the data from the applications (tools) they normally use.
The application enables the calculations and data evaluation mentioned below in a graphical user interface (GUI). In addition to the calculation functions themselves, the application also offers tools for organization the calculation, the administration of input data, and the display and presentation of the calculation and evaluation results, especially in the form of tables, maps, and graphs. Examples of the user interface are shown in Figs. 3 and 4.
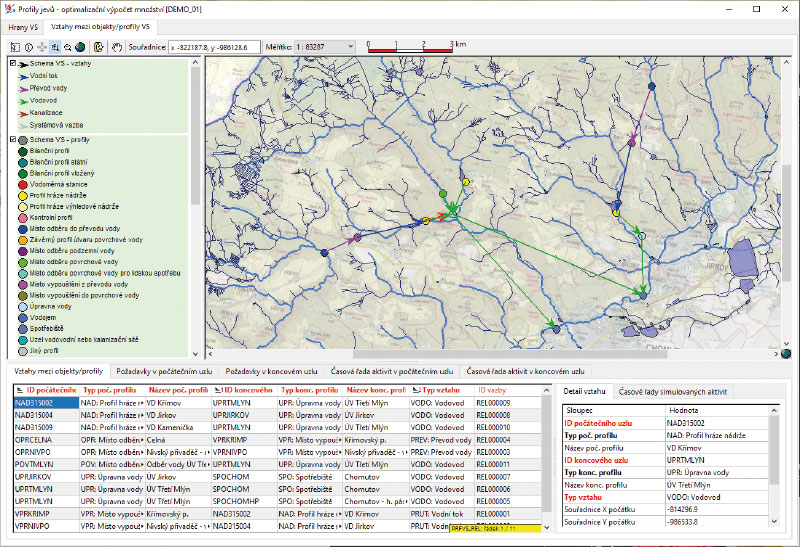
Fig. 3. User interface: model input data
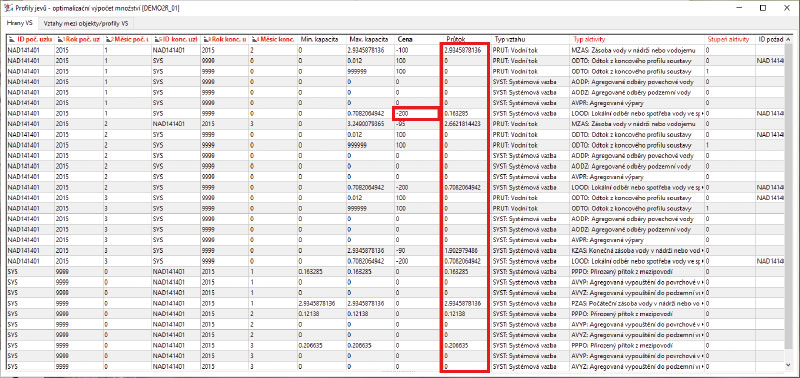
Fig. 4. User interface: model output data
The application was created as part of the „VSTOOLS“ group of tools. It is a gradually developed, updated and expanded modular system of tools for performing various types of analyses, calculations and modelling of water management phenomena. The optimization model software is designed in such a way that, through a suitable data interface, it enables communication with the database and other programs used in TGM WRI when solving the storage function of water management systems and water management balances. These are mainly the Simulation model of the storage function of water management systems [4] and the BILAN hydrological balance model [5]. Using this model, time series of flows are modelled using the chronological hydrological balance method, which enter both the simulation and optimization network model of the WS storage function. Relationships between the database and the models are illustrated in a simplified way in Fig. 5. The relevant records of ISVS-VODA (Information System for Public Administration in Water Management) [6] can be used as a database, especially the records of water abstractions, discharges and accumulations maintained according to [7] for the purposes of drawing up water balances. To describe the river network structure, it is expedient to use the Structural model of watercourses (i.e., a description of the river network broken down into watercourse sections) maintained as part of the Digital Water Management Database (Digitální báze vodohospodářských dat, DIBAVOD) [8]. The Hydroecological Information System (Hydroekologický informační systém, HEIS VÚV) database [9] is used in TGM WRI as a tool for the integration of input data (i.e., filling in links between individual records).
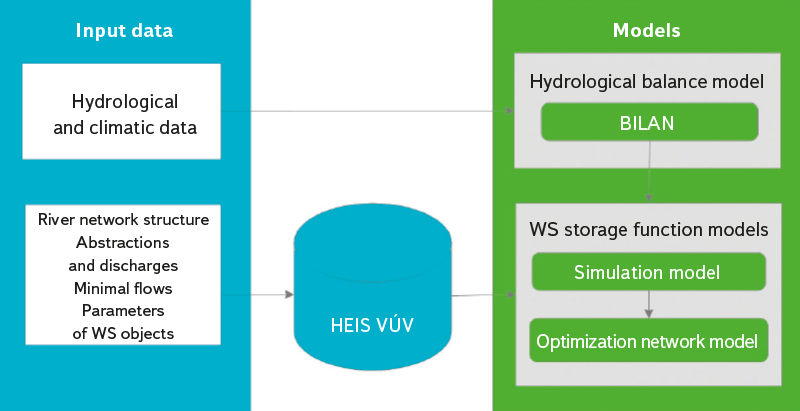
Fig. 5. Tools for dealing with the issue of the storage function of water management systems
CONCLUSION
The WS optimization network model described above is sufficiently universal and can be applied when assessing the storage function of any WS. The use of graph theory („network“ model) and the algorithm for finding the optimal flow of networks makes it possible to assess as a whole more complex structures of water management and water supply systems from the point of view of optimizing the fulfilment of their storage function. Elements of surface water, groundwater, and water use subsystems can be integrated into the model, thus assessing the provision of water distribution from water sources to its consumption in municipalities. The relevant software was developed and its functionality verified as part of the Security Research project of the Czech Republic. The use of the model is expected especially in the TA CR project „Water systems and water management in the Czech Republic in conditions of climate change“ („Water Centre“), possibly in other projects and studies focused on the issue of drought and water shortage and the assessment of possible mitigating measures.
Acknowledgements
This article was created on the basis of research carried out as part of project VI20192022159 „Water management and water supply systems and preventive measures to reduce risks in the supply of drinking water“ of the BV III/1-VS programme, which was financed by the Ministry of the Interior of the Czech Republic.
The Czech version of this article was peer-reviewed, the English version was translated from the Czech original by Environmental Translation Ltd.
