SUMMARY
From this year, European Union member states are obliged to introduce preventive measures that will reduce the amount of food waste at all stages of the food chain. This article deals with this current topic, presents possible procedures for obtaining data on food waste production at various stages of the food chain, and shows the results of our own research and analysis about the usability of these data for reporting obligations and demonstrating future reductions.
INTRODUCTION
Solving the issue of food waste (sometimes referred to as gastro-waste) is one of the main priorities not only for the European Union (EU), but for the entire world. The reason is wasting of food, which, according to a study by the United Nations (UN) Food and Agriculture Organization (FAO), represents approximately one third of global food production – it is either food lost or wasted [1]. The FAO study also states that industrialized countries waste significantly more food than developing countries, especially at the consumer level. For example, consumers in Europe and North America produce 95 to 115 kg of food waste per capita per year, while in sub-Saharan Africa and Southeast Asia only 6 to 11 kg per capita is generated. For this reason, the UN committed to achieving global sustainable development by 2030 (the 2030 Agenda). This global action plan established 17 Sustainable Development Goals (SDGs) and 169 specific sub-goals in three areas of sustainable development: economy, society, and environment. SDG target 12 focuses on ensuring sustainable patterns of production and consumption. Specific objective 12.3 covers both food loss and waste reduction. It calls for halving global food waste at the retail and consumer levels, as well as reducing food losses within production and supply chains, including post-harvest losses [2]. This action plan was later implemented by introducing the Monitoring Framework for the circular economy (European Commission, 2018), in which food waste is explicitly listed as one of the ten circular economy indicators [3, 4]. The UN action plan has also been incorporated into EU legislation. Specifically, it is Directive 2018/851/EC of the European Parliament and the Council of 30 May 2018, amending Directive 2008/98/EC on waste, which states that member states should take measures to support the prevention and reduction of food waste in line with the 2030 Agenda for Sustainable Development adopted by the UN General Assembly on 25 September 2015, and in particular with its aim to reduce global food waste per capita at the retail and consumer levels and reducing food waste in production and supply chains, including post-harvest losses by half by 2030. These measures should be aimed at preventing and reducing food waste in primary production, during processing and manufacturing, in retail and other distribution of food, in restaurants and food services, and in households. In order to contribute to the achievement of the UN Sustainable Development Goal, member states should strive to achieve the indicative EU-wide target of reducing food waste by 30 % by 2025 and by 50 % by 2030. With regard to the environmental, social, and economic benefit of preventing the creation of food waste, member states should take specific measures in this area, including illustrative educational campaigns that would clearly show how to prevent the creation of food waste, and would become an official part of the adopted programmes. Member states should also measure progress made in reducing food waste. A common methodology should be established to measure the rate of this progress and also to facilitate the exchange of best practices between EU member states, as well as between individual food business operators. Based on such a methodology, reports should be submitted every year on the results achieved in reducing food waste.
METHODOLOGY AND DATA SOURCES
According to Directive 2008/98/EC of the European Parliament and the Council on waste (hereinafter referred to as the Waste Framework Directive), food waste falls under the definition of biological waste (biodegradable waste from gardens and parks; food and kitchen waste from households, offices, restaurants, wholesale, canteens, catering, and retail facilities; and comparable waste from food industry facilities). The same Directive states the definition of food waste as all food within the meaning of Article 2 of Regulation (EC) No. 178/2002 of the European Parliament and the Council that has become waste. Act No. 541/2020 Coll., on waste, adopted this definition of food waste, but the problem arises with the first and second stages of the monitored chain. The Waste Act, in letter d) paragraph 1 Section 2, states that it does not apply to excrement, straw, and other natural substances from agricultural production and forestry that do not exhibit any of the hazardous properties listed in the Annex to the directly applicable regulations of the EU on the hazardous properties of waste and they are used in agriculture and forestry in accordance with the Fertilizer Act or to produce energy through procedures and methods that do not harm the environment and do not endanger human health. These losses are not captured in the waste management system, and their amount or percentage is very difficult to determine.
The annual food waste reporting obligation introduced by the Waste Framework Directive applies from 2019, when the delegated decision was adopted, with the first reference year being 2020. The aim of reporting is to monitor and evaluate the implementation of measures to prevent food waste in member states using common methodology for measuring the level of food waste at different stages of the food chain. The common methodology is established by two decisions of the Commission.
The first is Commission Delegated Decision (EU) 2019/1597 of 3 May 2019 supplementing the Waste Framework Directive with regard to a common methodology and minimum quality requirements for the uniform measurement of food waste stages. The amount of food waste is measured separately for each of the five stages of the food chain. Specifically, the stages are:
- primary production,
- processing and manufacturing,
- retail and other distribution of food,
- restaurants and food services,
- households.
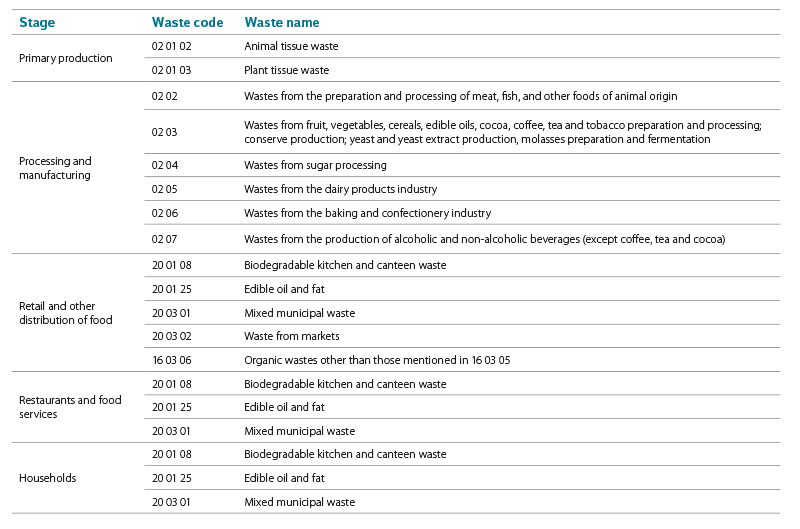
For each stage of the chain, Annex II assigned the types of food waste that are usually found within it; see Tab. 1.
Tab. 1. Waste codes occurring at each stage of the food chain
Annex III of Commission Delegated Decision 2019/1597 recommends methods for measuring food waste produced by a certain sample of food business operators and households using one of the following methods or their combination or other equivalent methods, in terms of relevance, representativeness, and reliability.
The direct measurement method is recommended for all stages of the food chain. Direct measurement includes various methods such as direct counts and weight and/or volume assessment. It generally provides the most accurate data, but is associated with high demands on costs, time and expertise, as well as direct access to food waste streams (through personal observations or communication with farms, businesses, and retail markets). In households, direct measurement includes kitchen scales, measuring cups, or other conventional measuring tools. Its strengths include the ability to update progress over time and track food waste [5].
For the first to third stages of the food chain, the Commission Decision recommends using weight balance. It measures food loss and waste by comparing inputs with outputs and taking stock changes into account. The literature [6, 7] states that one of the most common approaches to account for food loss and waste is material flow analysis (MFA), which has been successfully applied at different levels from individual products [8] to industries [7], but also at a macro level when analysing entire national systems [6] and wider geographical areas, e.g. the EU.
The measurement of food waste in the stages of retail sale and other of distribution food, restaurants and food services, and households is recommended to be carried out using waste composition analysis – this is a methodology of physical separation, weighing, and categorization of food waste flows from other materials that are not considered food waste, such as packaging or other solid waste. Analysis of waste composition provides accurate data and offers information about food waste (e.g. packaged or non-packaged food, as well as fruit and vegetables), which can help analyse financial costs and nutritional content. However, this methodology is expensive, requires a large sample, and does not provide information on the reasons for food waste [9].
The methodology recommends solving the problem of an insufficient amount of data from the stages of primary production, processing and manufacturing by means of questionnaires and interviews, coefficients and production statistics, as well as by analysing the composition of waste. According to Møller et al. [10], a questionnaire is a formal, structured way of collecting quantitative and qualitative data from participants and could be used to obtain data on the amount of food waste and other information from producers (growers), processors, retailers, and consumers (e.g. on waste management, awareness of the problem). In general, questionnaires, surveys and interviews are considered to be of equal information value and can be divided into two categories: those used to collect existing data (to assess reliability) and those used to estimate new amounts of food waste [9]. Questionnaires, surveys, and interviews can be conducted by telephone, electronically (online), via e-mail, or in person. The advantages of these types of surveys are that they are cost-effective, can be standardized, are among the most popular methods, and can reach a large number of people. However, they rely on intermediaries, sometimes creating misunderstandings between participants because respondents tend to underestimate the amount of waste they generate. In addition, low response rates tend to be noted.
The second decision defines the reporting format and is called Commission Implementing Decision (EU) 2019/2000 of 28 November 2019 establishing a format for reporting data on food waste and for submitting a quality control report in accordance with the Waste Framework Directive. The guidelines for reporting food waste and food waste prevention under this Implementing Decision aim to promote harmonized reporting of food waste and food surplus data by providing guidance and explanations based on the provisions of the legislation and the methodological framework.
There are currently two methodological approaches to estimating food waste in EU countries. One approach is based on MFA and combines statistical information on the production and trade of food products with food waste coefficients. The second approach estimates food waste based on waste statistics (WS). Both approaches are illustrated in the literature [11] using case studies carried out in three EU countries (Italy, Germany, and Denmark) and a comparison of the obtained results. The added value of such a comparison is that it allows identification of potential anomalies because both approaches rely on different data sources. Food waste estimates obtained using the MFA approach are generally higher than those obtained using the WS approach. The differences are more significant for the initial/primary stages of the food chain, i.e. primary production and food processing and manufacturing. These discrepancies are very probably caused by under-reporting of waste recorded by the relevant statistics because food flows generated in these stages can be processed on site in such a way that they do not become waste at all (e.g. burning residues for energy production, anaerobic digestion) and therefore do not need to be reported. Other issues that affect food waste estimates based on WS, and which may explain the differences found, are the effect of water content on the weight of food waste and the fact that countries have their own waste codes. Other inconsistencies may stem from differences between national classification systems and the one adopted by Eurostat, as well as uncertainty regarding the statistical data used because these data are reported from multiple sources and are inherently of varying quality. The latter problem also affects the MFA model, which uses statistical data as well. However, the model presents a comprehensive picture of the food system, as it provides a breakdown of food waste estimates by stage of the food supply chain and by food group, allowing the identification of critical food groups and stages of the food chain. This is particularly important as it can support the design of effective measures to prevent food waste after combining its findings with environmental aspects to ensure that food groups with the greatest integrated impacts are prioritized. Although country-specific coefficients should be collected to improve the robustness of the MFA approach, the model developed has the potential to be used to assess food waste data more broadly [2].
Quantifying food waste in EU countries using material flow analysis (MFA)
In the original MFA model, food waste was defined as “any food, and inedible parts of food, removed from the food supply chain” to be recovered or disposed of (including composted, crops ploughed in/not harvested, anaerobic digestion, bio-energy production, co-generation, incineration, disposal to sewer, landfill or discarded to sea) [12]. Instead, in the current model (version 1.0), the definition of food waste has been aligned with the EU definition of food waste (see section 2.2), which excludes crops left in the field or ploughed and the mortality of animals ready for slaughter in reporting food waste. However, these amounts are estimated by the updated model and are labelled as “food losses”. The amount of food waste is calculated at different stages of the food chain and is given in dry weight. The model follows a territorial approach that does not account for food waste contained in net imports of raw materials and manufactured products.
METHODOLOGY FOR DATA ACQUISITION
The aim of our research was to collect data on the production of food waste in all stages of the food chain. Due to the absence of necessary sources of data, especially from the primary producers of food waste (i.e. for the stages of primary production and processing and manufacturing), the method of direct contact and request to fill in the questionnaire was chosen (the questionnaire is shown in Tab. 2).
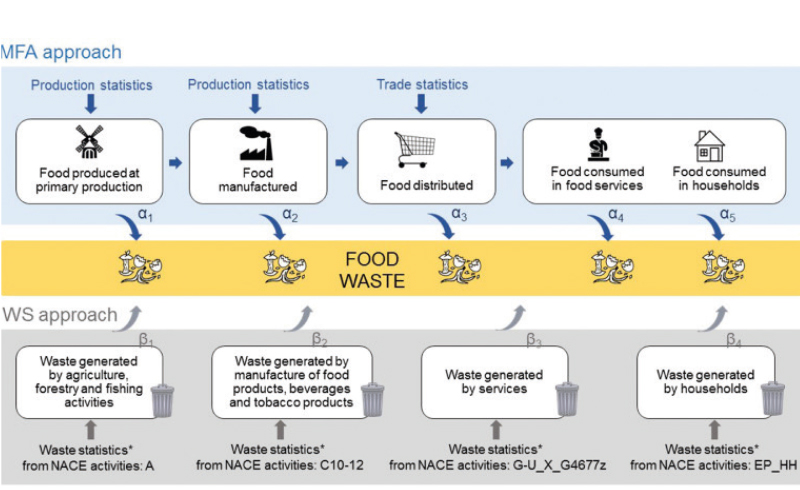
Fig. 1. Food waste model. Source: [13]
Tab. 2. Questions in questionnaires for waste catalogue number 02 01
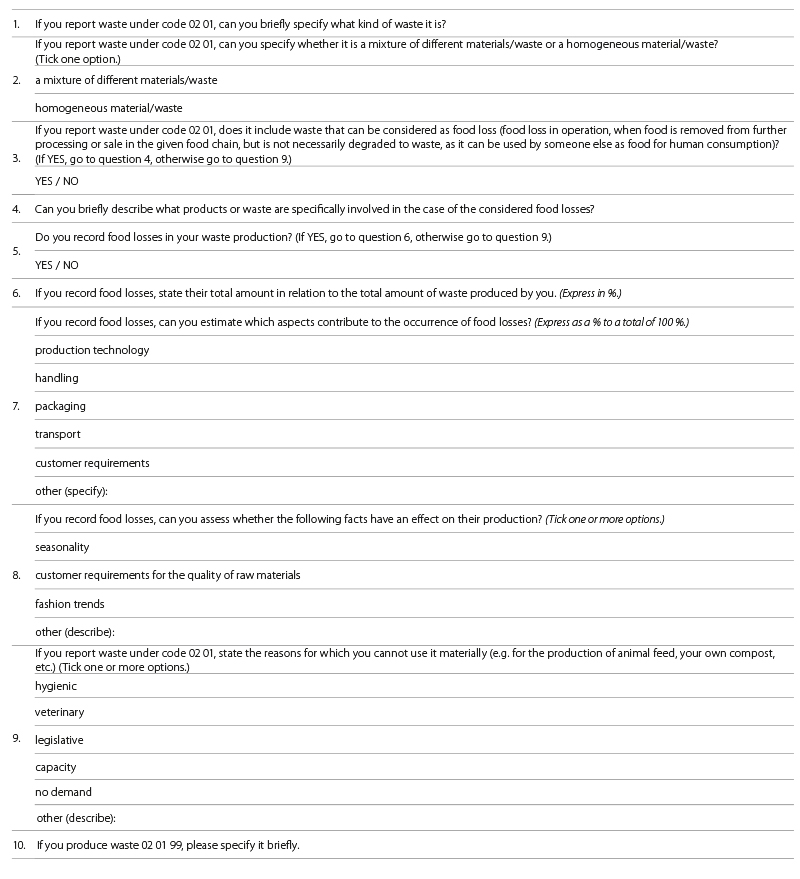
02 01 WASTE FROM AGRICULTURE, HORTICULTURE, FISHING, FORESTRY AND HUNTING
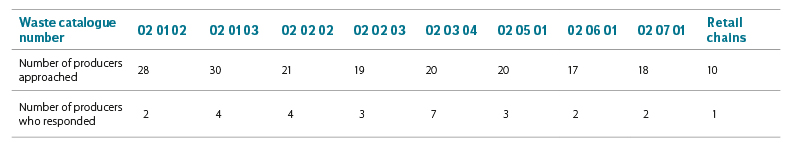
A total of 183 producers were interviewed. Specific data for each waste category are shown in Tab. 3. The number of completed questionnaires, including answers obtained by telephone or e-mail communication, was a total of 28. This is a 15 % return. The most common justification for unwillingness to cooperate was non-obligation. Reluctance also resulted from the current energy and Covid crises connected with the financial, personnel, and the problem of overall survival of the producers.
Tab. 3. Number of producers approached and return of responses for each waste catalogue number. Source: WRI TGM, p. r. i.
ANALYSIS OF WASTE COMPOSITION – MEASUREMENT
We chose direct measurement methods to obtain data on food waste production in the restaurant and food service and household stages. Due to the limited possibilities of entering premises, we took advantage of the opportunity to obtain data from other projects and analysed 4.5 tons of waste from kitchens and canteens (20 01 08) (restaurant and food services stage), about 1 ton of sorted biodegradable waste (20 02 01), and about 5.5 tons of mixed municipal waste (household stage).
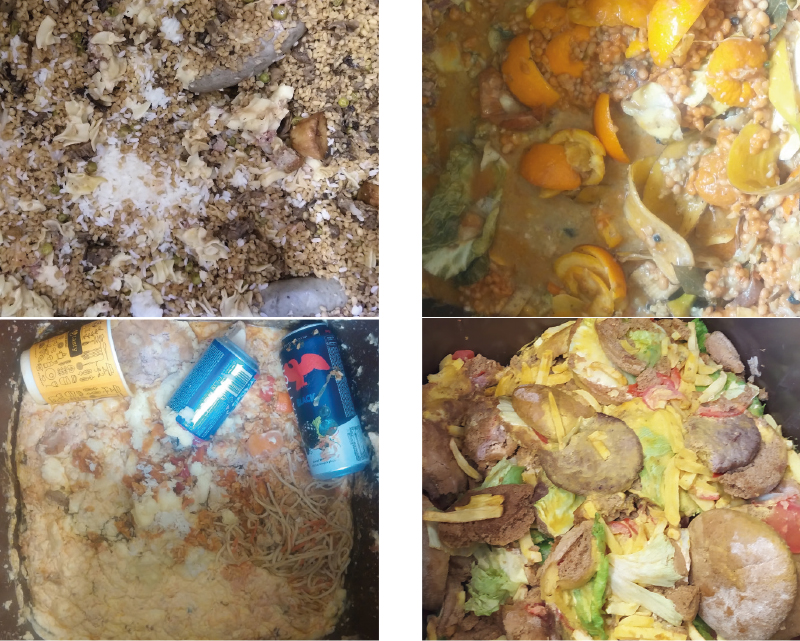
Fig. 2. Samples of analyzed gastro‑waste. Source: WRI TGM, p. r. i.
The analysis of waste from kitchens and canteens (specifically restaurants and school canteens) was focused on composition in terms of edible and (in our cultural conditions) inedible parts of food. As inedible parts of animal foods, we included eggshells, bones, claws, etc. and peels of citrus fruits, onions, melons, etc., and hard parts of stems, pome cores, drupe stones, etc. for plant foods. We also distinguished foods that were raw and cooked. The cooked state for vegetable waste means it is edible. We also included baked goods, pasta, and dumplings in cooked foods of plant origin. In the case of cooked inedible food of animal origin, these are mainly beef or poultry bones from broths or from baked or boiled portions of meat.
Another examined material was sorted biodegradable waste (20 02 01). These were collections from Prague city districts, in which sorting of the biological component of municipal waste was introduced as a pilot. During the project, we analysed approximately 1 ton of waste, which we sorted into the following components: garden waste with soil; fruits and vegetables; coffee grounds and tea bags; compostable packaging; baked goods and pasta; meat and bones; eggs/shells; dairy products; beverages excluding dairy; food packaging; beverage packaging; other plastic; textile; inert material (stone, construction waste).
As part of data collection for reporting the production of food waste from households, we examined mixed municipal waste, or the content of gastro-waste and garden waste from Prague housing estates. The recording of these two items was carried out separately in order to make it clear whether it is waste suitable for composting, registered as garden waste, or gastro-waste which is of organic origin but not suitable for composting. Compostable kitchen waste such as peels and normally unconsumed parts of fruits, vegetables, and flower root bundles together with soil were included in the garden waste component. Gastro-waste, or kitchen waste, was the remains of food from preparation and cooking or unconsumed food intended for direct consumption.
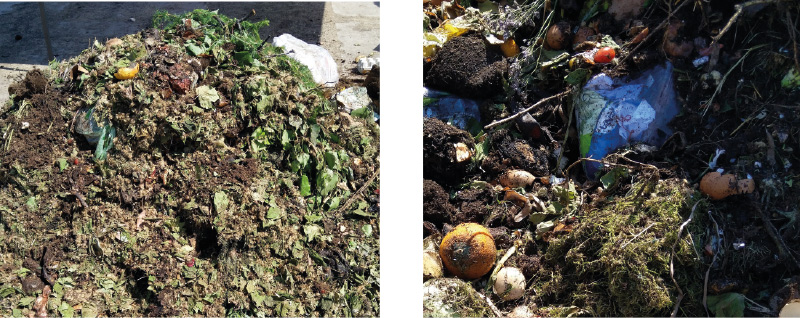
Fig. 3. Analyzed sorted biodegradable waste. Source: WRI TGM, p. r. i.
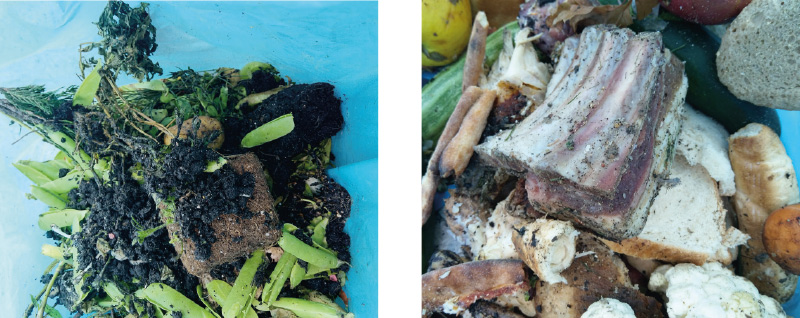
Fig. 4. Sorted components of mixed municipal waste – gastro‑waste (left) and compostable waste (right). Source: WRI TGM, p. r. i.
SURVEY RESULTS
The results of the questionnaire survey can be summarized as follows:
- Out of 28 producers, only 3 answered that their waste is food loss. Those who stated that their waste was food loss also recorded it, with one accounting for 0.5 %, another 1 %, and the last 3 %. The reasons why waste is not materially used were legislative (36 %), veterinary (36 %), hygienic (27 %), capacity (18 %), and technological (9 %).
- All waste producers of category 02 01 (Waste from agriculture, horticulture, fishing, forestry, and hunting) agreed that it was not food waste. Specifically, it was the remains of straw, hay, and other biomass from agriculture and forestry.
- For waste producers of category 02 02 (Waste from the production and processing of meat, fish and other foodstuffs of animal origin) it was food loss. In one case, these were sudden situations regarding cargo spoilage after a cooling system failure, one-off incidents, and in another case, this catalogue number includes hams from production before the expiration date, badly sliced ham, defective labels, and customer returns.
- For waste producers of category 02 03 (Waste from the production and processing of fruit, vegetables, cereals, edible oils, cocoa, coffee, tea and tobacco; waste from the canning industry, from the production of yeast and yeast extract, from the preparation and fermentation of molasses) inedible waste was declared as: chaff from grain cleaning; unwanted spices; sludge from peeling, cleaning and separation of oil seeds; waste scraps.
- For waste catalogue number 02 05 (Waste from the dairy industry), the waste is food loss in the case of discarded dairy products of poor quality. Waste is not further processed due to capacity and the presence of plastic packaging. The reason for the losses is milk processing technology. In another case, it was sludge from the treatment of wastewater from the production of dairy products.
- In the case of qualitatively unsatisfactory products from the entrances and exits of the production line, production intermediates, processed sugar, input raw material (fat, glucose) in the form of syrup, and for the mass in the final form without the initial packaging or in the initial packaging, the waste was reported under the catalogue number 02 06 (Waste from bakeries and confectionery production).
- For waste catalogue number 02 07 (Wastes from the production of alcoholic and non-alcoholic beverages excluding coffee, tea and cocoa), we were met with reluctance to cooperate due to concerns about disclosure of the recipe, but it was stated that the reported waste is a silica filter plate with no “food” residues.
- Only one of the retail chains that were approached responded to the questionnaire on waste catalogue number 02 03.
The results of gastro-waste analysis are shown in Fig. 5. Gastro-waste collected mainly from school canteens and restaurants contained the most cooked edible food of plant origin, up to 57 %. The other groups reached almost the same amount. Raw edible and raw inedible food waste of plant origin was contained in gastro-waste to the amount of 8 % and 10 %, respectively. Cooked edible and cooked inedible food waste of animal origin comprised 8 % and 13 %, respectively. The lowest was cooked inedible food waste of plant origin, at 0.5 %, and impurities in the form of cigarette butts, paper napkins, latex gloves, beverage packaging, etc. (0.3 %).
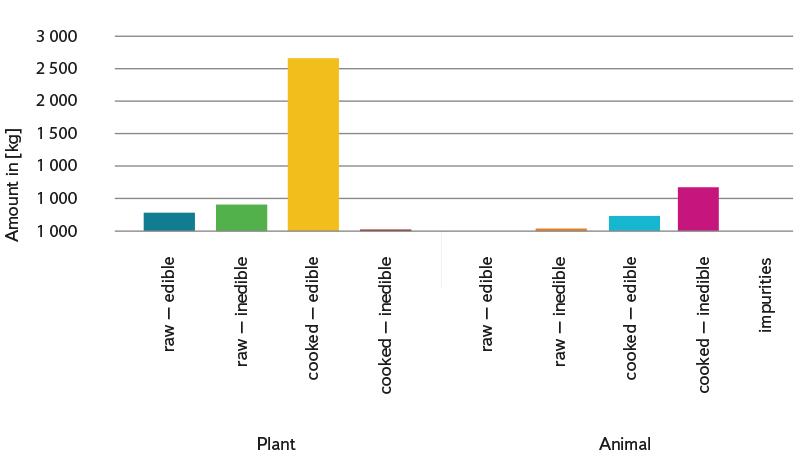
Fig. 5. Composition of gastro‑waste (20 01 08). Source: WRI TGM, p. r. i.
Sorted biodegradable municipal waste consisted, on average, of 83 % garden waste and soil, 14 % fruits and vegetables, and the remaining items represented up to 1 % of the total weight. The garden waste and soil component mainly consisted of chopped grass, leaves, flowers (flowers with decorations/wrapping from purchase – decorations and packaging were removed and included in undesirable impurities), soil, and turf. The component of vegetables and fruits, including their inedible parts, was represented not only by peels, but also whole pieces of potatoes, carrots, heads of lettuce, cabbage, peels of citrus fruits, melons, pineapples, etc. Waste was weighed without sales packaging.
The analyses showed that, for the introduction of a biowaste sorting and collection system, it is very important to raise awareness, educate, and prepare the population for such a waste management system. Practice tested the influence of the quality of preparation for the introduction of biowaste processing on the quality and success of circular economy solutions in a region. It was clear from the analyses carried out that, although information on suitable and unsuitable waste for composting is provided in a consistent manner, the quality/purity of the sorting was very different.
On average, the organic part of mixed municipal waste consisted of garden waste (11 %) and gastro-waste (10 %). These items were recorded separately to make it clear whether they are waste suitable for composting, registered as garden waste, or gastro-waste, which is of organic origin but not suitable for composting. Compostable kitchen waste, such as peels and normally unconsumed parts of fruits and vegetables, garden waste such as leaves, grass, soil and branches, were recorded in the garden waste component. Gastro-waste, or kitchen waste, was the remains of food that were either already cooked or were in a raw state. The samples often showed a large amount of baked goods, with less meat and dairy products. In the central parts of Prague in particular, gastro-waste included items related to fast food or restaurants in terms of composition and quantity. This gastro-waste can be processed, for example, at biogas stations; however, raising awareness and law enforcement are needed to ensure the discipline of producers in waste separation.
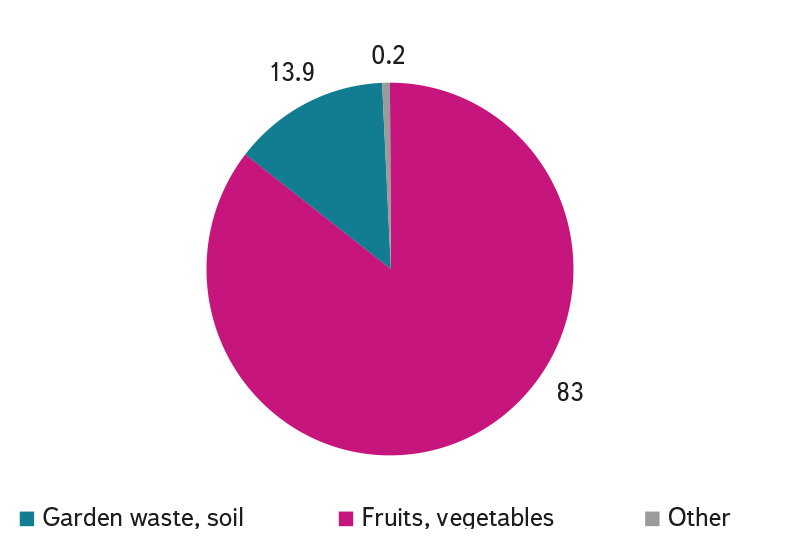
Fig. 6. Percentage composition of sorted biodegradable waste (20 02 01). Source: WRI TGM, p. r. i.
CONCLUSION
The topic of determining production and preventing the creation of food waste is currently being addressed within the project SS02030008 “Environmental Research Centre: Waste and Recycling Management and Environmental Safety (CEVOOH)”, where we are preparing a methodology for measuring food waste in close cooperation with the Ministry of the Environment. Our finding so far is that obtaining reliable data from the first three stages of the food chain is very problematic. We were basically not allowed into production areas for direct measurement, and the questionnaire survey carried out for the stages of the food chain: primary production and processing and manufacturing has a low success rate and little informative value. These conclusions are also confirmed by other studies conducted under the auspices of the Ministry of Agriculture, as well as foreign research. The only possibility of obtaining usable data are weight balances and data from other Czech and foreign studies and scientific papers, or the introduction of reporting obligations by amending existing legislation. From the point of view of accurate analysis of the amount and composition of food waste, we achieved the best results thanks to our own analyses of waste from canteens, biodegradable waste and mixed municipal waste, i.e. for the stages of the food chain of restaurants and food services and households. For the fourth and fifth stage, this method of monitoring is applicable and satisfactory.
Acknowledgements
The article was created as part of the research project SS02030008 “Environmental Research Centre: Waste and Recycling Management and Environmental Safety (CEVOOH)”, which is co-financed with the state support of the Technology Agency of the Czech Republic as part of the Environment for Life Programme.
The article has been peer-reviewed.
