

ABSTRACT
River basin digital twin technology is an advanced tool for assessing the effects of complex adaptation measures on the water balance in the context of ongoing climate change. The integrated, fully distributed, physically based MIKE SHE modelling system forms the basis of the digital twin developed for detailed simulation of the hydrological cycle. Using the Dyje River basin and the pilot upper Svratka catchment as case studies, specific measures to promote natural infiltration and enhance baseflow were tested, designed and quantified. The effects of climate change were assessed using an ensemble of 26 independent climate scenarios based on global climate models (CMIP6) for a 30-year period centred on 2050, compared with the historical reference period 1981–2010. Simulations without adaptation measures predict a decline in mean and low flows. Model tests showed that implementing a complex set of measures termed “hydrologically optimal agriculture”, involving modifications to the hydropedological properties of the soil and changes in vegetation cover, does not increase total runoff volume but has demonstrable potential to slow runoff from the affected areas and enhance baseflow. The simulation tool developed provides support for decision-making in river basin management.
INTRODUCTION
Rational water resources management currently faces unprecedented challenges arising from ongoing climate change and the resulting risks to the water balance. In this context, maintaining functioning ecosystems requires comprehensive support for natural infiltration through water retention in the landscape. The principal strategic aims of modern adaptation measures are to enhance baseflow, increase groundwater recharge and attenuate flood waves. These measures directly contribute to improving the overall security of both surface water and groundwater resources. Reliable assessment of the effects of climate change and the design of effective adaptation strategies require advanced simulation tools incorporating a comprehensive ensemble of climate scenarios that adequately cover the range of projection uncertainty.
Traditional static models are no longer sufficient to address these complex interdisciplinary questions.
An innovative response is the development of technology known as a digital twin, originally developed for industrial applications and increasingly established in environmental sciences in recent years [1]. Although there is no single precise definition of the term [2], digital twins in water management and hydrology offer a promising tool for integrated river basin management, flood forecasting and the optimisation of water supply systems [3–5]. Most definitions agree that a digital twin is a virtual replica of the physical environment that combines advanced data analysis with process-based modelling and incorporates real-time assimilation of measured data, including two-way feedback interaction. Developing such a complex system is a gradual process; however, the computational architecture of the Dyje River basin digital twin presented here enables real-time operation to address operational issues such as adaptive management of water abstractions and drought early-warning systems.
The aim of this article is to present the core component of the Dyje River basin digital twin: an advanced scenario model developed for quantitative and qualitative assessment of a river basin with a tight water balance. The principal advantage of a physically based process model, which requires a detailed understanding of hydrological processes in the landscape, is the ability to test areal and linear changes virtually without risking adverse effects on the real environment. The tool is based on the integrated MIKE SHE hydrological modelling system and is applied to the Dyje River basin as a regional-scale case study and the upper Svratka catchment at pilot scale. The methodology presented demonstrates the tool’s readiness for detailed assessment of the effects of complex adaptation measures on the water balance, integrates an ensemble of climate scenarios and evaluates the potential for mitigating climate-change impacts on baseflow through systematic landscape adaptation.
METHODOLOGY
Climate change scenarios
Climate projections from CMIP6-generation global circulation models (GCMs) were used for a detailed assessment of changes in the hydrological balance towards 2050. The selected dataset covers four Shared Socioeconomic Pathway (SSP) scenarios: SSP1–2.6 (Sustainability), SSP2–4.5 (Middle of the Road), SSP3–7.0 (Regional Rivalry) and SSP5–8.5 (Fossil-fuelled Development). From an original set of approximately 30 models, validation for the Czech Republic [6] was used to select a representative subset of the seven best-performing models that captures the uncertainty of the full ensemble (CMCC-ESM2, EC-EARTH3, GFDL-ESM4, MPI-ESM1-2-HR, MRI-ESM2-0, CNRM-CM6-1-HR and TaiESM1).
The complete projection ensemble comprised 26 independent CMIP6 model runs (Fig. 1), evaluated against the reference conditions (the 1981–2010 climate normal) for the 2050 projection period (2034–2064).
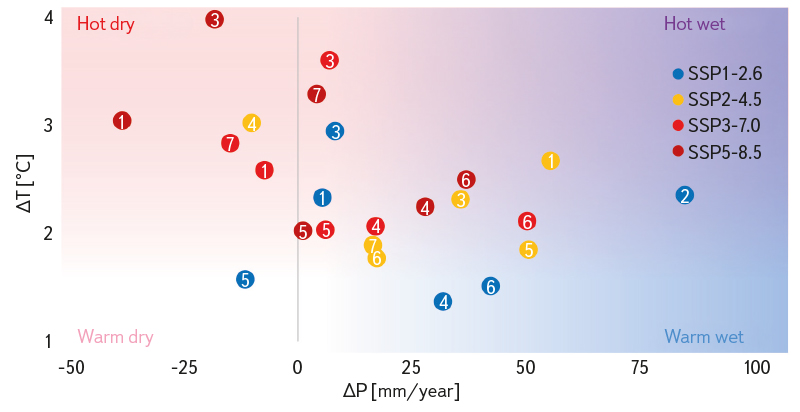
Fig. 1. Differences in the mean climatic characteristics of seven GCMs under four SSP scenarios for the 2050 projection period (2035–2064), relative to the reference period (1981–2010), aggregated for the Dyje River basin. SSP scenarios are distinguished by colour [7]. The GCMs used in this study are numbered as follows: (1) CMCC-ESM2, (2) CNRM-CM6-1-HR, (3) EC-EARTH3, (4) GFDL-ESM4, (5) MPI-ESM1-2-HR, (6) MRI-ESM2-0, and (7) TaiESM1
The model ensemble shows a high degree of variability and no consistent spatial pattern of precipitation change, even within individual SSP scenarios. Although SSP1–2.6 is generally associated with relatively moderate warming and smaller changes in precipitation regimes, whereas SSP5–8.5 represents very strong warming accompanied by major changes in precipitation, no consistent spatial pattern of change can be identified across the models within the individual SSP scenarios. Moreover, inter-model variability in long-term means differs substantially between decades of the future period. To understand and objectively quantify the uncertainty associated with climate change reliably, it is therefore essential to evaluate the entire climate projection ensemble rather than identify a single central scenario.
Because of the coarse spatial resolution and systematic biases of the global models, their outputs were transformed using the Advanced Delta Change (ADC) method, employing observed time series representing locally specific climatic conditions during the 1981–2010 reference period. This approach incorporates changes in both means and variability into the transformation process, thereby accounting for shifts in extremes that differ from shifts in mean values and compensating for systematic biases in precipitation simulations [8]. Mean daily temperature and precipitation totals entered the modelling process directly as boundary conditions, while reference evapotranspiration (ETo) was calculated using the standard Penman–Monteith equation.
River basin digital twin
The Dyje River basin digital twin is based on the fully distributed, physically based MIKE SHE modelling system (Fig. 2), designed to simulate complex hydrological processes across water-management components [9, 10]. At regional scale, spatial discretisation uses an orthogonal grid with 500 × 500 m cells.
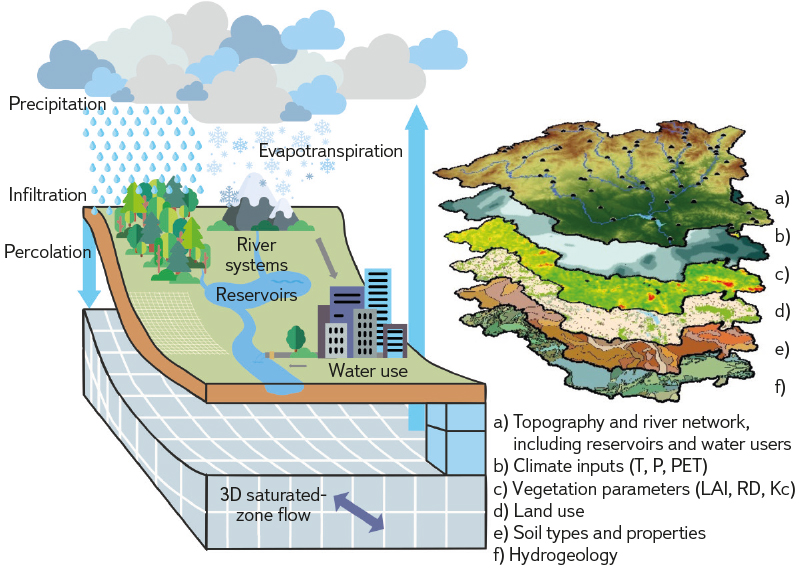
Fig. 2. MIKE SHE model structure, showing the processes represented in the model (left) and spatially distributed input-parameter layers (right)
Data are exchanged between modules at a daily time step, although the simulation engines operate at finer temporal resolutions according to their internal dynamics. Surface runoff is represented using a two-dimensional diffusive-wave approximation dynamically coupled with channel flow. Processes in the unsaturated zone are described by the one-dimensional Richards equation, including the effects of macropores, while the saturated zone is represented by a three-dimensional approximation of the Boussinesq equation. This close coupling allows two-way interaction between the aquifer and river network to be modelled, including baseflow and bank infiltration. Evapotranspiration is also included, combining evaporation from interception and bare soil with transpiration. Vegetation parameters, such as leaf area index, were derived at a daily time step from MODIS sensor data from the Terra satellite [11]. The model also includes 17 reservoirs, whose fully dynamic simulation is based on the applicable reservoir operating rules. Finally, water-use data derived from historical records in water-use registers are incorporated.
The reliability of the tool is underpinned by measured data from 52 stream-gauging stations. The model was calibrated for the hydrologically normal period 2000–2010 and successfully validated for the subsequent decade, 2011–2020, which included the extreme drought of 2015–2018, confirming its robustness even under extreme conditions. Calibration targeted the parameters with the greatest uncertainty and sensitivity (saturated-zone transmissivity, runoff characteristics, vegetation and snowmelt), while soil parameters were set using the authors’ own measurements of hydropedological properties, including laboratory determination of retention curves from soil pits at representative sites in the Dyje River basin. Agreement between simulated and observed discharge was assessed using the Nash–Sutcliffe efficiency coefficient (NSE), while groundwater levels (GWL) in 70 boreholes were assessed using root mean square error (RMSE). The final run, which optimised NSE and RMSE (Fig. 3), achieved NSE > 0.5 at 78 % of stations. Calibration emphasised agreement across the full flow-duration curve, with particular attention to low flows. Lower calibration efficiency in the Svitava catchment resulted from the limitations of spatial schematisation in representing highly complex hydrogeological conditions.
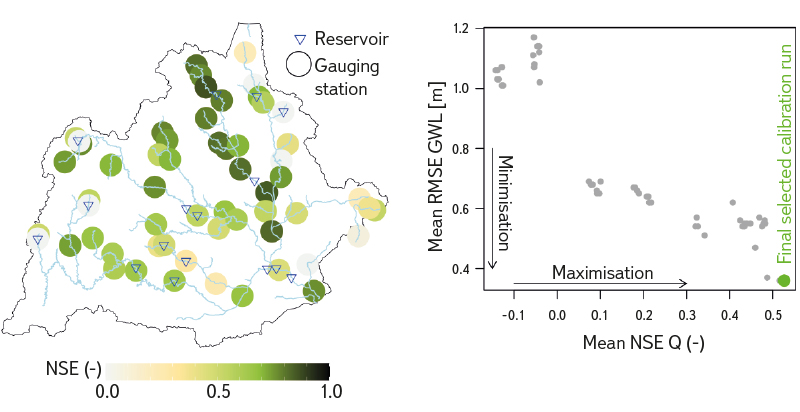
Fig. 3. Calibration results for mean daily discharge: spatial distribution of NSE values (left) and multicriteria selection of the final model run based on minimising RMSE for simulated and observed groundwater levels (GWL) and maximising NSE for mean daily discharge (right)
Conceptualisation of adaptation measures
The design of the adaptation measure comprised several successive phases (Fig. 4) and was based on an official methodology [12]. The first step was to define and conceptualise the effect of the adaptation measure in the physical reality of the catchment and identify the processes directly affected by it. Suitable locations for targeting the proposed measure then had to be identified objectively. The next step was the so-called “translation” of the physical effects of the measure into the MIKE SHE model-parameter framework, while ensuring that the measure remained functional and logically consistent with the nonlinear feedback relationships among parameters in the four-dimensional simulation environment (3D space and time) of the digital twin. These phases tend to be time-consuming and involve an iterative process of testing the effects of the proposed measure and reconciling them with expectations based on expert judgement, measured data or a literature review. In the next phase, the model incorporating the measure is run under 26 climate scenarios, and the results of the individual runs are compared with the reference-state model and with future projections without adaptation measures.
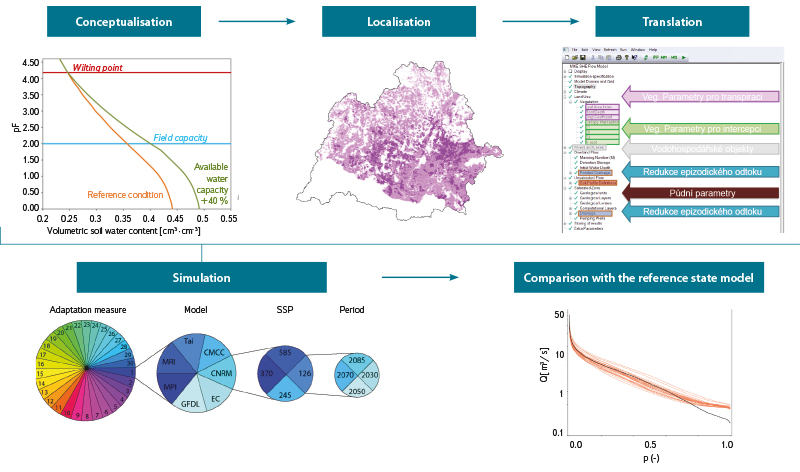
Fig. 4. Process for designing a complex adaptation measure and assessing its impact
The aim of the measure termed “hydrologically optimal agriculture” was to enhance natural infiltration, soil-water retention and baseflow. Its spatial targeting was based on an analysis of ecosystem vulnerability, which identified the greatest risk of declining runoff in highland areas [10]. As the modelling results demonstrated the low effectiveness of isolated measures – increasing soil-water retention where it was constrained by a moisture deficit primarily increased evapotranspiration – a complex set of measures termed “hydrologically optimal agriculture” was designed. The concept is theoretically grounded in the available literature and the interdisciplinary expert judgement of the CzechGlobe team, and integrates synergistic measures including no-till farming [13], biochar application [14], surface mulching [15], year-round soil cover using cover crops [16], targeted support for soil biota to restore macropores [17], and modifications to land-drainage systems to slow episodic runoff [18]. The design also prioritises crops with lower transpiration requirements [19]; under Czech conditions, millet may be one such crop. Translating these modifications into the logic of the simulation tool involved defining a new shape for soil-water retention curves, increasing saturated hydraulic conductivity and enhancing vertical flow through the macropore system. Rapid runoff was slowed in the model by increasing Manning’s roughness and enhancing macropore flow. Changes in vegetation cover were represented by modifying leaf area index (LAI) and rooting depth, enabling the digital twin to simulate the hydrological response of the catchment in detail.
RESULTS
The modelling results indicate that, by around 2050, climate change can be expected to reduce mean and low flows throughout the Dyje River basin relative to the reference period. Analysis of flow-duration curves for mean daily discharges, evaluated over the P25–P75 percentile range (Fig. 5), provides a comprehensive view of future development. A substantial decline is expected across the full flow range (up to 20 % in highland areas and 40 % in lowland areas), except at the highest flows, where optimistic climate scenarios (predominantly SSP1–2.6) instead simulate a slight increase. Variability in the decline in discharge is greater in the lowland catchment.
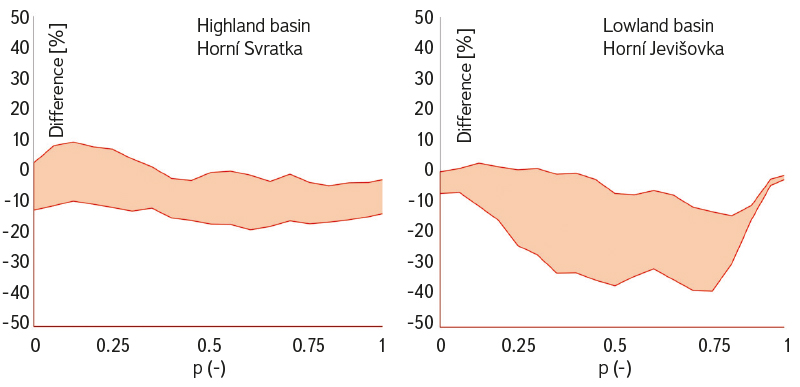
Fig. 5. Effects of climate change by 2050 on flow duration curves for mean daily discharge, including the P25–P75 uncertainty interval of the climate scenarios, in the highland catchment (left) and lowland catchment (right)
Model tests confirmed that the adaptation measures considered have a meaningful effect only when applied as a complex package, combining modification of hydropedological properties, suitable vegetation and management practices that prevent soil compaction and rapid episodic runoff. Although by around 2050 these complex agricultural measures do not increase long-term mean discharge (Qa) – and therefore do not provide a greater absolute volume of water leaving the catchment in the long-term water balance – they improve the distribution of water across hydrological conditions, promote water retention in the landscape and enhance baseflow by several to tens of per cent (Fig. 6).
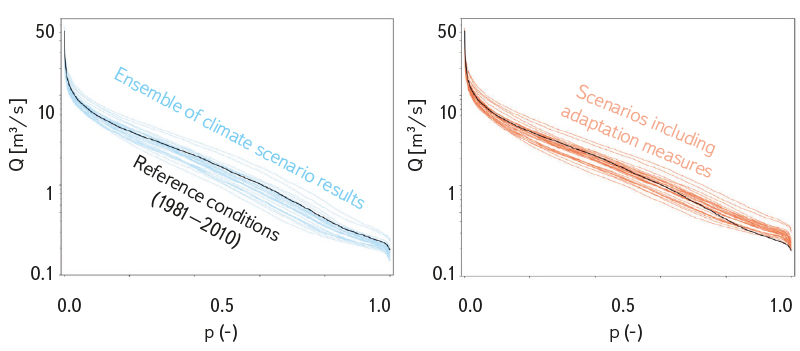
Fig. 6. Effects of climate change by 2050 on flow duration curves for mean daily discharge in the upper Svratka catchment (station 4420 – Dalečín): direct effects of climate change (left) and effects following implementation of the complex adaptation measure “hydrologically optimal agriculture” (right). The curves are based on daily modelled discharge. Individual coloured lines represent the 26 model scenarios
DISCUSSION
Assessment of climate-change impacts and the design of adaptation strategies are inherently associated with a cascade of uncertainties. These arise not only from the climate scenarios themselves, but also from the modelling and calibration processes and from expert judgement used to parameterise the proposed measures [20]. Because the individual climate projections are independent, no single universally applicable scenario can simply be identified. A comprehensive ensemble of appropriately selected climate models is therefore required to capture future development more reliably [7, 21]. The resulting projections should consequently be presented not as isolated deterministic values but as probabilistic developments with a clearly defined uncertainty interval. In the context of this study, which assesses the effect of the proposed measure across the entire catchment, the benefits of a detailed physically based approach become particularly apparent. Once the model setup has been properly verified, the nonlinear nature of interconnected hydrological processes repeatedly challenges simplified hypotheses about catchment behaviour, meaning that the modelled effects of the proposed measures differ from initial expert expectations. As noted, for example, by O’Connell et al. [22] and Collentine and Futter [23], spatial redistribution of water and nonlinear interactions between retention and evapotranspiration often produce counter-intuitive results that can be captured accurately only using physically based distributed models. With simpler empirical or conceptual models, these a priori and simplified assumptions could themselves become a primary source of substantial bias in the results. Fully distributed physical models, by contrast, can capture these nonlinear feedback mechanisms in detail, thereby reducing the risk of overestimating or underestimating the overall effect of the measures.
Fully distributed models also make it possible to quantify accurately the so-called green–blue water paradox. The widespread expert assumption that promoting vegetation and increasing infiltration automatically enhance baseflow often proves misleading. As Jackson et al. [24] demonstrate, denser vegetation cover increases total evapotranspiration. In managed landscapes, infiltrated water may therefore either be consumed entirely by crops with high transpiration requirements or be rapidly drained by historical subsurface drainage systems. The combined effects of increased evapotranspiration and functioning shallow drainage can then paradoxically lead to an overall decline in river-network flows – a loss of so-called blue water – causing the proposed retention measure to lose its primary purpose.
CONCLUSION
River basin digital twin technology (Digital Twin) is a key tool for rigorous assessment of climate-change impacts and the design of adaptation strategies. Application of the fully distributed, physically based MIKE SHE model to the Dyje River basin and the pilot upper Svratka catchment confirmed its ability to represent complex, nonlinear hydrological processes in the landscape in detail. Evaluation of an ensemble of 26 independent climate scenarios showed that, without timely implementation of measures, a substantial decline in mean and low flows can be expected by 2050. Isolated interventions are insufficient to mitigate these adverse effects reliably; instead, a complex package of measures is required, for example in the form of hydrologically optimal agriculture. Although this spatially extensive, synergistic modification of soil hydropedological properties and vegetation cover does not increase the absolute volume of long-term runoff, it improves the distribution of water within the catchment and enhances baseflow during dry periods. The simulation tool, rigorously calibrated using historical data, thus provides robust and fully operational support for strategic decision-making in river basin management.
Acknowledgements
This article was produced with support from the Technology Agency of the Czech Republic (TA CR) within the project Water systems and water management in the Czech Republic under climate change conditions (No. SS02030027, Water Centre). The methodological part of the article was funded by the European Union’s Horizon Europe research and innovation programme within the PHISHES project (Grant Agreement No. 101157438) and by the National Agency for Agricultural Research (NAZV) project Integrated strategies for reservoirs to maintain water quality under climate change (No. QL25020021).
The Czech version of this article was peer-reviewed, the English version was translated from the Czech original by Environmental Translation Ltd.
