

ABSTRACT
This paper examines the potential impact of projected climate change on the thermal regime of a drinking-water reservoir.
The methodology was based on simulating temperature changes in the reservoir using the two-dimensional (2D) CE-QUAL-W2 software, which incorporates a mathematical model for the hydrodynamic simulation of two-dimensional flow and water quality processes in reservoirs. Its hydrodynamic component is based on the laterally averaged three-dimensional equations of motion. Simulations of the thermal regime and water quality are performed by numerically solving the turbulent advection–diffusion equation. The total heat exchange between the water body and the atmosphere is quantified based on air temperature, dew point temperature, absolute humidity, wind speed, cloud cover and the geographical location of the reservoir surface.
The potential impact on the thermal regime was assessed using Vrchlice Reservoir as a case study. The model was calibrated for 2023 using detailed measurements of vertical water temperature profiles at selected monitoring sites provided by the Elbe River Water Authority; subsequent verification was carried out for 2022. To compare the affected thermal regime with the current state, 2018 was selected as the reference year. The observed daily air temperature series for 2018 was transformed using the Advanced Delta Change (ADC) method to reflect changes derived from climate models for the 2050 and 2085 horizons. The scenario calculations presented in this article isolate the effect of changes in air temperature, while other meteorological and hydrological-operational inputs are kept at their 2018 reference levels.
The results provide a comparison of mean water temperatures in characteristic vertical profiles for the selected climate change scenarios for 2050 and 2085 with the corresponding values for 2018, as well as a similar comparison of surface water temperatures.
INTRODUCTION
The issue of the potential impact on the thermal regime of a drinking-water reservoir was addressed as part of the TA CR project Water Systems and Water Management in the Czech Republic under Climate Change Conditions at the Faculty of Civil Engineering of the Czech Technical University in Prague from 2020 to 2026. At the beginning of the project, the Vrchlice River basin was selected as the pilot basin; the eponymous drinking-water reservoir is also located there. The potential impact on the thermal regime of the drinking-water reservoir was therefore assessed using this reservoir as a case study.
Globally, lakes and reservoirs respond to climate change through rising water temperatures, changes in the duration and intensity of thermal stratification, changes in mixing regimes and, in some cases, deterioration of oxygen conditions. Model projections of the thermal structure of reservoirs therefore provide an important basis not only for assessing their physical regime, but also for subsequent assessments of water quality and biogeochemical processes.
The aim of the study is to quantify how the thermal regime of Vrchlice Reservoir may change near the dam and at the surface under climatic conditions representing the 2050 and 2085 horizons and the SSP2-4.5 and SSP5-8.5 scenarios, and to compare these changes with the reference year 2018. The study addresses three questions: (i) how mean and surface water temperatures change, (ii) how the response differs between climate scenarios and time horizons, and (iii) what limitations need to be considered when interpreting the results for water management practice. Vrchlice was selected as the project’s pilot site and, at the same time, as a drinking-water reservoir with available vertical-profile measurements and operational data. The practical benefit is the provision of a basis for assessing possible future changes in thermal conditions in the area of drinking-water intakes and for subsequent assessment of reservoir operation and water quality; the methodological benefit is the application of a laterally averaged 2D model to a specific Czech drinking-water reservoir using a set of climate scenarios.
METHODOLOGY
Theoretical analysis
A comprehensive comparison of reservoir models shows that CE-QUAL-W2 can simultaneously simulate water-surface elevation, flow, water temperature and selected water-quality parameters, while the choice of model must correspond to the geometry of the reservoir and the dominant physical processes [1]. Changes in the thermal regime of reservoirs under climate change conditions have been addressed, for example, in study [2]. Golub et al. [3] explicitly link projections of lake temperature and thermal structure with future modelling of oxygen, water quality, biogeochemical processes and algal blooms. Ferreira and Fernandes [4] addressed integrated modelling of river–reservoir systems and the importance of linking hydrodynamics, water quality and reservoir operation. Higher temperatures and changes in hydrological extremes may also affect nutrient mobilisation, turbidity, concentrations of dissolved substances and other water-quality parameters [5]. Similarly, earlier case studies of proposed reservoirs show that combining monitoring, modelling of pollutant loads and modelling of reservoir response can be used to forecast future trophic status and support decision-making [6].
CE-QUAL-W2 was selected to simulate changes in the thermal regime of drinking-water reservoirs under projected climate change conditions. It consists of a model for the hydrodynamic simulation of two-dimensional flow and water quality processes in reservoirs, developed by the Department of Civil and Environmental Engineering at Portland State University. The model is available as free software for unrestricted use [7, 8]. Talebbeydokhti et al. [1] reviewed the monitoring and modelling of water quality in reservoirs, including the capabilities and limitations of CE-QUAL-W2.
In the Czech context, hydrodynamic and water-quality modelling of drinking-water reservoirs has also long been carried out by the research team at the Institute of Hydrobiology of the Biology Centre of the Czech Academy of Sciences, with the involvement of J. Hejzlar. For the Římov Reservoir, the CE-QUAL-W2 model was used for two-dimensional modelling of hydrodynamics and water quality [9]. Subsequent work also examined the potential impacts of climate change on water quality in the reservoir [10].
The thermal regime of deeper drinking-water reservoirs has a pronounced seasonal character: during the warm part of the year, stable stratification may develop, with a warmer surface layer and a cooler hypolimnion, while during periods of mixing, temperature differences within the water column decrease. For water management practice, the temperature at the intake level is particularly important because, together with stratification and oxygen conditions, it influences the choice of intake level and may be related to raw water quality. For ecological assessment, the thermal regime is also important because of its relationship with the rates of biological and biogeochemical processes [3, 9, 10].
The preparation of climate inputs was based on the Advanced Delta Change (ADC) incremental method, which transforms observed series so that the difference between the reference and future series corresponds to changes derived from climate models [11]. At a daily time step, it is important that the transformation captures not only changes in the mean but also changes in variability. This is particularly important for precipitation and extreme values, for which changes may not correspond to a simple shift in the mean value. For air temperature, the transformation is performed linearly, meaning that systematic bias in the climate model does not have the same significance for the resulting temperature change as it does for precipitation [11]. The output consists of daily series of mean air temperature and other hydroclimatological variables that can be used for subsequent hydrological and water management modelling. For the air temperature used in this study, the transformation preserves the temporal structure of the reference year and applies the change in mean and variability derived for the given climate model, scenario and time horizon. Fošumpaur and Kováčová [12] addressed adaptive reservoir management during hydrological drought.
CE-QUAL-W2 software
The solution is based on the governing equations. The hydrodynamic component consists of the laterally averaged longitudinal momentum equation, the hydrostatic equation in the vertical direction, and the continuity equation. The CE-QUAL-W2 model uses the hydrostatic approximation: because the longitudinal dimension of the reservoir is considerably greater than its vertical dimension, vertical accelerations and shear stresses are neglected in the vertical momentum equation. The vertical velocity component is not zero, however; it is included in the advection term of the longitudinal momentum equation and in the continuity equation. Lateral averaging assumes that lateral variations in velocity, temperature and other water-quality parameters are negligible. It should be borne in mind that this assumption may be inappropriate for large water bodies exhibiting significant lateral variations in water quality.
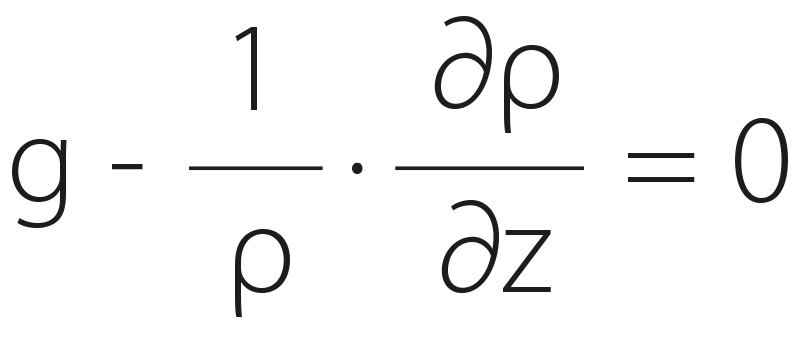
For a horizontal longitudinal axis and neglecting the longitudinal atmospheric pressure gradient, the longitudinal momentum equation (1) and the hydrostatic equation in the vertical direction (2) take the following form:
 (1)
(1)
(2)
where:
x, z are the coordinates in the longitudinal and vertical directions [m]
the laterally averaged longitudinal velocity component [m ∙ s-1]
the laterally averaged vertical velocity component [m ∙ s-1]
t is time [s]
g gravitational acceleration [m ∙ s-2]
r density [kg ∙ m-3]
p pressure
H water-surface elevation [m]
txx, txz are turbulent shear stresses acting in the longitudinal direction [Pa]
The integration limits extend from the elevation to the water surface at . A condition for using the governing equations formulated in this way is that the transverse velocity components are negligible compared with the longitudinal and vertical components. They are therefore recommended for narrow and deep reservoirs, preferably with a predominantly straight longitudinal alignment.
The choice of a 2D laterally averaged model for Vrchlice Reservoir was based on the longitudinal character of the reservoir. The length of the reservoir at maximum flows is approximately 4.8 km, while the average bottom width in the model is approximately 200 m and the maximum bottom width is 476 m; the height of the dam above the surrounding terrain is almost 34 m. Given the scale of the reservoir, it can therefore be expected that gradients along the longitudinal axis and in the vertical direction are dominant when assessing the longitudinal–vertical temperature structure. This assumption does not, however, mean that lateral inhomogeneities are negligible under all conditions. Uncertainty may be increased particularly by the local effects of side bays and tributaries, spatially variable wind effects, and conditions in the immediate vicinity of the intake structures. The results therefore represent a laterally averaged picture of the thermal regime and should not be interpreted as a substitute for a fully three-dimensional description of local flow and temperature structures [7, 8].
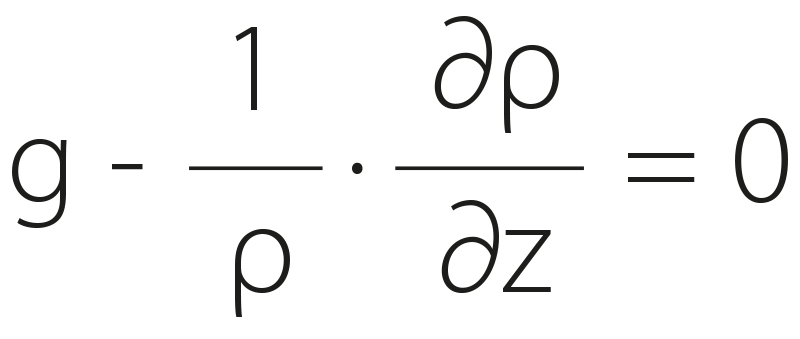
The continuity equation (3) is given by:
(3)
The governing diffusion equation for modelling temperature and water quality is [13]:
 (4)
(4)
where:
Φ is the water temperature [°C]
Dx, Dz are the longitudinal and vertical dispersion coefficients [m2 ∙ s-1]
From the perspective of external influences, the thermal regime of the reservoir is predominantly affected by heat exchange between the water surface and the atmosphere. This consists of a number of components; the total heat flux is given by equation (5):
 (5)
(5)
where:
qH is the total heat flux between the water surface and the atmosphere [W ∙ m-2]
q1 the heat flux received from shortwave solar radiation [W ∙ m-2]
q2 the heat flux received from longwave radiation [W ∙ m-2]
q3 the heat flux by convection [W ∙ m-2]
q4 the heat loss through longwave radiation from the water surface [W ∙ m-2]
q5 the heat flux due to heat loss through evaporation [W ∙ m-2]
While the quantities q₁ and q₂ are independent of temperature, the remaining terms are functions of the water temperature at the surface and the air temperature. A number of well-established empirical equations are available for determining them.
Data for the model
The model solution is based on dividing the reservoir longitudinally into interconnected segments. Each segment is defined by its length along the reservoir axis, and its widths at selected elevations are then derived from a digital terrain model of the reservoir bottom. To determine the individual terms of equation (5), the model requires the geographical location of the reservoir and the time series of air temperature, dew point temperature, wind speed and direction, and cloud cover during the period being modelled [7, 8].
In the scenario calculations presented, climate change was applied only to air temperature. Dew point temperature, wind speed and direction, and cloud cover were kept unchanged in the scenario runs, using the 2018 reference meteorological series. This deliberately isolates the effect of changes in air temperature; at the same time, it represents a simplification, as future changes in other meteorological variables are not included in this study.
The boundary conditions are the time series of water inflow and outflow and the water temperature at the inflow, while the initial conditions are the initial water-surface elevation and water temperature in the reservoir.
Water-quality simulations in reservoirs using the CE-QUAL-W2 model have been presented, for example, in studies [9, 11, 14], while the thermal regime under projected climate change conditions has been addressed in studies [2, 10].
The model and its calibration
The basis of the model developed for Vrchlice Reservoir was the Bathymetry file, which defines the geometric model of the reservoir. It consisted of a total of 41 segments of varying length along the reservoir axis, with the longitudinal dimension of the segments being approximately 100 m. The varying widths of the individual layers were derived at 1 m elevation intervals throughout the water column in the Baltic height system after adjustment. An example of the location of the computational segment axes is shown in red against the background of the national map from ČÚZK [15] in Fig. 1. The maximum bottom widths ranged from 55 m in segment 1 to 476 m in segment 39, with an average of 200 m for the reservoir as a whole.
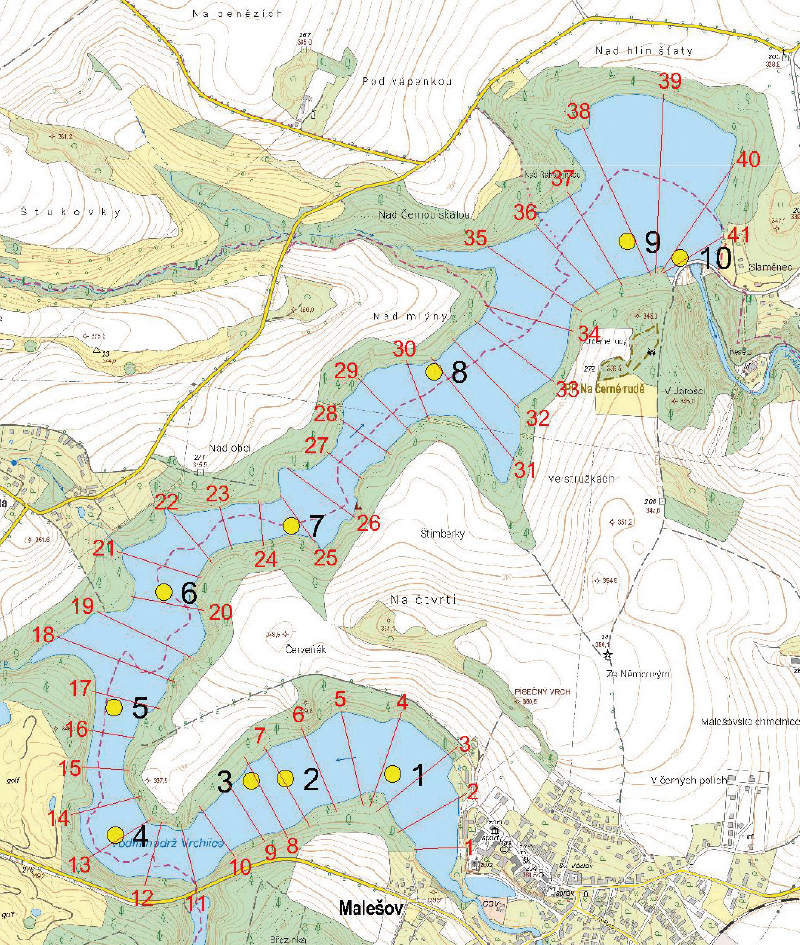
Fig. 1. Vrchlice Reservoir on the Vrchlice river, southwest of Kutná Hora, showing the vertical profiles used for measuring water temperature and other water-quality parameters and the axes of the computational segments
The calibration of the 2D model was carried out for 2023, when numerical simulations of the development of the thermal regime of Vrchlice Reservoir were performed using meteorological data from the Czech Hydrometeorological Institute (CHMI) stations at Chotusice and Vavřinec and their mean values (mean daily values). The Chotusice station is located 12 km east of Vrchlice Reservoir near Čáslav military airfield, while the Vavřinec station is 14 km west, near the village of Uhlířské Janovice. The time series of water inflow into the reservoir was calculated from the time series of water outflow and reservoir water-surface elevation. For the unknown water temperature at the inflow, a typical annual profile was estimated using water temperature measurements at vertical profile 1 at the beginning of the reservoir impoundment.
The hydrological input in the application presented was expressed as the total inflow calculated from the water balance between outflow and the change in the water storage volume in the reservoir. The individual inflows are therefore not assessed separately in this article, and their potential spatial temperature heterogeneity represents one of the limitations of the model simplification. The outflow condition was based on operational data; in the years assessed, the uppermost of the three intake levels was used according to the reservoir operator, and this was taken into account in the model. The effect of selecting an alternative intake level was not included in the scenarios presented here.
The calibration step was carried out for 2023. The meteorological input variants from the Chotusice and Vavřinec stations and their average were compared; agreement was assessed based on the vertical temperature profiles at verticals 8 and 9 and the difference between their mean temperatures. The best agreement was achieved using data from the Chotusice station. Figs. 2 to 5 show representative comparisons for 17 April 2023, when summer stratification had already developed, and 28 August 2023, when summer stratification was fully developed.
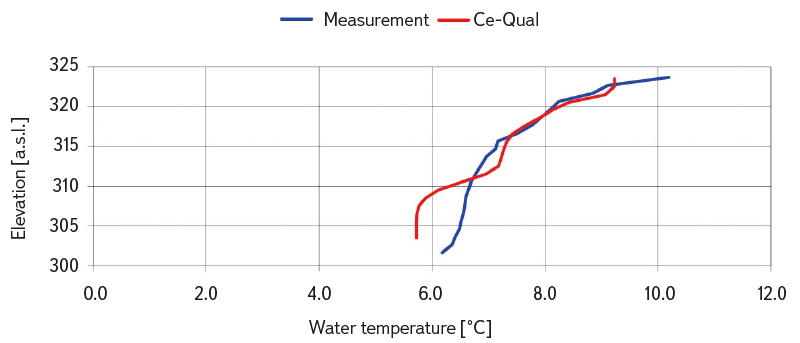
Fig. 2. Comparison of measured and simulated water temperature profiles at vertical profile 8 on 17 April 2023, based on measurements provided by the Elbe River Water Authority and simulations using the CE-QUAL-W2 model
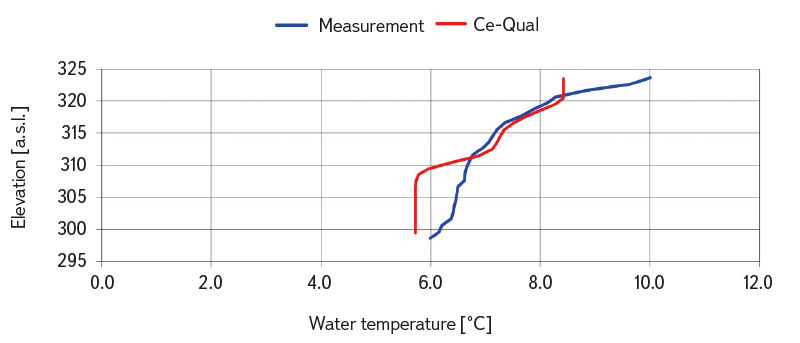
Fig. 3. Comparison of measured and simulated water temperature profiles at vertical profile 9 on 17 April 2023, based on measurements provided by the Elbe River Water Authority and simulations using the CE-QUAL-W2 model
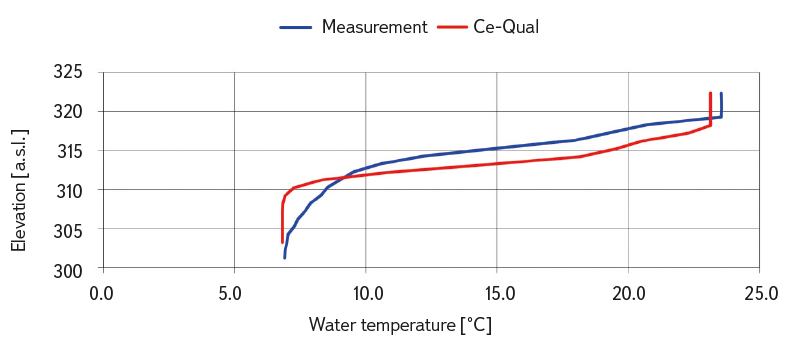
Fig. 4. Comparison of measured and simulated water temperature profiles at vertical profile 8 on 28 August 2023, based on measurements provided by the Elbe River Water Authority and simulations using the CE-QUAL-W2 model
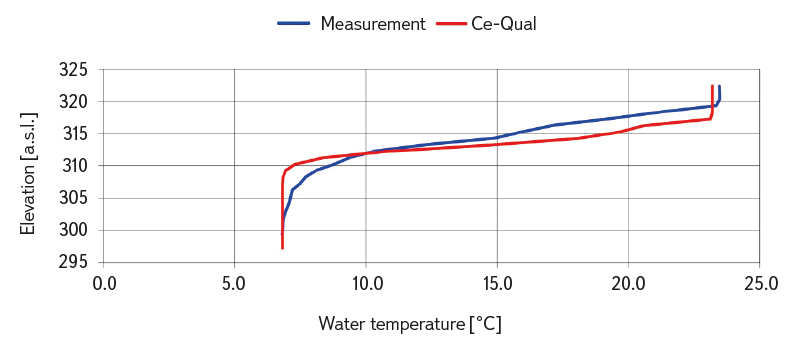
Fig. 5. Comparison of measured and simulated water temperature profiles at vertical profile 9 on 28 August 2023, based on measurements provided by the Elbe River Water Authority and simulations using the CE-QUAL-W2 model
For parameters for which separate site-specific calibration data were not available, the default settings based on the example CE-QUAL-W2 configurations were retained. As part of this study, no comprehensive multi-criteria optimisation of all model parameters or separate sensitivity analysis of wind sheltering, terrain shading of solar radiation, or evaporation parameterisation was performed. These factors are therefore taken into account below as sources of uncertainty in the results.
Subsequent verification was carried out for 2022 using the same model settings. The agreement between the vertical temperature profiles was comparable to that achieved for the 2023 calibration year. However, standard quantitative metrics such as RMSE or MAE were not calculated as part of the available assessment; the calibration and verification results must therefore be understood as a qualitative to semi-quantitative assessment of profile agreement.
Measurements from 2024 were available to the researchers as part of a broader project but were not included in the calibration and verification dataset presented here. Their use together with measurements from additional dates would provide a suitable basis for subsequent independent validation and quantitative assessment of the model.
Numerical experiments and scenarios
The aim of the numerical experiments was to assess the potential impact of the projected climate changes on the thermal regime of the drinking-water reservoir. For this purpose, future periods centred on 2050 (2036–2065) and 2085 (2071–2100) were selected. The year 2018 was used as the reference meteorological and hydrological period against which the results were compared. The year 2018 was not selected as a representative average year for the current climate period, but deliberately as a reference year representing a stress condition. It was characterised by a combination of above-average temperatures and dry conditions, which may be regarded as analogous to more frequent episodes in the future. Its use therefore makes it possible to assess further changes in the thermal regime of the reservoir under the climate scenarios against an already relatively unfavourable baseline condition. At the same time, continuous input series required for setting up and evaluating the model simulations were available for 2018. The designation of the years 2050 and 2085 refers to the midpoints of the 30-year periods 2036–2065 and 2071–2100, respectively. The transformation of the 2018 time series using the Advanced Delta Change method is described in the section Projected climate changes. The aim of the first set of calculations was to assess the potential impact on the thermal regime resulting solely from the assumed changes in air temperature. Water inflows and withdrawals for both 2050 and 2085 were assumed to be the same as in 2018, when the water level in the reservoir remained close to the storage level for almost the entire year.
As part of the wider project, a second set of calculations was also carried out, building on the outputs of Fošumpaur [12], in which the water level was assumed to follow the DG3 operating curve under minimum water withdrawals. As the results of this variant are neither presented nor discussed in this article, this scenario is not included in the set evaluated below and will be reported separately in the final TA CR project report.
Description of the location
Vrchlice Reservoir was selected for modelling the impact of projected climate changes on its thermal regime. It is located on the eponymous watercourse southwest of Kutná Hora and is impounded by a concrete dam. The dam crest is at an elevation of 325.80 m a.s.l., while the spillway crest is at 323.80 m a.s.l., which is also the elevation of the storage level. The height of the dam above the surrounding terrain is almost 34 m. The reservoir length at maximum flows is 4.8 km, the flooded area at the storage level is 0.935 km², and the storage volume is 7.89 million m³. The location of the reservoir is shown in Fig. 1. The dam is equipped with a three-level intake structure. In the years assessed, only the upper intake was used, according to the reservoir operator, and this was taken into account in the model.
The reservoir is operated by the Labe River Water Authority, which has recently been carrying out detailed vertical-profile measurements of a range of water-quality parameters several times a year on a regular basis, including water temperature and dissolved oxygen concentration. Measurements are routinely carried out at 10 vertical profiles, the locations of which are shown in Fig. 1. As part of the collaboration, the researchers were provided with the results of vertical-profile measurements carried out in 2022, 2023 and 2024. Daily data on reservoir outflow, water level and air temperature measured at 7 a.m. were also available for 2018, 2022, 2023, and 2024.
Projected climate changes
The projected climatic conditions used to simulate the thermal regime of the reservoir were derived from the methodology and data outputs of Work Package WP 1, Partial Objective DC 1.2 of the Water Centre project, which focuses on identifying areas with water resource deficits and modelling water availability under current and future conditions [11, 16]. The CE-QUAL-W2 model was not supplied directly with raw outputs from climate models, but with adjusted meteorological series based on the observed reference climate and changes in climate variables derived for the selected future time horizons. The projected climate was derived primarily from simulations by global climate models from the Coupled Model Intercomparison Project Phase 6 (CMIP6), supplemented by the regional ALADIN-CLIMATE/CZ model. The dataset comprises six global models (CMCC-ESM2, EC-EARTH3, GFDL-ESM4, MPI-ESM1-2-HR, MRI-ESM2-0 and TAIESM1) and the regional ALADIN-CLIMATE/CZ model; the individual models differ in their spatial resolution and in the availability of Shared Socioeconomic Pathways (SSP) scenarios [11]. For the purposes of this study, the SSP2-4.5 and SSP5-8.5 scenarios were used, representing an intermediate future development pathway and a more emissions-intensive pathway based on high reliance on fossil fuels, respectively. These two scenarios make it possible to compare a more moderate and a more pronounced response of the reservoir’s thermal regime to climate change.
The preparation of climate inputs was based on the incremental Advanced Delta Change (ADC) method, which transforms observed meteorological series so that the change between the reference and future series corresponds to changes derived from climate models [11]. The method allows not only changes in mean values but also changes in variability to be taken into account. This is particularly important for precipitation and extreme values, for which future changes may not correspond to a simple shift in the mean. In the case of air temperature, the transformation is performed linearly, thereby limiting the influence of systematic climate-model bias on the resulting change in temperature.
The reference climate period was 1991–2020, with 2018 selected as the specific baseline year for the simulations. The future time horizons do not represent simulations of individual calendar years, but 30-year periods, 2036–2065 and 2071–2100, which are referred to in the following text, for simplicity, as the 2050 and 2085 horizons. For each climate model and scenario, the ADC method was used to determine the changes between the reference period 1991–2020 and the respective future period. These changes were subsequently applied to the observed meteorological series for 2018. The resulting scenario series thus retain the temporal sequence and characteristic pattern of the baseline year, while their level and variability are adjusted to correspond to the climatic conditions projected for the 2050 and 2085 horizons.
The climate series used for the Vrchlice Reservoir simulations are based on the HYMOD-KZ database [16], which provides selected hydrological and climatic variables for different SSP scenarios, climate models and time horizons. For the scenario simulations, mean daily air temperature series for the 2050 (2036–2065) and 2085 (2071–2100) horizons were used as inputs to the calculation of heat exchange between the water surface and the atmosphere. The aim was to assess the potential impact of climate change on the thermal regime of the reservoir. The SSP2-4.5 and SSP5-8.5 scenarios and the climate models CMCC-ESM2, EC-EARTH3, GFDL-ESM4, MPI-ESM1-2-HR, MRI-ESM2-0, TAIESM1 and ALADIN-CLIMATE/CZ were selected for the analysis (mean daily air temperatures are shown in Fig. 6). The year 2018 was selected as the reference year, against which the adjusted temperature series for the future horizons were subsequently compared. A comparison of mean daily air temperatures for the 2050 horizon under the SSP5-8.5 scenario for all the models listed above with the reference year 2018 is shown in Fig. 7.
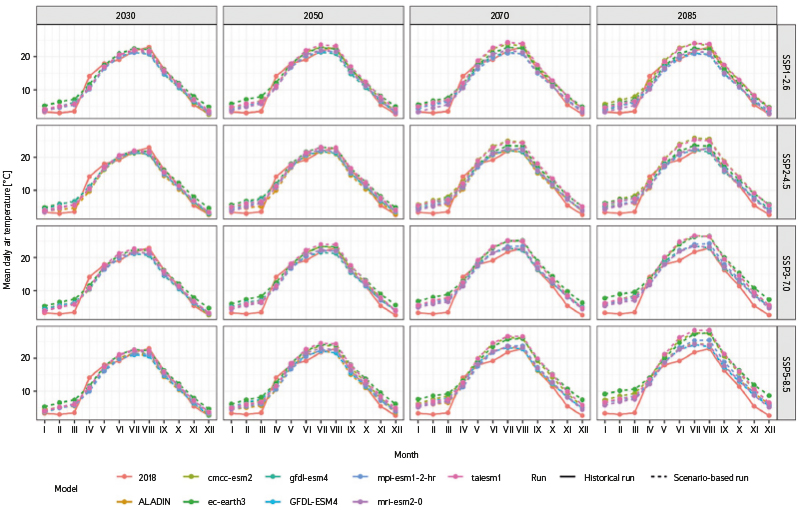
Fig. 6. Monthly mean daily air temperature for the available climate models, scenarios, and time horizons; 2018 represents the reference series
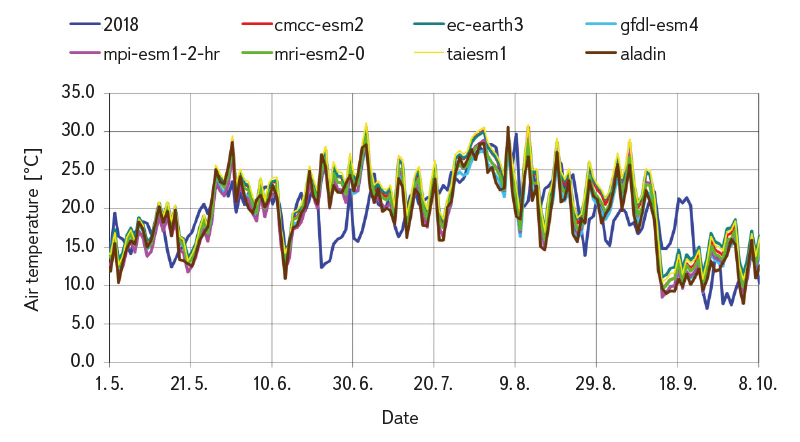
Fig. 7. Comparison of simulated mean air temperature time series from May to early October 2050 under the SSP5-8.5 scenario for all models listed above with 2018 as the reference year
As shown in Fig. 7, the individual climate models provide relatively similar projected mean daily air temperature patterns for the 2050 horizon, although these differ from the pattern observed in 2018, which included, for example, a relatively cold second half of June and, conversely, high temperatures around 20 September.
Results of simulations of the potential impact on the thermal regime
Because the projected mean daily air temperatures for the selected horizons and scenarios showed a similar seasonal pattern across the climate models, the averages of the results from the seven-model ensemble are presented below for clarity. For the subsequent presentation, results for the segment located 200 m upstream of the Vrchlice Reservoir dam were selected, i.e. close to the drinking-water intakes located within the dam structure. The model calibration results showed sufficient agreement between the measurements and the simulated temperature profile produced by the CE-QUAL-W2 model.
Fig. 8 shows the mean water temperature profile 200 m upstream of the dam for 2018 and the mean values obtained by averaging the water temperature results from simulations using the individual global models for the 2050 (MEAN 2050) and 2085 (MEAN 2085) horizons under the SSP2-4.5 scenario. Fig. 9 shows the increases in mean daily water temperature at this profile for the 2050 and 2085 horizons compared with 2018.
Figs. 10 and 11 were prepared in the same way, this time using the results of simulations for the SSP5-8.5 scenario.
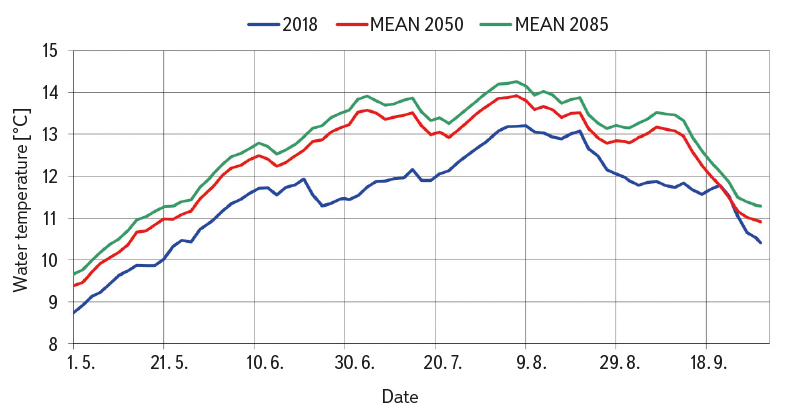
Fig. 8. Comparison of mean water temperatures at the profile 200 m upstream of Vrchlice Reservoir dam, based on the average results of simulations using individual climate models for the 2050 and 2085 horizons under the SSP2-4.5 scenario, with 2018 as the reference year
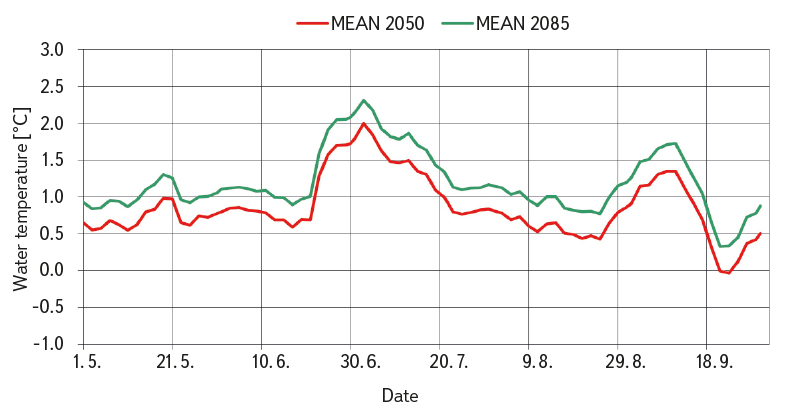
Fig. 9. Increase in mean water temperatures at the profile 200 m upstream of the Vrchlice Reservoir dam, based on the average results of simulations using individual climate models for the 2050 and 2085 horizons under the SSP2-4.5 scenario, compared with 2018
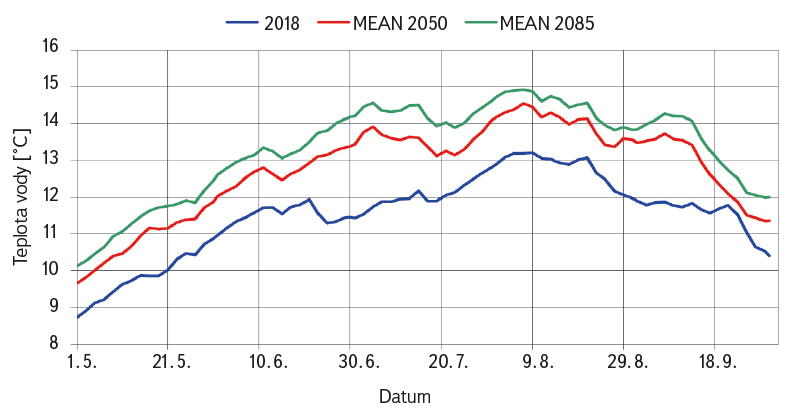
Fig. 10. Comparison of mean water temperatures at the profile 200 m upstream of Vrchlice Reservoir dam, based on the average results of simulations using individual climate models for the 2050 and 2085 horizons under the SSP5-8.5 scenario, with 2018 as the reference year
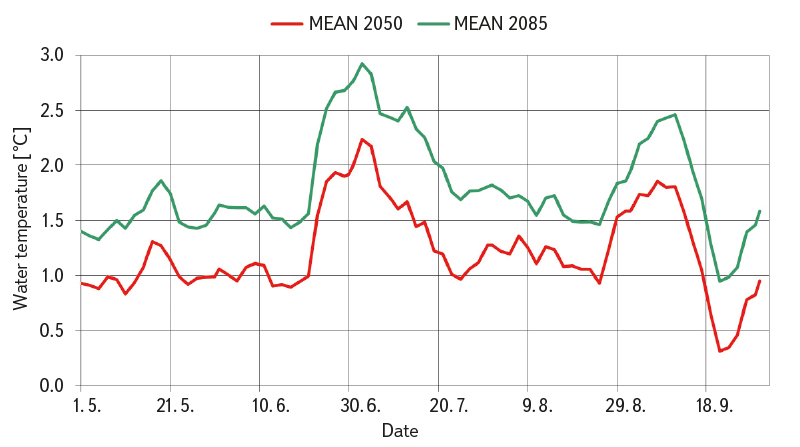
Fig. 11. Increase in mean water temperatures at the profile 200 m upstream of the Vrchlice Reservoir dam, based on the average results of simulations using individual climate models for the 2050 and 2085 horizons under the SSP5-8.5 scenario, compared with 2018
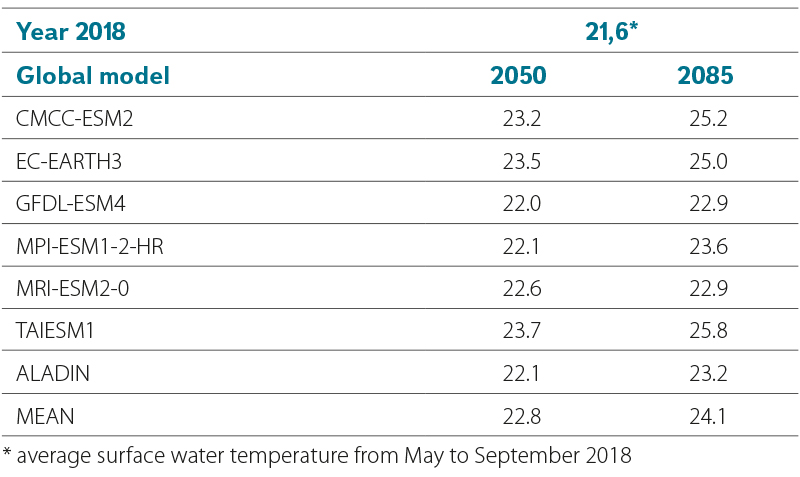
Another interesting output is a comparison of the mean maximum water temperatures occurring from the beginning of May to the end of September at the water surface in the profile 200 m upstream of the dam, based on CE-QUAL-W2 simulations for 2018 and for the 2050 and 2085 horizons under the SSP5-8.5 scenario, using the seven climate models and their ensemble mean (MEAN), as shown in Tab. 1.
Tab. 1. Average surface water temperatures from the beginning of May to the end of September at the profile 200 m upstream of Vrchlice Reservoir dam, based on simulations using the CE-QUAL-W2 model for the reference year 2018 and the 2050 and 2085 horizons under the SSP5-8.5 scenario, using seven climate models and their ensemble mean
Assessment of the results and discussion
The results of the simulations performed using the two-dimensional mathematical CE-QUAL-W2 model to assess potential changes in thermal conditions in drinking-water reservoirs confirmed the expected patterns.
For the SSP2-4.5 scenario, Fig. 8 indicates that, for the model year corresponding to the 2050 climate horizon, an increase in mean water temperature of approximately 0.5 °C can be expected in the area near the dam, where the maximum depths occur, with increases of up to 1.5 °C compared with the reference year 2018. For the model year corresponding to the 2085 climate horizon, the mean water temperature is expected to increase by at least 1 °C throughout the profile, and locally by more than 2 °C.
If the SSP5-8.5 scenario were to prove realistic, much more pronounced changes would occur. According to Fig. 10, for the model year corresponding to the 2050 climate horizon, the increase in mean water temperature would range from 1.0 to 2.0 °C, while for the model year corresponding to the 2085 climate horizon, it would range from 1.5 to 2.5 °C.
In addition to a sustained increase in mean water temperature in the reservoir, a significant increase in surface water temperature can also be expected, as shown in Tab. 1. Surface water temperatures may increase by more than 1 °C on average by the 2050 horizon compared with 2018, and by as much as 2.5 °C by the 2085 horizon.
The observed increase in water temperature may also have implications for the oxygen regime of the reservoir. A long-term analysis of temperate lakes, in which J. Hejzlar was also involved, demonstrated a widespread decline in dissolved oxygen concentrations; in deeper layers, this decline was associated primarily with increasing thermal stratification and declining water transparency. The issue of oxygen deficits has also been addressed under Czech conditions, for example in Římov Reservoir. In Vrchlice Reservoir, warming and a possible extension of the stratification period can therefore be expected to increase the risk of oxygen deficiency in the hypolimnion, with the specific response also depending on the trophic status of the reservoir, organic matter inputs and the hydrological regime.
In terms of the direction of change, the results are consistent with published studies that project increasing water temperatures and changes in thermal stratification in reservoirs and lakes under a warming climate [2, 3, 10]. Direct quantitative comparison with other reservoirs is, however, limited because the response depends on geometry, hydrological regime, water abstraction operations, meteorological forcing and the way climate scenarios are constructed. The values reported for Vrchlice Reservoir therefore cannot be directly extrapolated to other drinking-water reservoirs.
The differences in water-temperature increases between the 2050 and 2085 horizons cannot be interpreted as a simple linear translation of changes in air temperature into changes in water temperature. CE-QUAL-W2 calculates the overall heat balance at the water surface and the longitudinal–vertical distribution of heat; the resulting mean or maximum temperature is therefore also influenced by the seasonal pattern of the reference year, stratification, mixing, depth and outflow conditions. Moreover, the scenario series retain the temporal structure of 2018 and modify only air temperature. Non-linear differences between the selected summary indicators are therefore possible, but their physical interpretation must take these limitations into account.
The uncertainty in the results arises from several sources: the spread among climate models, the choice of the exceptionally warm and dry year 2018 as the stress-condition reference year, keeping the other meteorological variables and hydrological-operational conditions at their 2018 levels, the lateral averaging inherent in the 2D model, the aggregated representation of inflows, and the limited calibration and verification assessment without standard quantitative metrics. The results should therefore be understood as scenario-based estimates of the sensitivity of the thermal regime to changes in air temperature, rather than as a deterministic prediction of future conditions.
CONCLUSION
Numerical simulations showed that, with the hydrological-operational conditions of the 2018 reference year kept unchanged, increases in air temperature under the climate scenarios considered would lead to warming of the water both in the area 200 m upstream of Vrchlice Reservoir dam and at the water surface. Under SSP2-4.5, an increase in mean water temperature of approximately 0.5 °C was simulated for the 2050 horizon, with local increases of up to around 1.5 °C, while for the 2085 horizon, the increase was generally at least around 1 °C and locally exceeded 2 °C. Under SSP5-8.5, the changes were more pronounced, ranging from approximately 1.0 to 2.0 °C for the 2050 horizon and from 1.5 to 2.5 °C for the 2085 horizon. The average maximum surface water temperature from May to September increased from 21.6 °C in the reference year to 22.8 °C for the 2050 horizon and 24.1 °C for the 2085 horizon and the global model ensemble mean under the SSP2-8.5 scenario.
The practical significance of the study lies in highlighting that warming may alter temperature conditions in the area of the drinking-water intakes and increase the risk of unfavourable oxygen conditions during the stratified period. The results can serve as a screening-level basis for the reservoir operator and for further analyses of operational options, particularly in relation to the choice of intake level and the assessment of water quality.
Interpretation is limited by the fact that the scenarios isolate the effect of changes in air temperature while other meteorological and hydrological-operational inputs are kept at their 2018 levels, the model uses lateral averaging, and the calibration and verification results were not quantified using standard error metrics. Further work should use a broader set of measurements, including those from 2024, carry out quantitative validation and sensitivity analysis of model parameters, incorporate changes in other meteorological and hydrological variables, and separately assess scenarios involving changes in water level and intake levels.
Acknowledgements
This paper was produced with the support of the Technology Agency of the Czech Republic (project No. SS02030027, Water Systems and Water Management in the Czech Republic under Climate Change Conditions, 2020–2026). The topic was addressed under Partial Objective 3.4, Changes in the operation or expansion of the storage capacity of existing water or dry detention reservoirs.
The Czech version of this article was peer-reviewed, the English version was translated from the Czech original by Environmental Translation Ltd.
