ABSTRACT
Agriculture is the world’s main freshwater consumer; it also contributes to its contamination through fertilizers and pesticides. This article focuses on the grey water footprint (GWF) as an environmental indicator assessing the impact of agricultural production on water resources. The study analyses the GWF of malting barley production on an area of 9,674 ha in different regions of the Czech Republic. Special emphasis is placed on including pesticides in the GWF calculation, as their impact on freshwater ecosystems and human health may exceed the impact of fertilizers. The analysis shows that insecticides have the highest GWF, especially deltamethrin, whose GWF is an order of magnitude higher than that of other agrochemicals. The study highlights the importance of including pesticides in future GWF assessments to better assess the environmental impacts of agricultural production and optimize sustainable water resource management strategies. At the same time, the study discusses different approaches to including biologically active substances in grey water footprint models.
INTRODUCTION
Agriculture is the largest consumer of freshwater in the world, accounting for approximately 70 % of total water resource consumption [1, 2]. Intensive agricultural practices, including the excessive use of pesticides and fertilizers, have a significant impact on aquatic ecosystems by leaching excessive amounts of these substances into the aquatic environment. Leaching of nutrients, especially nitrates, into groundwater often contributes to exceeding permitted limits for drinking water. In surface waters, elevated nitrate concentrations promote the growth of phytoplankton, dominated by algae and cyanobacteria. These reduce the dissolved oxygen in water and consequently lead to hypoxia or anoxia (process of eutrophication). These changes cause a loss of biodiversity and can lead to massive mortality of some aquatic organisms [3].
Pesticides, which are applied to protect crops from pests and diseases, leach into soil and water bodies, where they can threaten aquatic ecosystems and human health. Long-term exposure to these substances has been linked to endocrine system disruption, increased risk of cancer, and other health problems [2]. Water contamination by pesticides is particularly problematic due to the persistence of some of these substances, their ability to spread in the aquatic environment, and effect areas at high distances from sites of their application.
Various methods have been developed to quantify the environmental impact of agriculture, including the ecological footprint [4], the nitrogen footprint [5], and the water footprint, specifically the Grey Water Footprint (GWF) [6, 7]. The water footprint [8] consists of three components. The blue and green water footprints represent the physical volume of freshwater consumed for production. Consumption refers to the unavailability of the consumed water to other users in a given catchment and within a given period of time; this distinguishes the water footprint from other environmental indicators that reflect any water use, regardless of its availability to other users. The grey water footprint represents the theoretical volume of water required to dilute pollutants entering water to a level that meets the water quality standards in the recipient at a given location. It also represents the “consumption” of water, as a given volume of water is no longer available to dilute the same pollutant. This indicator allows an assessment of the level of water resource pollution and provides a basis for decision-making on sustainable water use.
The GWF calculation in this study focuses on identifying the amount of water needed to dilute the pollutants, mainly nitrogen, phosphorus, and pesticides, used in malting barley production in the Czech Republic. Previous studies have focused mainly on fertilizers when calculating the grey water footprint of crops, while the impact of pesticides was/and is often underestimated.
Nutrient runoff into surface waters leads to eutrophication and subsequent deterioration in water quality [9]. Nitrogen is highly mobile and its presence in surface and groundwater can cause significant ecological problems. The lack of data on the persistence of pesticides in the aquatic environment and their cumulative impacts on ecosystems makes it difficult to accurately quantify their contribution to GWF. However, a recent study by Yi et al. [10] and this study highlight the need to include pesticides as their environmental impact can be much more significant than that of fertilizers.
In areas with limited water resources and vulnerable ecosystems, the negative impact of contamination may be more pronounced than in regions with a higher capacity of natural systems to dilute pollution. Therefore, monitoring and reducing GWF is of critical importance not only for agriculture but also for downstream industries that use agricultural products as feedstock, such as the food and beverage industry. Quantification of GWF [11] allows the identification of critical points in the supply chain and in the production process. GWF assessment in barley production thus provides important information for environmental policy, agricultural practice, and the downstream food and beverage industry. This approach allows for a more efficient use of water resources and minimisation of their pollution, as well as environmentally sustainable production of food, beverages, and other agricultural products.
The methodology used provides a comprehensive approach to calculating the GWF of malting barley and allows a detailed analysis of the impact of agricultural production on water resources. The results of the study may be key to the design of more sustainable agricultural practices and better management of aquatic ecosystems. GWF monitoring and optimization is an important tool for farmers, industrial producers, and environmental policy makers to minimize negative environmental impacts and increase the efficiency of water resource use.
Methodology and data sources
This study focuses on the GWF analysis of malting barley grown on an area of 9,674.05 ha in different parts of the Czech Republic, specifically in the districts of Bruntál, Frýdek-Místek, Hodonín, Jeseník, Karviná, Kroměříž, Nový Jičín, Olomouc, Opava, Ostrava-city, Prostějov, Přerov, Rychnov nad Kněžnou, Semily, Svitavy, Šumperk, and Ústí nad Orlicí. To calculate the GWF of malting barley production, detailed data on fertilisers and pesticides used were obtained directly from growers supplying malting barley to Radegast Brewery. A questionnaire was prepared to collect the data, and Radegast Brewery representatives arranged for their suppliers to complete it. The collected data were provided to the study authors in aggregated form, i.e., as an average amount of applied substances per hectare of cultivated area.
The questionnaire survey focused on detailed information on the types and quantities of fertilisers and pesticides applied in the cultivation of malting barley. Based on the products used and their volume, the amount of active substance applied was determined.
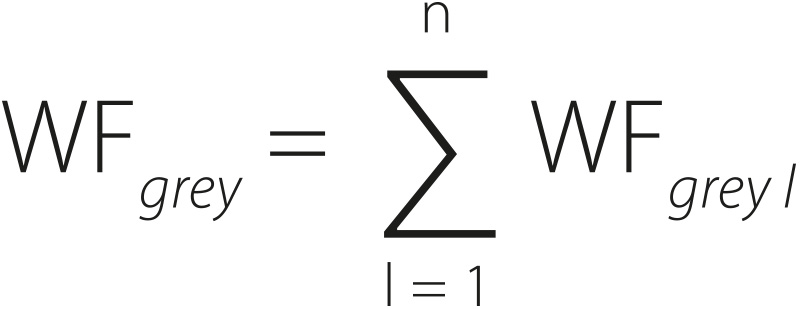
To calculate GWF in cubic metres per tonne of crop grown, the Hoekstra and Hung equations [9] and Water Footprint Assessment Manual [8] were used:
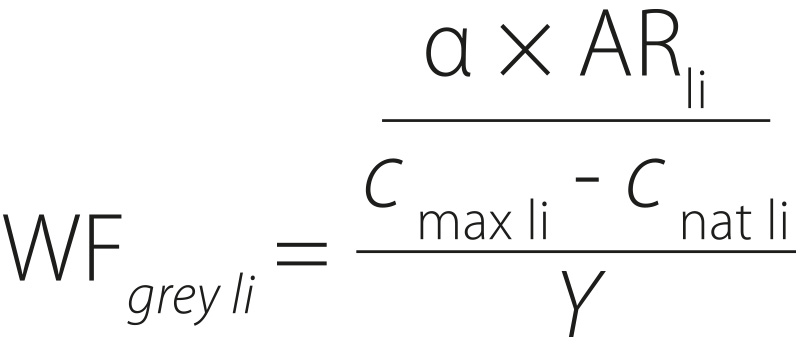
where:
α is is proportion of fertiliser and pesticide losses (%), the so-called leaching factor
AR amount of fertilisers and pesticides applied to each crop (kg/ha)
cmax critical concentration of the monitored substance from fertilisers and pesticides in the recipient (g/m3)
cnat natural (backround) concentration of the monitored substance from fertilisers and pesticides in the recipient (g/m3)
Y crop production (t/ha)
The average leaching factor α was determined based on the official Water Footprint Network methodology [12]. It has the following values: 0.1 for nitrogen fertilisers, 0.03 for phosphate fertilisers, 0.7 for potassium fertilisers, and 0.01 for pesticides. The leaching factor for pesticides was set at 0.01 due to the lack of detailed data on the soil properties at the monitored sites. The necessary data for calculating the regionalized α factor according to the methodology [12] were not provided.
The difference between the cmax and cnat represents the assimilation capacity of the watercourse. For nitrogen, phosphorus, and potassium fertilizers, the following assimilation capacity values were determined: nitrogen 3 g/m³, phosphorus 0.1 g/m³, and potassium 5 g/m³ [12]. For pesticides, the cnat value was set to zero, while cmax values were derived from the lowest Predicted No Effect Concentration (PNEC) freshwater values from the NORMAN database [13]. PNEC values are commonly used as cmax in wastewater GWF studies [14–17], and can also be used in calculating GWF of pesticides in agriculture [18]. The PNEC values used for this study are listed in Tab. 2.
Information on the malting barley Y production in the studied districts was provided by representatives of the Radegast Brewery based on information from a questionnaire survey among farmers. All data are valid for the reference year 2022.
RESULT
Tab. 1 shows the GWF values of different fertilisers applied to malting barley fields. The highest GWF values were found for phosphorus. Tab. 2 shows the GWF values for individual pesticides applied to malting barley fields. Insecticides reach the highest GWF values due to their high ecotoxicity to aquatic organisms. The insecticide deltamethrin has the significantly highest GWF, even at very low concentrations. The GWF of deltamethrin is an order of magnitude higher than the GWF of two other important insecticides (gamma-cyhalothrin and esfenvalerate), three orders of magnitude higher than the GWF of fungicides (prothioconazole), herbicides (2,4-D 2-EHE), fertilisers (phosphorus), and four orders of magnitude higher than the GWF of a morphine regulator (trinexapac-ethyl).
Tab. 1. Grey water footprint of nutrients – malting barley
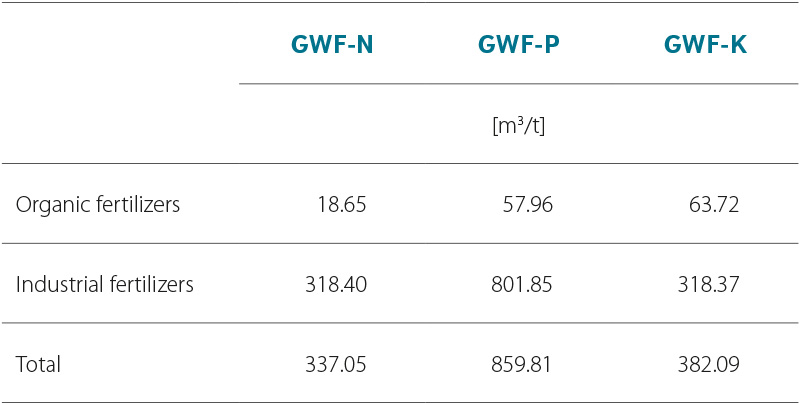
Fig. 1. Grey water footprint of nutrients – malting barley
Tab. 2. Grey water footprint of pesticides – malting barley
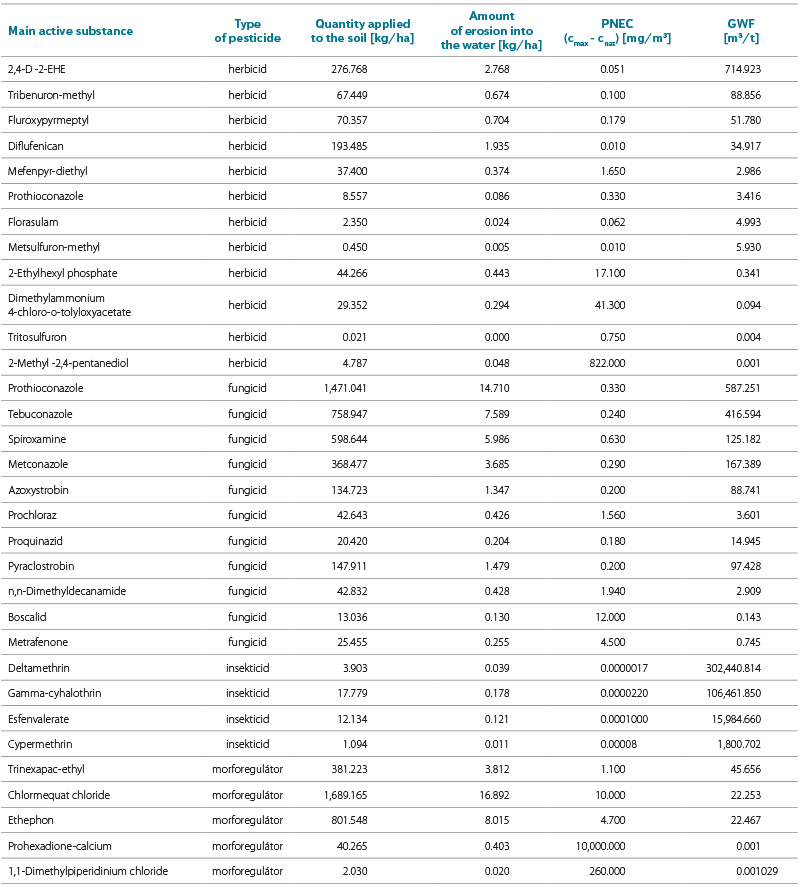
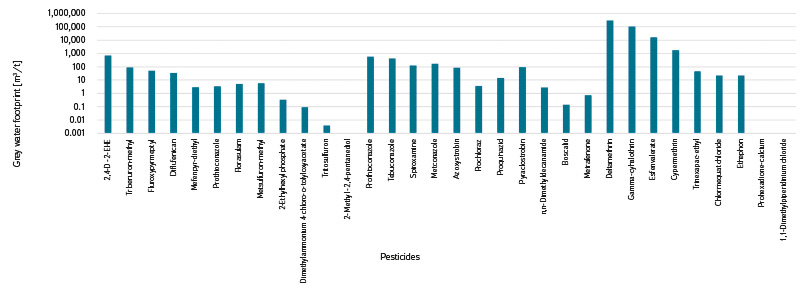
Fig. 2. Grey water footprint of pesticides – malting barley
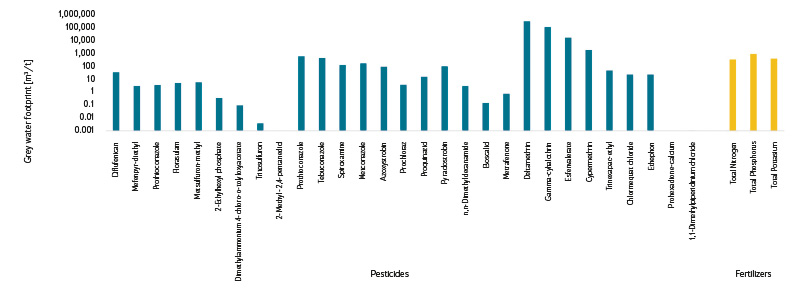
Fig. 3. Grey water footprint of malting barley production
Fig. 3 provides summary values of the GWF associated with fertiliser and pesticide use in malting barley production. Insecticides show the highest GWF values, which is related to their high ecotoxicity to aquatic organisms. Among them, deltamethrin dominates, with a GWF approximately one order of magnitude higher than the other two major insecticides (gamma-cyhalothrin and esfenvalerate). Also, it is three orders of magnitude higher than the GWF of fungicides (prothioconazole), herbicides (2,4-D 2-EHE), and phosphate fertilisers, and even four orders of magnitude higher than that of a morphoregulator (trinexapac-ethyl). Although only small amounts of deltamethrin have been applied, its overall impact on aquatic ecosystems is most significant. The total GWF associated with malting barley production amounts to 302,440.814 m³/t, with insecticides with the active substance deltamethrin accounting for the most significant part of the pollution.
DISCUSSION
While the application of fertilisers and pesticides has a noticeable positive effect on boosting crop yields, the massive use of these substances causes environmental contamination both locally and globally. Studies published to date have generally focused on GWF caused by fertilisers, which are generally used in large quantities. Pesticides have not been included in most studies, both because of their relatively small quantities (compared to fertilisers) and because of methodological issues associated with their inclusion in the GWF model.
Pesticides usually break down very slowly; their residues remain in agricultural soil for many years after application. Their negative effects on water quality are evident at significantly lower concentrations than those of nutrients. Humans exposed to water poluted with pesticide residues are at risk of diseases such as cancer, endocrine disruption, etc. Aquatic ecosystems are even more sensitive to the effects of these substances.
The results described above show that for a correct assessment of the GWF of crops, it is necessary to assess not only the GWF of fertilisers but also the GWF of pesticides. Based on current knowledge, crop GWF studies can no longer be considered representative if they only focus on the GWF of fertilisers. There is a need to compare the GWF of fertilisers with the GWF of pesticides in future crop GWF studies is evident. Without such a comparison, the results are incomplete and may be misleading.
On the other hand, it is important to note the possible limitations of our results. The first limitation is the application to a single crop species grown on 9,674.05 ha. The amount of fertilizers and pesticides applied and their composition vary depending on the crop grown, soil characteristics, as well as on management practices. These variable factors influence the GWF value, as demonstrated in the study by Borsat et al. [19]. The second limitation is the use of a constant leaching factor α, which is in accordance with TIER 1 according to Franke et al [12]. The use of a constant leaching factor α represents a certain simplification of the heterogeneous conditions prevailing in agriculture. Such a simplification is therefore appropriate for large-scale studies or, in the absence of basic data, for more detailed approaches to the expression of the leaching factor (TIER 2 or TIER 3). In our case, it was used due to the lack of supporting information for the application of a more detailed solution.
A final simplification that we used due to the lack of detailed data is the composition of the individual mixtures applied to each field within the study area. The data obtained from individual farmers and provided by the Radegast Brewery representatives only gave the total amounts of the product applied in the area of interest, not in particular fields. Therefore, we considered the application rate applied to the entire area of interest of 9,674.05 ha. The mixture of products shown in Tabs. 2 and 3 thus represents a kind of ‘common average mixture’ used in production.
The problem in determining the GWF of pesticides lies in the common application of pesticides in the form of mixtures of different active ingredients. All pollutants entering water from human activities are mixtures of several substances. The Water Footprint Assessment Manual [8] assumes that the individual substances in the mixture do not interact with each other, and the GWF is determined by the substance with the highest value. However, this assumption of the GWF model is often not met in reality. When different bioactive substances are mixed, they interact with each other, and their toxicity and impact on the receiving water body change depending on the mixture composition. Therefore, some researchers have proposed alternative approaches to address GWF mixtures.
One approach is to modify the GWF model. Paraiba et al. [18] proposed a model that assumes that the toxicity of a mixture is the sum of the toxicities of each substance in the mixture. De Lavor Paes Barreto et al. [20] compared such an approach with the original approach described in the Water Footprint Assessment Manual [8] and found that the model proposed by Paraiba et al. [18] is usually more precise. This is a logical conclusion, considering that in the model, each additional substance added to the model mixture will increase its toxicity.
Another approach to addressing mixtures is to include the self-purification capacity of the watercourse. For example, the GWF study on urban wastewater [21] identified ammonium nitrogen (N-NH4+) as the substance most often determining GWF. In rivers, ammonium nitrogen is rapidly oxidized to other forms of nitrogen, however, the Water Footprint Assessment Manual GWF model does not account for this fact. Therefore, some researchers include the self-purification process directly into GWF models [22, 23].
A yet different approach to addressing GWF of mixtures can be found in the L’Oréal product eco-design article [24]. Their methodology is based on the use of techniques used in LCA, i.e., on the principle of additivity of the effects of each component in proportion to its concentration in the formula.
The above-mentioned uncertainties of the solution, as well as the different approaches to GWF by different authors, highlight the need for further research on GWF. In our view, this research should focus on three areas:
The first area is the identification of substances that may determine GWF. Our studies of malting barley GWF (this paper) and micropollutants in treated urban wastewater [14] have shown that commonly monitored pollutants may not be (and often are not) the most critical ones for GWF determination. Thus, the selection of non-representative pollutants leads to a systematic underestimation of GWF values. A number of research studies in different water-related fields are needed to find relevant pollutants for different sectors and water uses.
The second area deals with mixtures in GWF models. On the one hand, the “independence” of the water footprint values from external influences must be maintained. The water footprint is one of the environmental indicators that describes the behaviour of the assessed system. An indicator whose value would change without changing the assessed system itself is not well set. On the other hand, issues related to new, so-called emergent pollutants, which are often bioactive substances and behave differently in different mixtures, need to be adequately addressed.
The third area where we consider the current state of knowledge to be incomplete is in assessing the GWF sustainability. We do not consider approaches that introduce a self-purification process into GWF models to be appropriate practice. The self-purification capacity of the aquatic environment is independent of the product systems assessed by GWF. Therefore, the water self-purification capacity should not be included in a GWF model. A modification of the sustainability assessment seems to be a more appropriate solution. The current system, described in the Water Footprint Assessment Manual [8], compares GWF values with available sources to dilute pollution using actual runoff from the catchment. Thus, this approach compares the runoff in a particular catchment with the dilution water needs in different parts of the assessed catchment. This can lead to an overestimation of the discharged pollution impact due to the neglect of the self-purification capacity in the aquatic environment.
CONCLUSION
This study confirmed that GWF is an important indicator for assessing the environmental impacts of agriculture, and that all applied substances, i.e. not only fertilisers but also pesticides, should be included. In malting barley production, the insecticide deltamethrin had the greatest impact on water resources. Due to the high ecotoxicity of pesticides and their long-term persistence in aquatic ecosystems, it is important that future studies include a detailed analysis. Local conditions such as climatic factors, soil types, and water availability must be considered in GWF assessment. The implementation of measures to reduce GWF, such as optimising the use of agrochemicals and innovative technologies in agriculture, can contribute significantly to a more sustainable use of water resources and environmental protection.
Acknowledgements
This study was created as part of a commercial contract with the Radegast Brewery. We would like to thank the representatives of Radegast Brewery for their help in obtaining input data for the study.
The article was supported by the funds of the Institutional Support within the framework of internal grants provided by the T. G. Masaryk Water Research Institute.
Declaration of conflict of interest
The representatives of Radegast Brewery and the related companies had no influence on the results of the study. The second author is part of the TGM WRI management, which publishes the VTEI journal, and chairman of the VTEI journal editorial board. However, these facts had no influence on the support provided for the writing of the article or on the acceptance of the article for publication in the VTEI journal.
The Czech version of this article was peer-reviewed, the English version was translated from the Czech original by Environmental Translation Ltd.
