ABSTRACT
Acquisition of primary spatial data (geodata) in the form of a field survey (i.e. direct contact of the surveyor with the observed object or phenomenon of the real world) can undoubtedly be described as the most demanding method of their acquisition in terms of time and financial costs. However, in the past ten years, there has been a sharp turnaround in the field of mobile mapping. With the introduction of smartphones and laptops (tablets), countless applications for field data collection have been developed. Combined with Open Source tools, mobile data collection activities have become widely available to both professionals as well as the general public. One of these applications is QField. It is a multi-platform mobile GIS designed primarily for Google Android, Apple iOS, and Microsoft Windows platforms. Its user interface is strikingly similar to that of the QGIS desktop app, giving the false impression that the mobile app is part of it. However, it is stand-alone software developed by an Open Source solutions group, OPENGIS.ch, whose compatibility with the desktop application is ensured by another element, a plugin.
The aim of this paper is therefore not only to introduce the reader to some of the functionalities of this mobile application, including its advantages and pitfalls, but also, and most importantly, to critically evaluate its usability in practice. This is done by combining the experience of other authors of case studies with our own experience, gained in the performance of tasks arising from the activities of T. G. Masaryk Water Research Institute.
INTRODUCTION
The QField application, intended for mobile mapping of objects and real-world phenomena (collection of spatial data directly in the field via a mobile device), ranks among typical representatives of Open Source Software (OSS). It is distributed under the GNU Public Licence (GPL) version 2 and above [1]. This means that under this licence, the application can not only be used for free, but its source code is also freely available, which can be further modified (which greatly strengthens the user’s control over running processes). Closely related to this is the expansion of software configuration options and partial functionalities; in this way, even more specific user requirements for the final product can be met with zero or completely minimal costs for acquisition or operation.
As for the other indisputable advantages resulting from the OSS principle, we must emphasize the strong support of the user community in the form of educational videos placed, for example, on YouTube or user discussion forums (Github, Stack Overflow, Reddit, etc.). OSS are also characterized by being multi-platform or having the ability to run the required process on more than one platform (in the sense of operating systems or hardware platforms). However, in the case of multiplatform software, it cannot be automatically assumed that the software will work on all available platforms [2].
QField is currently available for:
- Google Android platforms – recommended version 9 and above
(https://play.google.com/store/apps/details?id=ch. opengis.qfield), - iOS (https://apps. apple.com/app/ qfield-for-qgis/id1531726814),
- Microsoft Windows (https://qfield.org/get_latest/?platform= windows).
- Other platforms are only available in the beta version, e.g. Linux
(https:// qfield.org/get_latest/?platform=linux) and MacOS (https:// qfield.org/get_latest/?platform=macos) [3].
Usually, easy data transfer is ensured, i.e. data storage usually in open formats. In the case of QField mobile GIS, the data formats of the QGIS and GDAL data providers are supported. The most common formats are Geopackage, Shapefiles, MBTiles, TIFF, JPEG2000, or specifications or standards created for the needs of GIS technologies and interoperability – WMS, WFS, Simple Features for SQL (however, this list is far from complete).
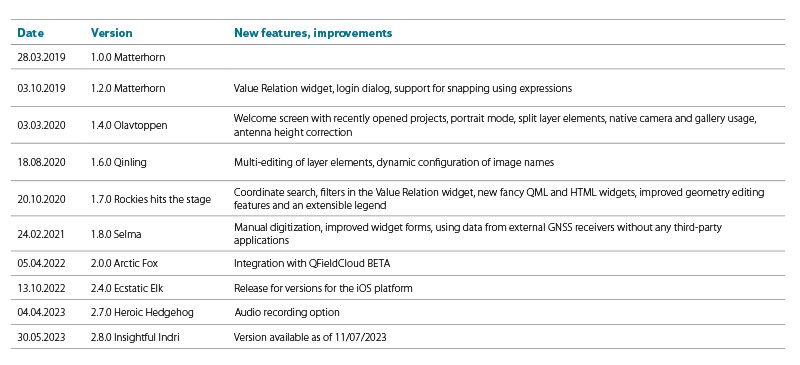
The application is developed using programming languages C++, QML, Java, Perl, and Shell scripts. A brief history of its development is shown in Tab. 1. However, not all versions of the application are listed here, only those with major changes [1].
Tab. 1. QField mobile app development history as of 2019 [4]
The use of the mobile application must be preceded by the preparation of its environment. This phase includes several sub-tasks, such as selection of background maps, addition of other thematic layers that are necessary for the needs of the field data collection itself, setting of their symbology and labels of their elements; last but not least, there is creation of the target layer (or layers), to which new records will be collected. Functionalities that can be used for individual actions will be described in detail below. First of all, it should be emphasized that for these purposes it is more than appropriate to use the QGIS desktop application environment and tools, for several reasons. The first and most important argument is the high compatibility of both software. This is mainly caused by the fact that the developers of the QField mobile application used the same libraries (summary of procedures, functions, constants, and data types) that QGIS uses. From the point of view of basic data manipulation, whether previous or subsequent, this solution appears to be very practical. Another reason for this connection is the interlacing with other geotechnologies. These can be, for example, data management and data storage systems – PostgreSQL, SQLite and their extensions for supporting geographic objects (PostGIS, SpatiaLite) or tools for providing geodata (GeoServer, QGIS Server) (Fig. 1) [5].
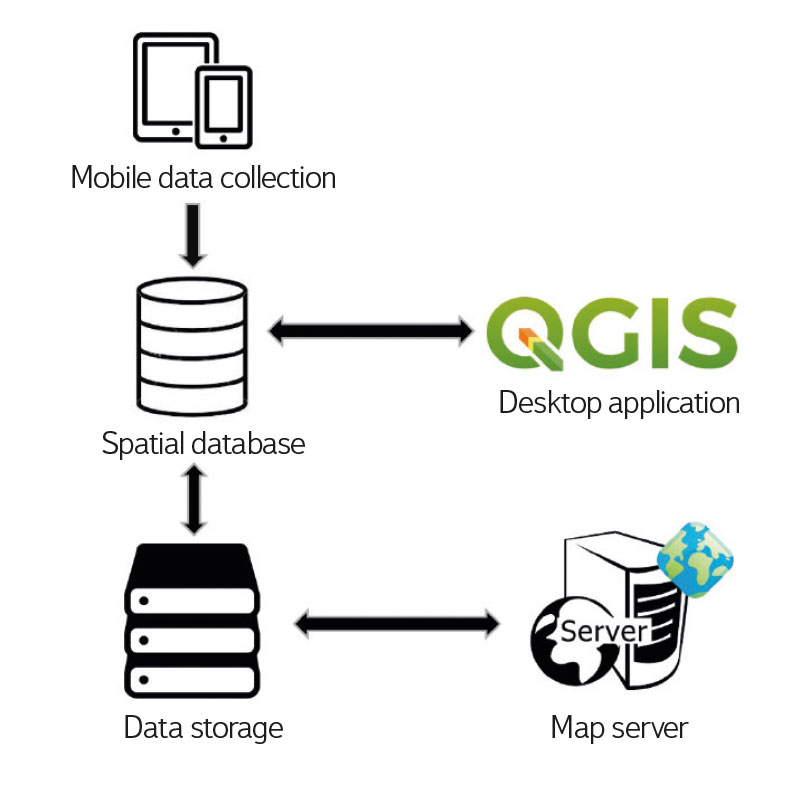
Fig. 1. Linking the mobile application with other geotechnologies
For custom data transformation between desktop and mobile application (and reverse synchronization of changes), the QField developers created a plug-in to QGIS QFieldSync. This is available in the plugin repository and can be installed in QGIS directly via the Plugin Manager. The project in compressed *.qgz format prepared in the desktop application environment contains information about the configuration of individual layers and background maps. Before data transformation itself, the project must be converted to XML format *.qgs, which is compatible with the requirements of the mobile application itself. Thanks to the plug-in module, everything (project and input data) is stored in one folder, which is transferred to the mobile device. The transfer is provided in two ways; from the repository or using QFieldCloud (Fig. 2) [1]. During application testing, the fee was set for his service, so we were forced to proceed with manual import (until an adequate equivalent cloud or other solution is found).
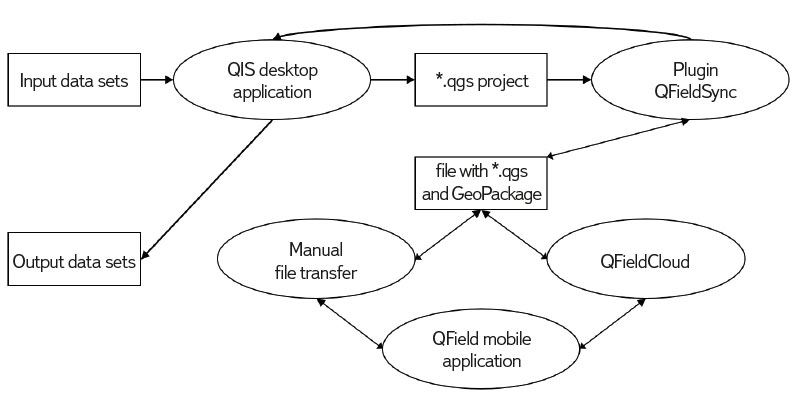
Fig. 2. Data transformation between desktop and mobile application
An acceptable solution to this problem appears to be the use of the PostgreSQL database system connection and its extension for spatial data, PostGIS. The solution methodology proposed for mobile mapping of the road cadastre inventory of the city of Piacenza in Italy seems quite promising. Even though it is built exclusively on free and Open Source Software without the QFieldCloud service, it complies with official national requirements [12, 13]. The basic principle is the correct setting of the configuration file pg_service.conf. Thanks to this connection, online data availability is ensured and one of the limiting factors – the memory capacity of the mobile device – is eliminated, especially when taking more extensive photo documentation or when using multiple background maps [1].
PREPARATION OF WORK AREA
The initial phase of the process includes the configuration of input data, i.e. not only background data (raster and vector), but also empty data sets into which new information about the object of interest of data collection will be collected.
In the case of background vector layers, the main things to deal with are their symbology, adjustment of the displayed legend, visibility in individual display scales, and labels of elements (Labels). In the QGIS environment, all the mentioned attributes are configured in the layer properties (Properties > Symbology). As for the underlying raster layers, there are two options. The first is the use of already prepared XYZ tiles – OpenStreetMap, Google Maps (e.g. satellite images are very often used), Mapy.cz, etc. If the users require their own specific background data, they must be processed into the project in MBTiles format (Processing Toolbox > Raster tools > Generate XYZ tiles /MBTiles/). This format only supports tile data (both vector and raster). A spherical Mercator projection is required for their presentation. The files can be internally compressed and optimized, producing views that adhere to the MBTiles specification [6]. A typical example of the use of this format in our conditions is, for example, a background layer from processed remote sensing data or reference map materials of the State Administration of Land Surveying and Cadastre (Basic maps, Orthophoto maps).
For empty data sets, in addition to the basic configuration of their styles, their data model is also set – in simple terms, requirements for the form and range of information about the object of interest. The data model must be defined before the start of the collection – its modification during collection is undesirable and (during subsequent synchronization) will often cause terminal complications, making subsequent geoprocessing impossible. Data layers populated through a mobile application are vector by default. It always depends on the user’s intent; only the basic geometry types are available, i.e. point, line, and polygon.
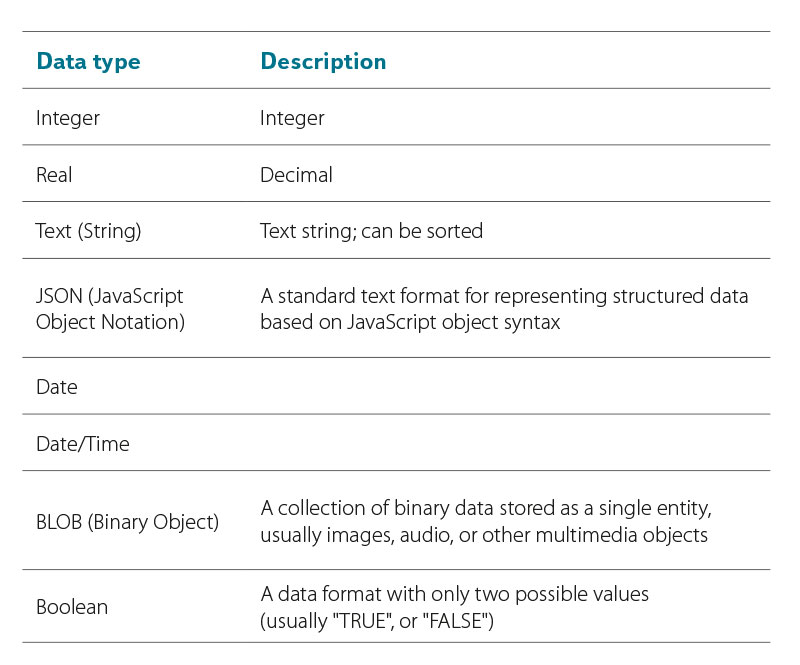
An indispensable base is the definition of the default attributes of the vector layer (their name and data type). The available data types vary according to the format specification. In QGIS, the data types listed in Tab. 2 are available.
Tab. 2. Examples of available data types [7]
Individual attributes behave differently depending on their type (numeric, text, etc.). A summary of the data types used for a specific vector data set can be obtained from the source fields tab in the layer properties (Properties > Fields). When editing, their limits should not be exceeded, e.g. string length, range of values, or entering an incorrect expression. The behaviour of attributes (both in the desktop and mobile application) can be regulated and further specified using the attribute form in the layer properties (Properties > Attributes Form). In general, the configuration of individual attributes could be divided into several sections, namely basic settings, widgets, restrictions, and default values (Fig. 3).
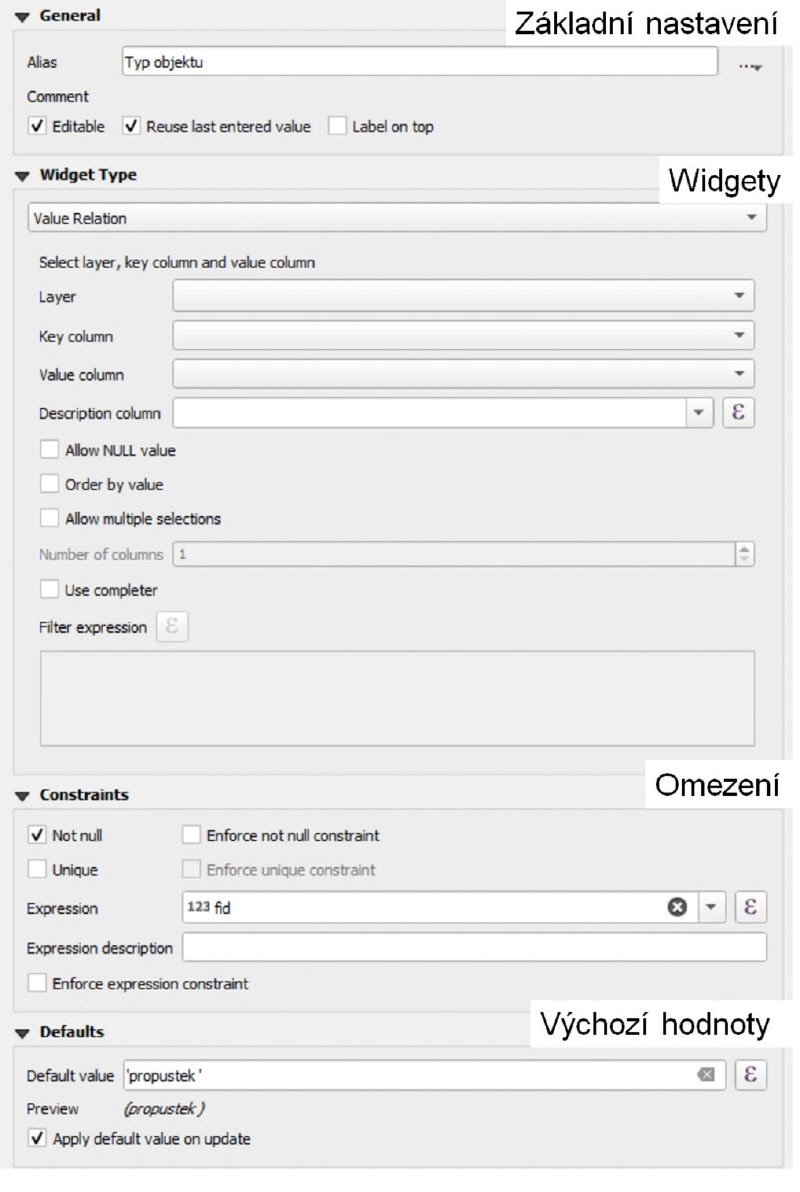
Fig. 3. Data layer attribute form
Basic settings
In the first section of the basic setting of the attribute (Fig. 4), the parameters for its display are dealt with, regardless of its data type. The Alias parameter adds a title to the attribute (without string length restrictions, with diacritics and spaces), which often makes it easier for the user to navigate, especially in the case of attributes with similar or unclear names. Another important parameter is the Editable checkbox. By default, editing the fields of this attribute is allowed. If the checkbox is unchecked, it is not possible to insert new data and edit existing data. A relatively useful function in the field of mobile data collection is remembering the last entered value (checking the Reuse last entered value checkbox).
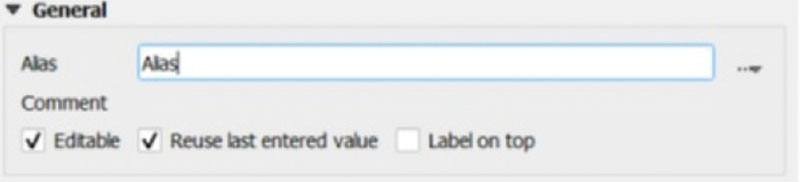
Fig. 4. Basic attribute settings
Widgets
Widgets allow you to configure specific forms with certain behaviour and appearance for different data types. In the following text, we will proceed from simpler to advanced variants of widgets.
The simplest widget is Text Edit. It is the basic type of editing window for text strings, while the only alternative to its extension is the use of a multi-line variant (Fig. 5a). Selecting the Hidden widget hides the name and content of the attribute in the detail of the element. The Checkbox field (Fig. 5b) writes the values that will be checked into the attribute, while their definition is required in advance. Using a checkbox is convenient for deciding between two states. Through Unique Values, the content of the drop-down list is generated in the attribute (based on the values already entered), from which you can choose during editing. If this parameter is also set as editable (Fig. 5c), the inserted text will be automatically supplemented according to the possibilities of the drop-down list.
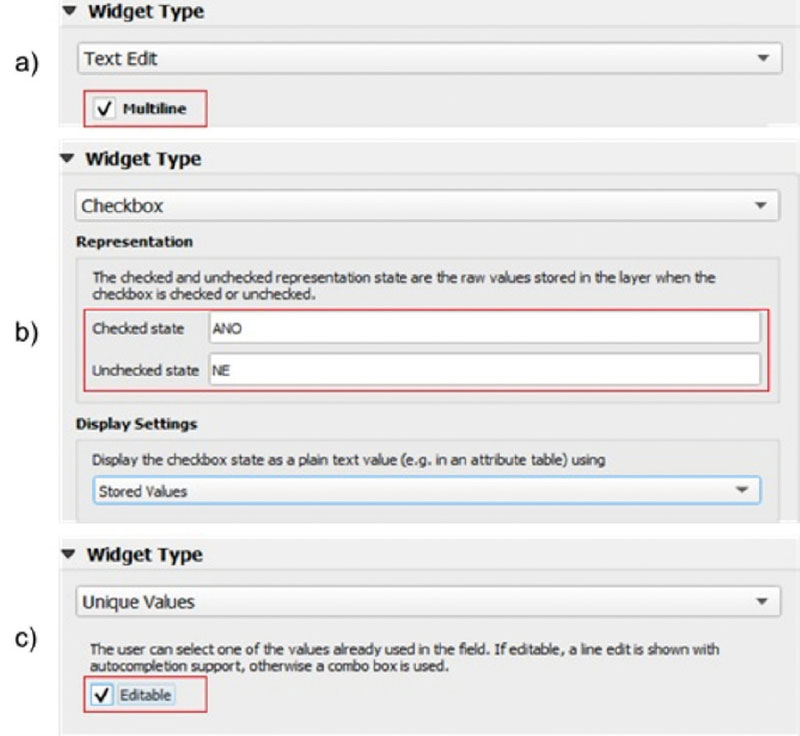
Fig. 5. Widgets – Text Edit (a), Checkbox (b), Unique Values (c)
For numeric data types, the permitted range of values (Range), i.e. minimum and maximum values, can be determined. It is possible to choose between a classic editable window and graphic tools, specifically a slider or a spin box (Fig. 6).
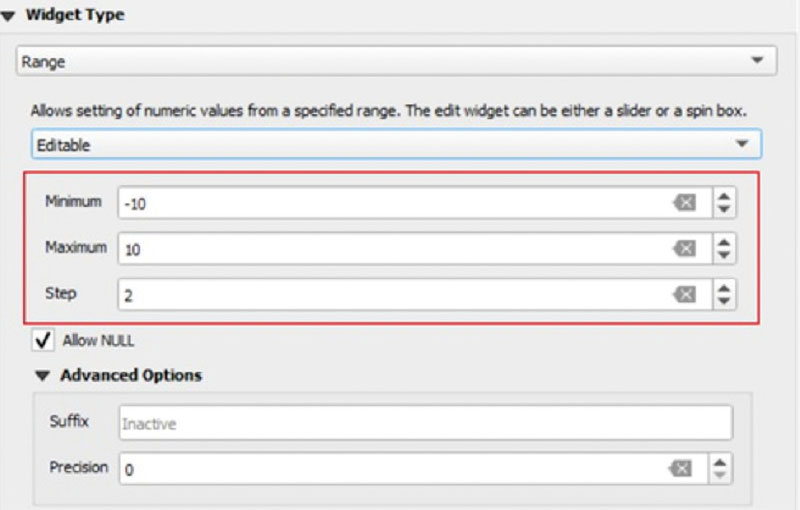
Fig. 6. Widgets – Range
Attributes containing Date or Date/Time can be inserted in many formats, or the user can insert their own format template. As for graphic elements, the attribute can be supplemented with a pop-up window with a calendar (Fig. 7), from which the desired data is subsequently selected.
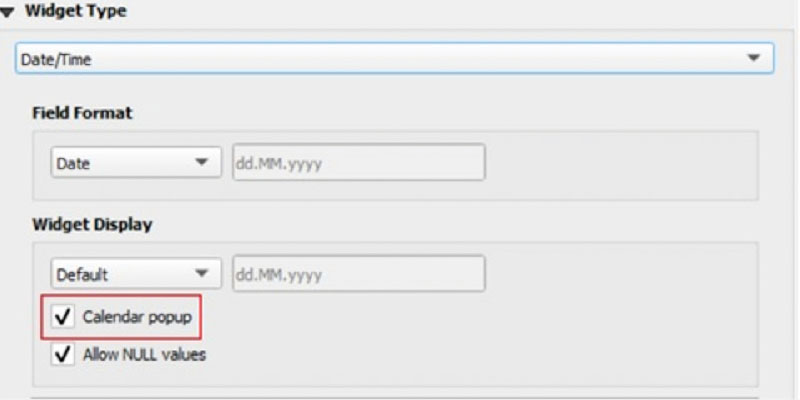
Fig. 7. Widgets – Date/Time
The Value Map widget could essentially be described as a domain or codebook. The attribute is edited by selecting values from the drop-down list (Fig. 8). Its items are inserted and edited directly in the widget settings. Two parameters are used for their definition – Value, Description; the description is used during editing, the value is displayed in the resulting attribute table of the layer. As for a more extensive codebook, there is an option to import it from a text file. It is also possible to import values from an attribute of another dataset.
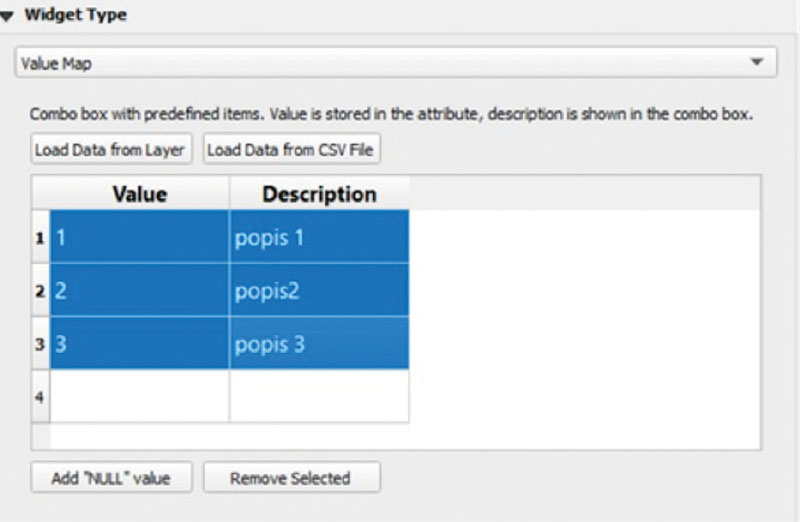
Fig. 8. Widgets – Value Map (domain)
The UUID generator (Universal Unique Identifier) is used exclusively by the data type. The text is filled in automatically. This is a unique identifier composed of a combination of letters and numbers.
A big trend in recent years is that multimedia files (e.g. photographs, audio recordings, and videos) are often attached to the collected attributes about the object of interest. In this case, it is advisable to use the Attachment widget. The attribute of the data type text string can contain an absolute or relative path to a file or a URL (Uniform Resource Locator), which can be displayed directly as a hyperlink based on this configuration. It is possible to set a preview for images and web pages. More about the possibilities of inserting multimedia files will be presented in the practical examples below.
Constraints
Constraints can affect the range of attribute values (Fig. 9). For example, the requirement to fill in the attribute (checked checkbox – Not null) ensures that the attribute is filled with data. If the attribute is not filled, the user is notified of this fact and the element record can be saved. In the event that the attribute values are strictly required by the user and it is necessary to prevent the storage of an empty attribute, the next level of this measure is to check the Enforce not null constraint checkbox. Checking the uniqueness of the record works on a similar principle (check boxes – Unique, Enforce unique constraint). Expressions can also be used to set controls for specified values. Based on predefined user-defined functions, expressions offer a powerful way to manipulate attribute value, geometry, and variables to dynamically change style, geometry, content, and more.
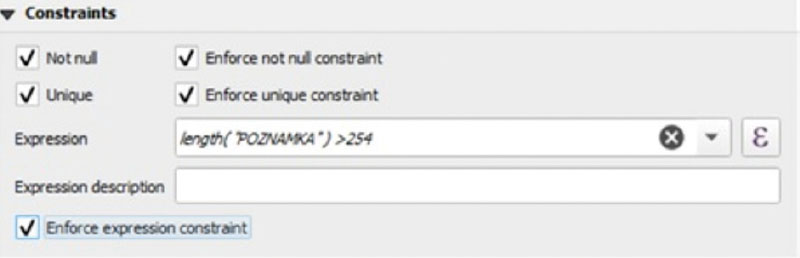
Fig. 9. Restriction of attribute values
Default values
The attribute default values configuration section (Defaults), if it is not underestimated, can represent a fairly wide range of actions during data collection – it is advisable to pay sufficient attention to it precisely in cases where the content of the attribute is determined by a rule. An example is the use of a so-called time stamp, calculation of the geometry of an element (length, area) or coordinates. Compound expressions (Fig. 10) are very often used to determine default values [7].
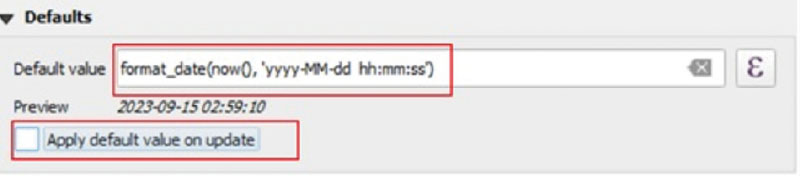
Fig. 10. Default value configuration example – timestamp
QFIELD MOBILE APP CONTROL
The control of this mobile application is intuitive – in the event that a carefully set project is already in the desktop application, there should be no complications when collecting data in the field.
The following text is dealing with the manual version of the project import used so far. After transforming the prepared project with the QFieldSync plugin (into the required format), the entire folder (uncompressed) is then moved to the storage of the mobile device (via a USB cable, Google Drive, Dropbox, etc.). It must have a specific location: <drive>:/Android/data/ch.opengis.qfield/files/ (this location is necessary to successfully run the project in the application). There can be multiple folders containing different projects – their number is limited only by the capacity of the user’s mobile device.
After starting the mobile application, the local file, the Imported projects folder is opened and after selecting the desired project, the appropriate project file is selected. After it is loaded, the data is displayed in a way that corresponds to its display in the desktop application. The contents of the project (map legend), including background maps, are called up by the main menu icon in the upper left corner. After double-clicking (or long-pressing on the required layer), a pop-up window will appear with a menu, thanks to which you can, for example, control the visibility of individual layers, show or hide element labels, expand or hide legend items, or zoom in on a given layer and display a list of all layer elements.
Digitization of new and adjustment of the position of existing elements in the field can only be started after switching on the editing mode in the main menu and after selecting the required vector layer. At the moment when editing starts, a crosshair appears in the middle of the map field, which must be set in the centre to the desired site. This can be done in two possible ways. The first is a manual site search according to the background map. The second approach, more often used to locate a point, uses the user’s location – it is important to have location permission on the mobile device for the application. Confirmation for creating a new element is the green “plus” button in the lower right corner of the map field. Subsequently, a field with predefined attributes will appear to be filled. This procedure of entering elements with “point” geometry is the basis for the creation of two others (line and polygon) when edges are formed between the entered vertices. The “minus” button in the lower right corner is used to cancel an incorrectly placed point. For these geometries, the element is terminated or cancelled with the icons at the bottom of the screen.
It is not necessary to be in edit mode to edit attributes. By double-clicking on the selected element on the map, its attributes are displayed. If there are multiple elements from other layers at the given site (overlapping), all of them will be listed in the menu. Then one or more elements can be selected. After this selection, it is necessary to press the icon for editing the attributes, then the required actions can be performed [1].
CASE STUDIES
QField mobile application for spatial data collection has found its application in many industries in recent years. The most numerous examples include archaeology, tourism, spatial planning, landscape design, and agriculture.
For example, it was deployed during data collection in an open area during an archaeological survey at sites near Rome, while the possibility of creating spatial queries from two or more tables was especially valued. Thanks to the minimization of the amount of stored data, the process of data collection in the field was significantly shortened [8].
German urban planners have also decided to deploy this application to document the state of urban structure for more effective planning. The collected data are further processed and made available in the ALKIS® information system through other Open Source Software (QGIS, PostgreSQL, and PostGIS). Due to the positive experience with 2D data, their next defined goal became the third dimension in terms of digital elevation models and 3D building models [9].
The possibilities of mobile mapping were also assessed by Romanian geographers who collected data on the movement of tourists in large cities (Oradea, Timișoara, Cluj, and Bucharest). In this study, several mobile applications were compared (QField, Geopaparazzi, and Survey123), while in the case of QField, the possibility of preparing dynamic forms and their flexibility according to user requirements were evaluated positively [10].
On the Pacific island of Tonga, an agricultural landscape was mapped using QField. The collection of data was characterized by a relatively large working group of acquirers; therefore, unlike the previous mentioned applications, no direct connection to the database system was used. The authors of the study describe in particular the advantages of using QFieldCloud (currently used for a set fee), consisting primarily of a simple way of unifying data collected by different groups at the same time. Only after this synchronization was the data forwarded to the database for further processing [11].
Within our organization, the application was deployed for the following activities:
Analysis of changes in the water regime of land and watercourses in Krkonoše National Park caused by the road network
The main goal of this project is to make it possible to analyse the influence of the road network (including related drainage facilities) on the water regime, especially on total runoff, in the entire area of Krkonoše National Park. QField was chosen for data collection in the field as part of the sub-goal – the creation of spatial datasets, which map in detail the road network in the national park, including related drainage facilities and also the network of watercourses of all orders. Basic requirements were the ability to collect data in parallel on multiple devices, the addition of multiple multimedia files to one element, and the presence of specific background data. Since the work on the project took place before a fee for the service was set, the unification of the obtained data was done through QFieldCloud.
Data models (Fig. 11) were designed for three point layers: objects for transferring water (culverts, fords, bridges, mountain inlets, etc.), characteristic points on the road network (road, forest road for wood removal /1L and 2L/, forest track /3L/, technological line /4L/, pedestrian path /technically modified/, footpath /trodden only/, boardwalk, etc.) and significant changes to the road network (beginning or end of the road, clear break in the vertical alignment or saddle, clear change of surface, change of longitudinal drainage, forest path equipment, obstruction/diversion of water inflow, etc.).
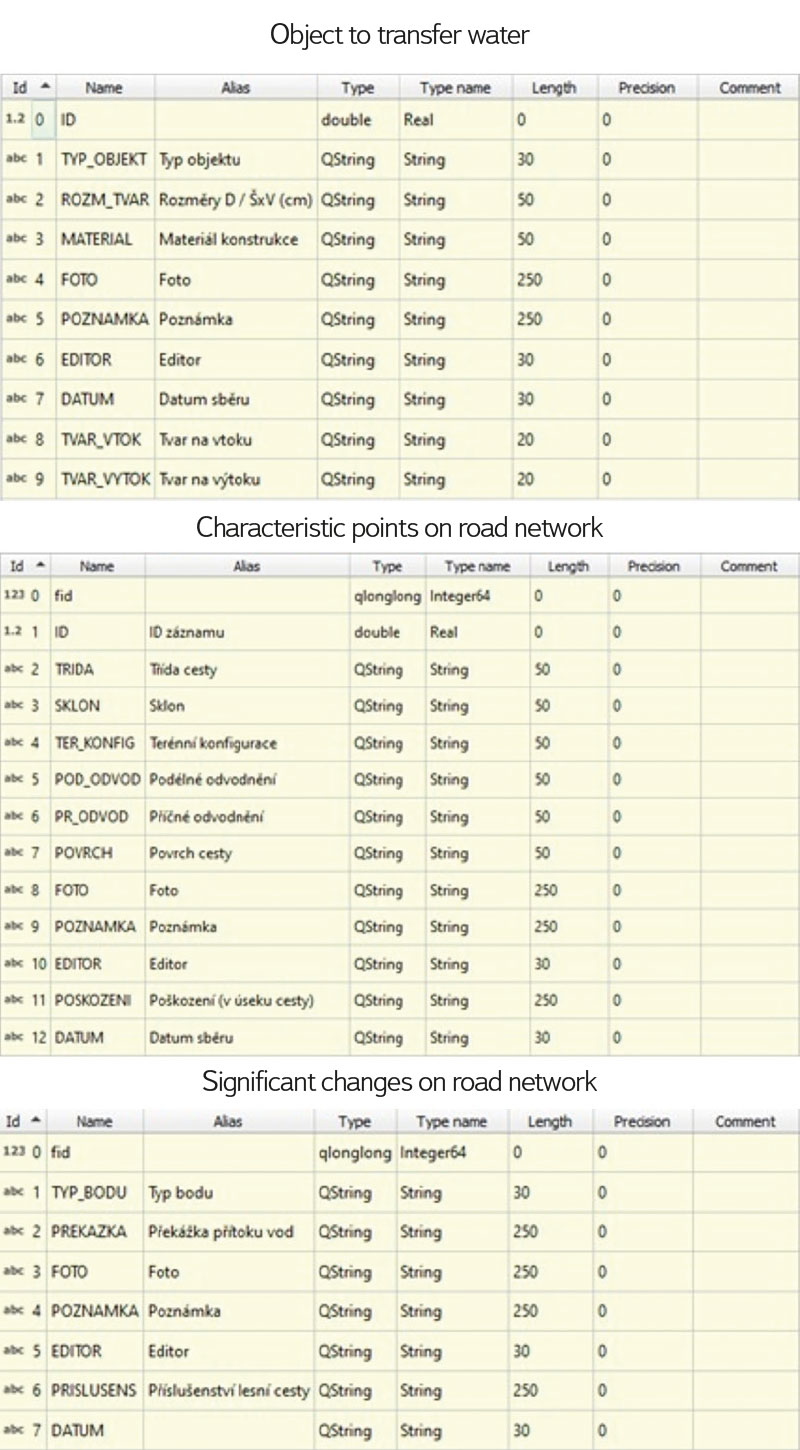
Fig. 11. Data models
During implementation of the field investigations, the data model was modified based on user requirements. It was therefore necessary to harmonize the resulting stages in the environment of the QGIS desktop application. Within Krkonoše National Park, around 2,000 point objects were mapped and described at four selected sites.
Creation and filling the register of all outlets on the Elbe watercourse from Brandýs nad Labem to Mělník – pilot project
The goal of this pilot project was to map wastewater outlets on a selected section of the important Elbe watercourse and identify the objects with existing records with the intention of obtaining an overview of registered and unregistered outlets. The contracting entities were the Ministries of the Environment and Agriculture.
Here, the mobile application played a completely different role than in the previous case. The task was to make the results of already conducted field data collection available to users of mobile devices (e.g. to verify the status of mapped objects). Unlike the parallel web map application, it was based exclusively on Open Source technologies (desktop application QGIS and its plug-ins, QField). It is therefore not about developing your own mobile map application, but about configuring a so-called project that is imported into the QField application environment and made available to users there.
During the actual project configuration, emphasis was placed not only on the appropriate setting of symbology and addition of other thematic layers, background maps and numerous photo documentation, but in particular on their linking, placement in directories, and conversion into a suitable format for import into the QField application. Currently, the application only displays the results of the field survey on the background map of aerial photography (Google Satellite – Google Maps) with the highlighting of water bodies and the addition of the names of some thematically important surrounding objects or, for easier orientation, on the OpenStreetMap basis. Due to the planned expansion of the mobile application use by the possibility of collecting new data, the imported package also includes an empty test layer with pre-prepared items and dials in which new records can be written. The content of the map application can also be supplemented with other vector and raster data sets according to requirements.
EVALUATION AND CONCLUSION
Testing of one of the many mobile applications for spatial data collection has been ongoing at TGM WRI since mid-2022. The reason for choosing a mobile application based on the principles of Open Source technology was mainly the fact that related segments of architecture (especially the QGIS desktop application) are already fairly widespread in the community of GIS users.
After initial difficulties, especially with the compatibility of ESRI product formats, which are still preferred within our organization, it was possible to achieve results in field data collection of comparable quality to the products of commercial providers of GIS tools. An essential milestone for testing the QField application was the end of the beta version and the subsequent set fee of the QFieldCloud service, which fully covered the requirements for collecting and backing up data taken by a large number of devices at the same time. Simultaneously, it was intended for relatively safe synchronization of the obtained data. Due to the uncertainty of whether enough potential users will be willing to include the new application in their activities, we decided on a temporary solution of manually moving the transformed data from the desktop application directly to the mobile device storage. In the future, we intend to respond to this situation in the form of our own cloud solution or a direct connection to a separate database.
Similar to other mobile GIS, the QField application has its limitations and pitfalls. For example, an unstable Internet connection significantly slows down the loading of background layers and increases the inaccuracy of the position of targeted objects (this can be eliminated by integrating a GNSS antenna or importing data from GNSS receivers). Another limitation is the impossibility of using WMS services when collecting data in the field. The application is quite demanding on the mobile device battery.
In any case, the above-mentioned successful deployments of the QField mobile application within the framework of two implemented orders demonstrate its high potential. It is an interesting possibility to use one of the many geoinformation technologies, with minimal costs for its acquisition and high flexibility in meeting user requirements.
The Czech version of this article was peer-reviewed, the English version was translated from the Czech original by Environmental Translation Ltd.
