ABSTRACT
This article presents an aerial delineation of small headwater catchments up to 5 km2 in the Czech Republic. The aim was not only to present the delineation of these catchments, but also their categorization in terms of the characteristics affecting the formation of direct runoff. Direct runoff caused by torrential rainfall is a very dynamic process of episodic nature and has a major impact specifically in small catchments. The delineation of small headwater catchments, where the aforementioned processes take place, can complement the standard hierarchical classification of basins in the Czech Republic. These basins make up 80 % of the Czech Republic.
The delimited catchments were further classified according to a number of characteristics related to the risk of direct runoff. A cluster analysis was performed in order to classify these catchments. The catchment characteristics that influence the hydrological response were included in the analysis. These are mainly rainfall data, hydro-morphological characteristics of the relevant basin, land use, and soil hydrological characteristics. One negative impact of direct runoff is erosion. Erosion monitoring can be indirectly used as an indicator of the state of a specific area in terms of the occurrence of direct runoff (https://me.vumop.cz). As part of this initiative, which completed ten years of operation in 2022, erosion events are recorded. The database contains more than two thousand records. However, the records within the Czech Republic are inconsistent, which is due to the involvement of branches of the State Land Office (Státní pozemkový úřad, SPÚ). However, it is a relatively extensive evidence of erosion.
INTRODUCTION
River catchments in the Czech Republic are divided into four levels by default. However, the smallest of them, the 4th order basins, are quite different in terms of size – from basins with a size exceeding 20 km2 to additional basins with an area of less than 1 km2. Fourth order basins were categorized in terms of their potential hydrological response according to the method described in [1]. Categorization of the 4th order basins in terms of hydrological response is influenced specifically by the different size of the area. Another factor is the combination of headwater (upstream) and flow catchments.
Upper – non-flow catchments form a specific group of catchments, sometimes they are called “first order catchments” [2], other times these catchments are referred to as headwater catchments. These catchments form the basis of the hydrographic network and are the primary areas for capturing or reducing flood damage. Simultaneously, these upper basins provide often diverse ecosystem services to the areas below them [3]. They tend to be very sensitive to changes and are the fastest developing parts of the landscape. For these reasons, planning and management within these areas is a complex task [4]. In the past, a number of authors dealt with the similarities, characteristics and response of basins from different points of view. For example, [5] are motivated to classify basins rather with regard to long-term processes in basins. on a similar principle, basin attributes are defined, classified and shared within CAMELS [6] and others. Data sets are created for basins that describe six main groups of attributes – topography, climate, hydrological characteristics, land cover, and soil and geological data.
There are relatively few verification data of the hydrological response in the Czech Republic. CHMI operates less than twenty observation profiles on small catchments of up to 10 km2. In addition, the creation of most of these basins was motivated by the monitoring of water in the basins of water supply reservoirs, and thus they are mainly forest basins. Geochemical monitoring of 14 small forest basins is dealt with by the GEOMON project [7]. It is focused primarily on the material composition of precipitation, soil and runoff, but it also records precipitation totals and flow values in the closing profiles. The monitored basins of GEOMON overlap in some places with the basins operated by CHMI. on agricultural land, the number of monitored basins operated by a professionally oriented organization is incomparably smaller, and the time series of data are also significantly shorter.
Practically the only tool for designing objects on small watercourses and modifications in the catchment area are hydrological models. They are most often based on the empirically derived SCS-CN method [8], which is constantly being developed and tested; from recent works, for example [9, 10]. The sensitivity of the method to available data for the Czech Republic was dealt with by Strouhal [11, 12]. By default, design data is provided according to ČSN 75 1400.2014. Hydrological data of surface waters. In the lowest class, which includes small catchments, data are also derived using a model based on the SCS-CN method. In addition to this regulation, TNV 75 2102 – Modification of streams from 2010 states that modelling can be used for proposals for modification of small watercourses in catchments of up to 5 km2. A boundary of 5 km2 was adopted for the derivation of the upper basins that this article is presenting. For a more detailed description of the runoff response, it is also possible to use physically based models such as SMODERP [13] and EROSION 3D [14].
A specific feature of small catchments is the speed of their hydrological response. The speed of response to causative precipitation and the associated risks are influenced by a number of parameters. The biggest threat in terms of flows and associated risks in these catchments is torrential rainfall. Kašpar [15] recently dealt with the distribution of precipitation in the Czech Republic.
The most frequently used tool for describing rainfall are IDF (Intensity-Duration-Frequency) curves, which describe the relationship between rain intensity, its length and recurrence time [16]. on a global scale, e.g. Courty [17] deals with the distribution of the above mentioned statistical attributes of rain. In addition to the intensity of the precipitation event, its shape also significantly affects the hydrological response at the local scale of small catchments [18, 19].
Other important parameters that influence the runoff response of individual basins include properties of soils, soil cover, and morphological characteristics. The properties of the hydrographic network, described by the number of coefficients, also play a role. The nature of the terrain – morphology – primarily affects the shape of the runoff wave, and thus the overall response of the basin to increased runoff, including soil erosion. There are several parameters for describing the morphology of the basin; the most frequently reported values are the average slope, the length of the slope, and the topographic index [20].
One of the negative impacts of the surface component of direct runoff is erosion. on the scale of source areas from 0.3 km2 to 10 km2, the so-called critical points are determined, which are defined as points of entry of concentrated runoff paths into the urban areas [21]. The critical points are determined on the DMR derived from the ZABAGED contour model and the risk rate is determined based on the ratio of arable land, average slope and using CORINE Land Cover. A different approach to the threat not only to the urban areas, but also to other elements of critical infrastructure was assessed within the project VG20122015092 – “Erosion – increased risk of endangering the population and water quality in connection with expected climate change” implemented in 2012 and 2015. The resulting map of points is available at https://heis.vuv.cz. In both cases, it is a certain view of the riskiness of the points, which is based on the characteristics of the contributing small headwater catchments, however, these are still model situations. Another perspective can be the recorded occurrence of an erosion event, which is part of erosion monitoring [22] and the map portal (https://me.vumop.cz/).
As part of this initiative, which completed ten years of operation in 2022, erosion events are recorded. The database contains over two thousand records. Although the records within the Czech Republic are spatially uneven, which is due to the involvement of branches of the State Land Office, it is nevertheless a relatively extensive record of erosion manifestations.
METHODOLOGY FOR DERIVATION OF CATCHMENT BOUNDARIES AND THEIR CLASSIFICATION
Small headwater catchments (SHC) [23] are so-called non-flow catchments that have no tributaries, and thus correspond to the definition of “first order catchments” [2]. This property was used in deriving their borders in the whole of the Czech Republic based on DMR 4G data at a resolution of 5 × 5 m [24], water courses and water reservoirs. The parameters that influence the hydrological response were subsequently determined for the areas of the basin defined in this way, especially with regard to the possible risk of runoff from short-term extreme rainfall.
Definition of catchment boundaries
SHC according to [23] are not only catchments with a size of only 5 km2, but also all smaller catchments. This means, for example, that two catchments with a size of 3 km2 after the confluence already exceed 5 km2, but separately they are two catchments that fall within the SHC. to define the SHC, six size categories listed in Tab. 1 were chosen. Basins have been derived for all these classes, which allows their further mutual comparison.
Tab. 1. SHC categories (a range of area sizes was chosen for each category)
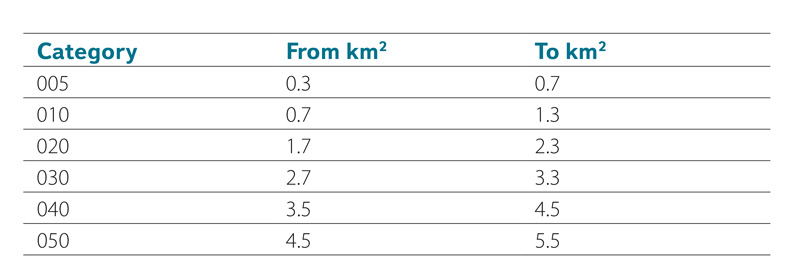
Areas smaller than category 005 can be considered elementary runoff areas and are not evaluated as separate catchments. At the same time, the lower limit of 0.3 km2 corresponds to the lower limit of the derivation of critical points [21].
To define the SHC, three data sources were used – a digital model of the terrain, watercourse axes, and water reservoir axes. The main input for determining the SHC was the DMR 4G with a resolution of 5 × 5 m. Since in some places the watercourse axes, due to human intervention and changes in the landscape, do not correspond to the runoff lines generated on the terrain model itself, the current watercourse axes that are part of ZABAGED® are included in the solution. These are based on measurements of detailed scales and reflect the current state of the water network. When creating the SHC, these lines are taken as more accurate than DMR-based runoff routing. When deriving basins, these watercourse axes must be included in the solution. Watercourse axes were projected into the DMR. The value of the pixels of the terrain model through which the axis of the watercourse passes has been reduced so that the resulting direction of the runoff corresponds to the axes of the current watercourses. In the following step, any non-runoff areas were removed on the terrain model modified in this way and a runoff routing layer was created. A one-way runoff routing tool (D8) was used to route the runoff. Accumulation in each pixel was then derived from the runoff directions.
For each catchment category (see Tab. 1), the accumulation layer was reclassified so that the values of the accumulation area outside the group boundaries have the NoData value and the values of the accumulation area corresponding to the given category the value 1. In cases where the runoff lines classified in this way end or intersect with water reservoirs, the runoff lines were shortened to the point where the drain line crosses the water reservoir. In these cases, therefore, basins at the entrance to water reservoirs are considered. For modified lines in individual categories, the endpoints of these lines were determined, which form the closing profile of the basin. on the basis of the runoff direction derived above, the boundary of the basin was derived for these points, taking into account the axes of the watercourses.
Characteristics of small catchments
The hydrological response from the SHC is determined by its morphological characteristics, soil properties, land use, and causative precipitation. It can be assumed that the hydrological response of similar basins will be similar. Therefore, for the above SHC categories, parameters were derived for their classification in terms of possible hydrological response.
The morphological characteristics were determined based on the model of the terrain and watercourses. In particular, these are the characteristics of altitude, slopes and length of runoff paths, as well as several shape coefficients.
Average width of the basin
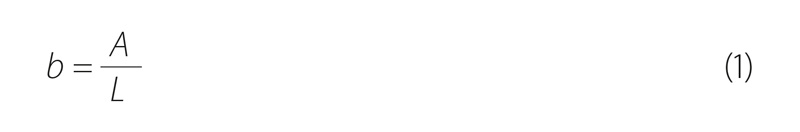
where A is the area [m2]
L maximum length of the runoff path [m]
Basin shape
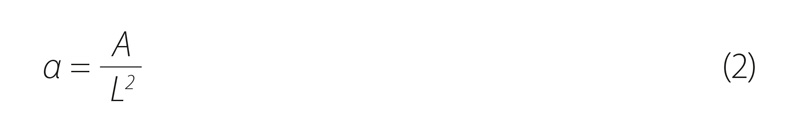
where A is the catchment area [m2]
L maximum length of the runoff path [m]
Shape coefficient according to Gravelius [25]
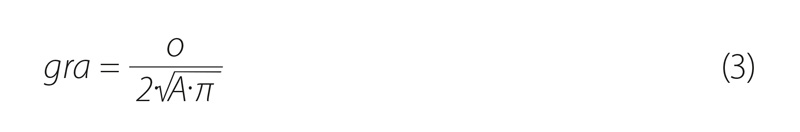
where O is the circumference [m]
A area [m2]
All three shape coefficients describe the shape of the basin. In the case of Gravelius coefficient, it is a comparison of the shape of the basin to a circle. The average width and shape coefficient of the basin determines the extent to which the shape of the basin departs from a square, or its power.
The standard description is the parameter of the water network density. This parameter determines the ratio of the total length of watercourses to the catchment area.

where LT is the length of the watercourse [m]
A area [m2]
One of the parameters that are influenced by the morphology and affect the course of the runoff is the time lag (Tlag). The Tlag value is used to describe the unit hydrograph according to the SCS-CN method [26]. Tlag is then calculated using [27].

where Tlag is the time lag [hours]
L length of the longest runoff path [foot]
Y average slope of the basin [%]
S maximum potential retention [inch]
The direct runoff volume potential of a given basin can be described by the average value of CN. CN integrates information about surface properties and soil infiltration properties. In the example given here, the CN values are taken from the derivation within the Strategy of protection against the negative effects of floods and erosion phenomena by semi-natural measures in the Czech Republic [28].
The last group of parameters is precipitation data. Since short-term precipitation is the dominant source of runoff in small headwater catchments, six-hour design precipitation derived from rain radars with a spatial resolution of 1 × 1 km were selected [19, 15]. These data are available at rain.fsv.cvut.cz.
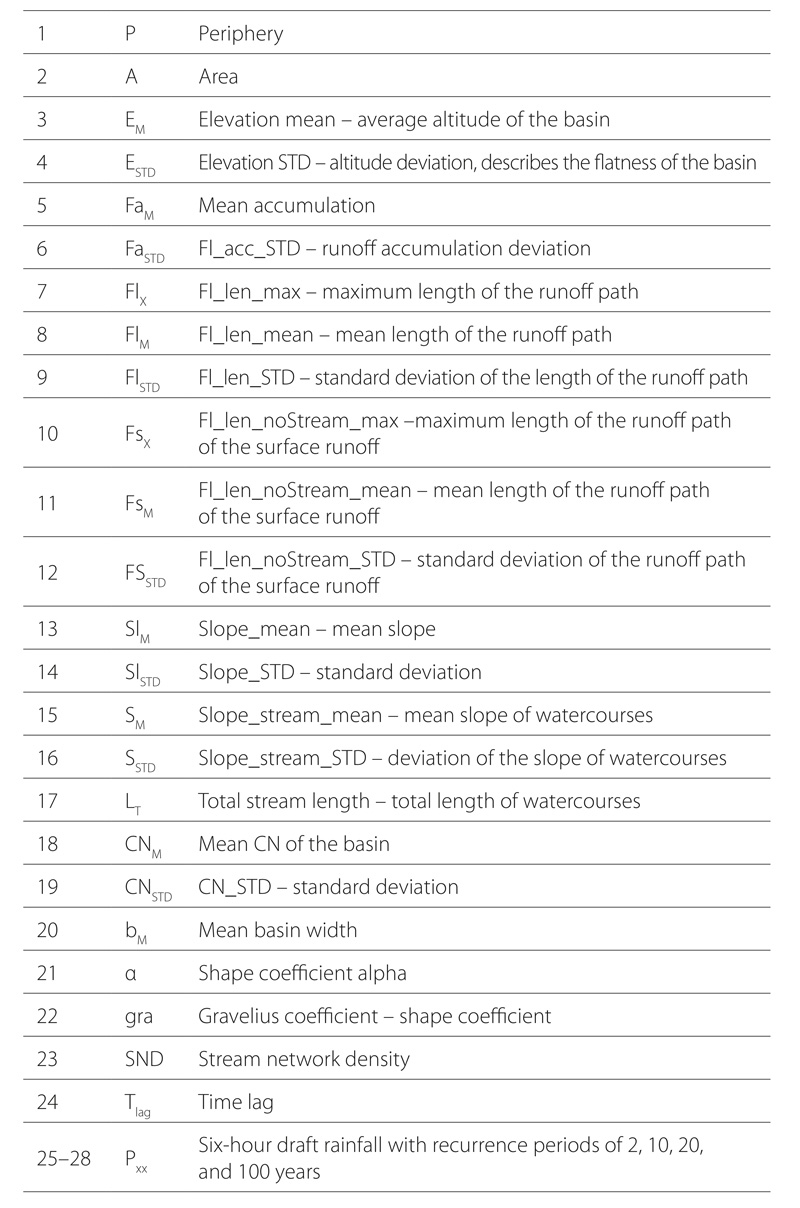
Tab. 2 includes an overview of monitored parameters. These are values describing the mean value, variance, and minimum or maximum value, depending on the type of parameter.
Tab. 2. List of parameters that enter the SHC cluster analysis. Parameters 1–16 were derived from DMR and vector lines of water courses, catchment slope was derived using unconditioned DMR. Parameters 20–24 derived according to Eq. (1–4)
In total, there are 28 parameters that were subsequently tested in all size categories in terms of mutual dependence using regression analysis. The aim was to obtain a set of independent parameters and classify the basins into groups according to their similarity using cluster analysis.
Delineation of small catchments, assignment and calculation of characteristics from the DMR, and CSC-CN basins was processed in the ESRI environments (ArcGIS and ArcGIS Pro), subsequent statistical analyses were processed in the R environment. Descriptive statistics and regression analysis tools were used for the solution. Cluster analysis was performed using the K-mean method. The individual clusters were subsequently aggregated in terms of the relative riskiness of key parameters to create the direct runoff component into five risk classes. The verification was carried out using recorded erosion events. The aim was to monitor whether the classification of the basin in terms of risk coincides with the location of erosion events.
RESULTS
SHC definition
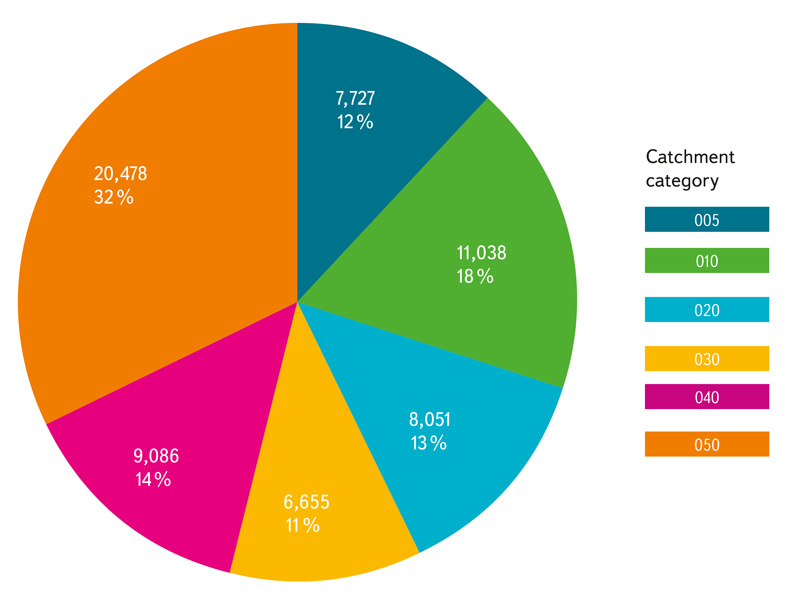
Basic data on SHC derived according to the methodology described above are shown in Tab. 3. As the SHC categories are always derived separately, the resulting catchments overlap between the categories – a smaller catchment may be part of a larger one in the parent categories. Therefore, in addition to the described categories, a group of basins was created in which only the largest basins are preserved. Interconnected catchments have been eliminated. In this way, catchments smaller than 5 km2 in the monitored area of the Czech Republic are preserved. This group of catchments is referred to as “Set of Largest Catchments” – “SoLC” and is also listed in Tab. 3. For clarity, it is added how much representation individual size categories have in the resulting SoLC group; the table contains data on the number of elements of the given category that are part of it. The representation of the areas of individual catchment categories in the SoLC group is shown in Fig. 1.
Tab. 3. Number and the total area of catchments in each category. For individual categories (1st column) the number of elements (2nd column) and the total area of the given class (3rd column) are given. The 4th and 5th columns show the representation of the elements of the given class in the SoLC class and the per-centage expression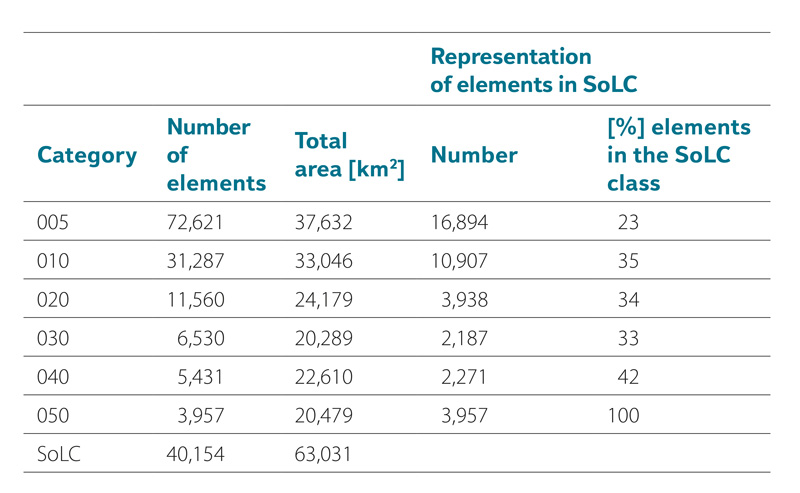
Fig. 1. Summary of the area of the catchments in SoLC categories
Selection of parameters
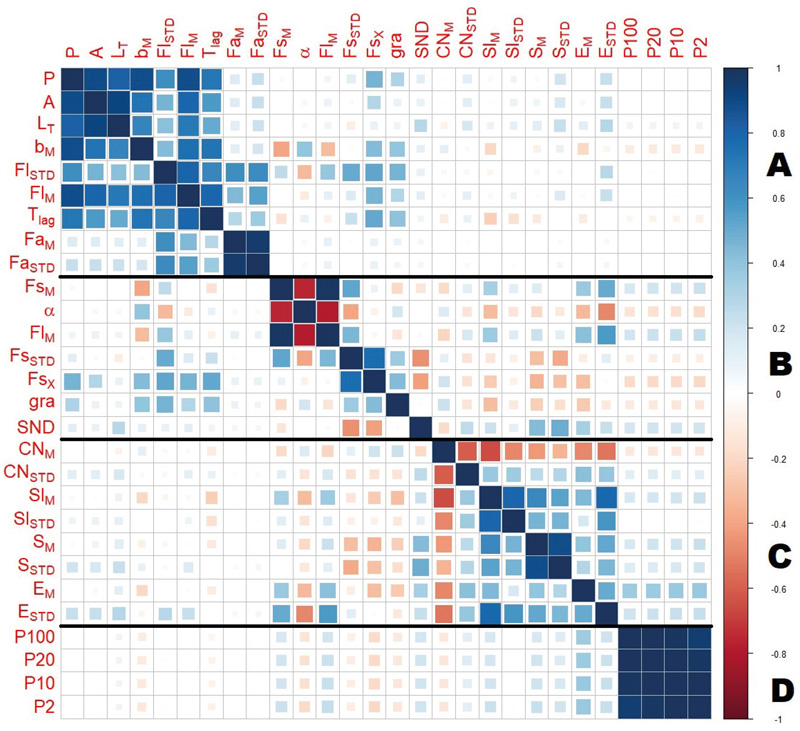
For individual basins in all size categories, parameters were derived according to Tab. 2. For the needs of cluster analysis, representative and independent parameters are sought in the first step. Dependent parameters must be discarded. The search for the degree of agreement between monitored parameters was carried out both for individual categories (including SoLC) and for all basins together. From the point of view of the groups of dependent parameters, the individual categories do not differ from each other. It is therefore the fact that the links between monitored parameters are similar for all size categories. A visually adjusted parameter match calculated using Pearson’s correlation coefficient is in Fig. 2.
Fig. 2. Visualization of the correlation between individual parameters for all catchments regardless of size category. A negative correlation is shown in red, and a positive correlation is shown in blue. The stronger the bond between two parameters, the darker and larger the symbol. Similar parameters are grouped together to visualize groups of similar parameters A to D [29]
Five parameters were chosen from groups of elements grouped according to their mutual dependence, which can be considered independent and sufficiently representative. Appropriate representative parameters were selected using principal component analysis (PCA), namely:
- Six-hour draft rainfall with a 20-year recurrence period (P20) – parameter representing group D. There is a significant correlation between individual
six-hour rainfall values due to the derivation of this data. - Mean CN of the basin (CNM) – parameter represents group C of several other parameters. The CN value shows agreement with both inclination and altitude.
- Time lag (Tlag) – this parameter characterizes group A. It affects the shape
of the runoff hydrograph, and thus the size of the peak flow. - Stream network density (SND) – is a parameter that represents the proportion
of the length of all watercourses in the basin and the area of the basin. Together with the shape coefficient alpha (α), they include both the characteristics of the length of the runoff paths and the shape of the basin. These two parameters together represent group B.
The stream network density (SND) and shape coefficient alpha (α) parameters are jointly correlated with the surface runoff path standard deviation (FSSTD) parameter. The SND is also related to the slope characteristics and the parameter α is related to the altitude. At the same time, SND directly describes the characteristics of the watercourse network. For this reason, these two parameters were used.
Distribution of parameters
To classify basins into groups in terms of potential response, it is important to compare the distribution of classification parameters between individual basin categories. If the chosen classification parameters had a different distribution for individual groups of basins, it would mean that different size categories have a different character of the hydrological response to precipitation. The aim was to compare the differences between individual size categories. Article [29] deals with this issue in more detail.
Since the parameter distribution differences between categories are not significant and do not differ from SoLC, cluster analysis was performed only on the SoLC group, in which all size categories are represented by at least 20 %. Cluster analysis using the K mean method was performed in the R environment, in the range of clusters from two to eight with a setting of 25 initial training points. Each catchment in the SoLC was assigned to a group according to five selected parameters each time the clusters were created. The formation of individual groups of basins is described in Fig. 3. The groups are marked with letters. If a group is formed only by separating from a previously formed group, a numerical designation is added.
Fig. 3. The Sankey diagram shows the evolution and regrouping of SoLC classes with increasing number of clusters. The number of elements in a given group corresponds to a belt. At the same time, the diagram shows how individual watersheds are oversubscribed according to the number of clusters. The basic division is already visible in the formation of two clusters (A, B). From the number of clusters six to the development of groups that are created by combining the basic division into A, B and subgroups. At six, group D is formed, which is a combination of all previously formed groups. With the number of clusters 7 and 8, groups C are created, which are a combination of parts of groups A2 and B2 [29]
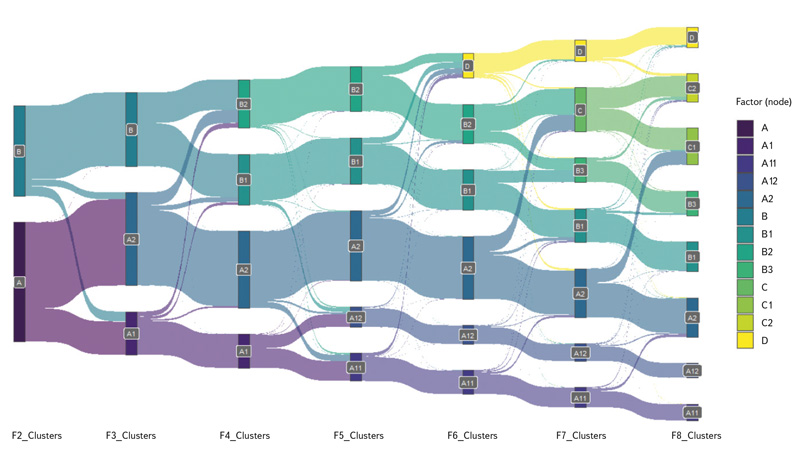
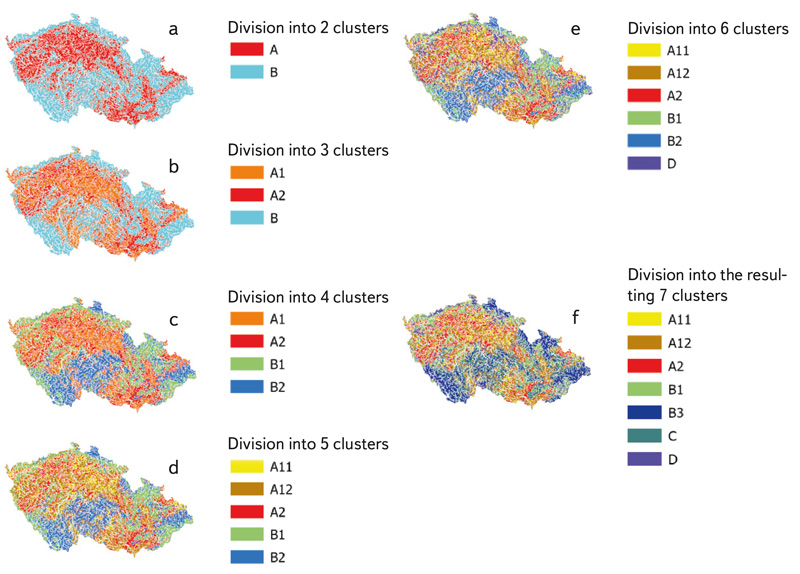
The groups formed during the gradual creation of clusters can be characterized by the following description. The geographical clustering is then shown in Fig. 4.
- 2 Clusters – When creating the first two clusters, group a is formed, which
is characterized by a higher CNM with a lower volume of precipitation P20.
Group B is characterized by higher precipitation P20 and a larger CNM value (Fig. 4a). - 3 Clusters – Group a is divided primarily in terms of shape characteristics
of the basin, in terms of stream network density (SND) and in terms of lag time (Tlag) (Fig. 4b). - 4 Clusters – From group B, group B1 is separated, which is characterized by lower precipitation P20 while maintaining a lower CNM value, and, on the contrary, group B2 with higher precipitation totals P20 and a higher CNM value (Fig. 4c).
- 5 Clusters – Group A1 divides dominantly based on time lag. The resulting A12 group is characterized by a significant time lag (Tlag), while the A11 group retains the original characteristics of A1 group. Groups A11 and A12 defined in this way are then preserved even after dividing the basin into several clusters (Fig. 4d).
- 6 Clusters – a completely new group D is formed, which is characterized by a relatively high SND as well as relatively low precipitation totals P20 while maintaining a relatively high CNM value. The group D created in this way remains even after dividing the basin into several clusters (Fig. 4e).
- 7 Clusters – Group B2, which is characterized by relatively high precipitation P20, is widely divided. Together with part of the basin from group A2, it forms a new group C, which is characterized by relatively higher precipitation totals and, at the same time, higher CNM values. Part of the catchment from the original group B2 and part of the catchment from group B1 form group B3, which maintains similar parameters to the original group B2. The number of basins from the original group B2 is so small that the group is renamed B3 (Fig. 4f).
- 8 Clusters – There is a redistribution within the newly created group C
into groups C1 and C2. The newly formed group C1 is also made up of a part of the catchment area of group A2 and is characterized, like the original group C, by higher values of P20 and CNM. It is distinguished from group C2 by the difference in the SND and (α) parameters; this division no longer brings new information to the basin classification.
The gradually formed groups of basins are characterized by the mean values of the selected five parameters mentioned above. Parameters and cluster analysis are discussed in more detail in article [29].
Fig. 4. Geographical representation of group evolution when forming clusters from two (a) to seven (f)
The created basin clusters are further classified according to the possible risk of direct runoff. From the point of view of the influence of the parameters on the risk associated with the emergence of direct runoff, the following applies for individual parameters:
SND – The higher the value, the denser the permanent water network, any runoff will tend to concentrate in these paths where the runoff is expected. A larger value therefore means a lower level of risk.
Tlag – The longer the time lag, the lower peak flows can be expected.
α – The more complex the shape of the catchment area, the more the runoff paths are lengthened, and thus also the culmination is reduced.
CNM – The smaller the mean CN value, the greater the retention rate in the basin and the lower the potential risk of threat.
P20 – The higher the rainfall, the higher the risk of possible runoff response.
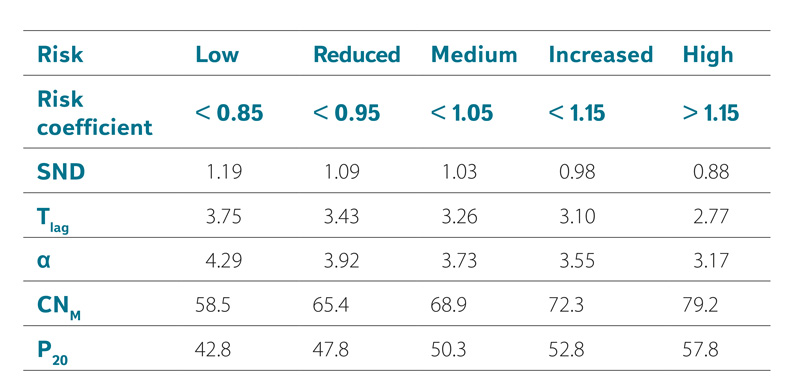
For individual parameters, a mean value was calculated in the SoLC category, which is taken as medium risk. The degree of risk was determined for individual parameters relative to this mean value of the given parameter. For each value of the parameter corresponding to the centre of gravity of the individual clusters, the proportion with this mean value was determined, thereby determining the riskiness of each parameter in the given cluster. Those combinations of five parameters are considered at risk where a negative assessment prevails, and vice versa. The level of overall risk is divided into five categories from low to high risk as described below:
Low risk – the combination of possible runoff response parameters assumes a low risk in terms of direct runoff affecting the basin. These areas appear to be unproblematic from a direct response point of view and the need
for measures in these areas is not anticipated.
- Reduced risk – the combination of possible runoff response parameters assumes a rather small risk in terms of affecting the catchment area
by direct runoff. These areas are unproblematic from the point of view of direct response and taking measures in these areas is not needed. - Medium risk – the combination of possible runoff response parameters is average and a medium level of risk is assumed in terms of direct runoff affecting the catchment.
- Increased risk – the combination of possible runoff response parameters presupposes a greater degree of risk in terms of affecting the catchment area by direct runoff.
- High risk – the combination of possible runoff response parameters assumes a high risk in terms of direct runoff affecting the basin. In these areas, a more detailed investigation and monitoring of the possible negative impact of the risk caused by direct runoff should be carried out.
The parameter values for determining the risk level are shown in Tab. 4.
Tab. 4. Individual parameters used to express the degree of risk in relation to the mean values of the parameters
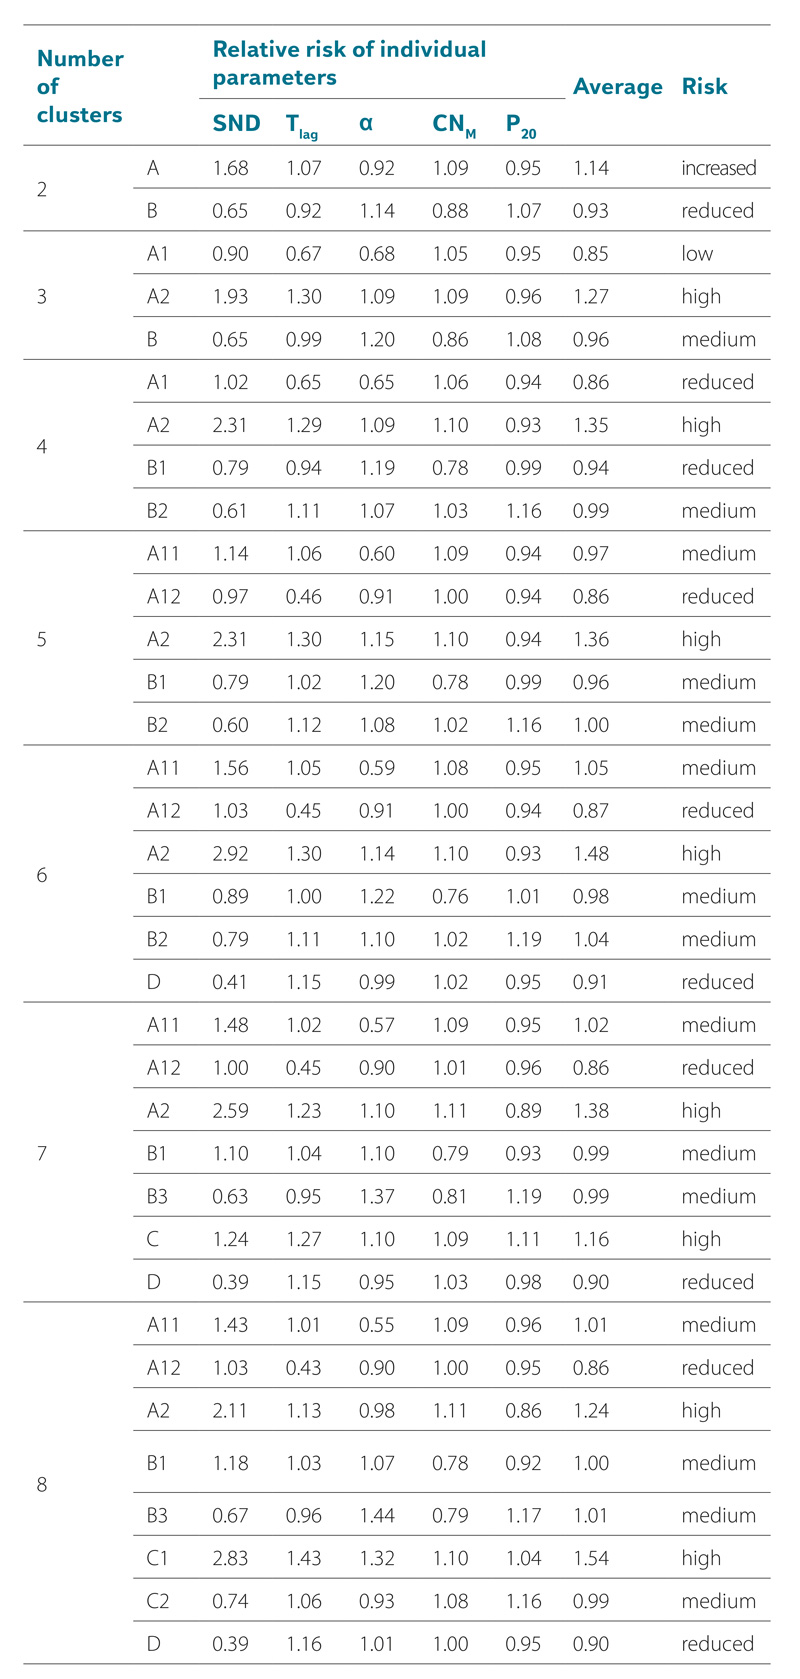
The classification of the groups of catchment areas of the cluster analysis according to the level of risk is shown in Tab. 5, where groups from the number of clusters 2–8 are included.
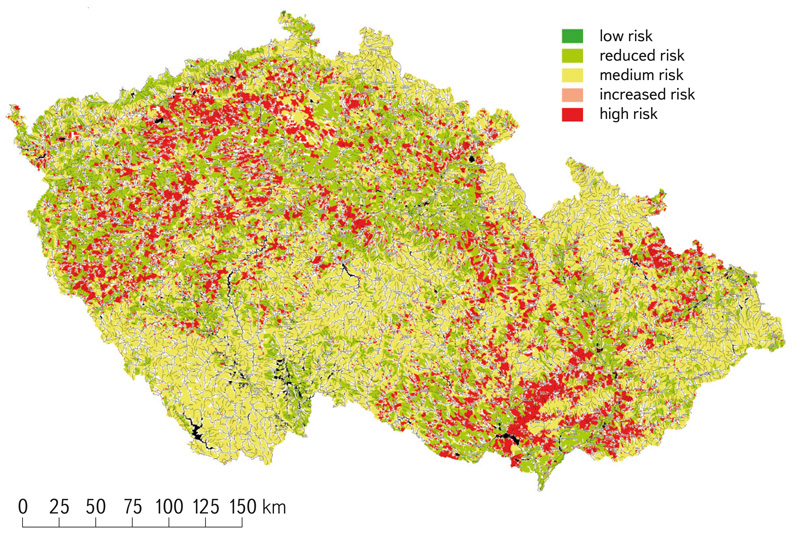
The geographical expression of the level of risk is then shown in Fig. 5. Groups A2 and C together form a group with a high risk, groups A11, B1, B3 a group with a medium risk, and A12 and D a group with a lower risk.
Fig. 5. Distribution of the area of the Czech Republic according to the identified
level of risk in the case of dividing the basin into seven clusters
The classification of small catchments in terms of the risk of direct runoff is expressed relatively between individual parameters. A certain validation criterion of the results can be a comparison of the classification according to the degree of risk with recorded erosion events in the Monitoring of agricultural soil erosion. Monitoring has been ongoing since 2012, and by the end of 2021, over 2,200 erosion events have already been recorded [30].
The intersection of the affected land listed in the monitoring with the boundaries of the defined small catchments is shown in Fig. 6. to assign the event to the relevant basin, the centre of gravity of the polygon delimiting the recorded event was taken.
Fig. 6. Recorded erosion events with the risk level of the respective SoLC indicated (high risk in red, medium risk in yellow, reduced risk in green, events outside the SoLC in white)
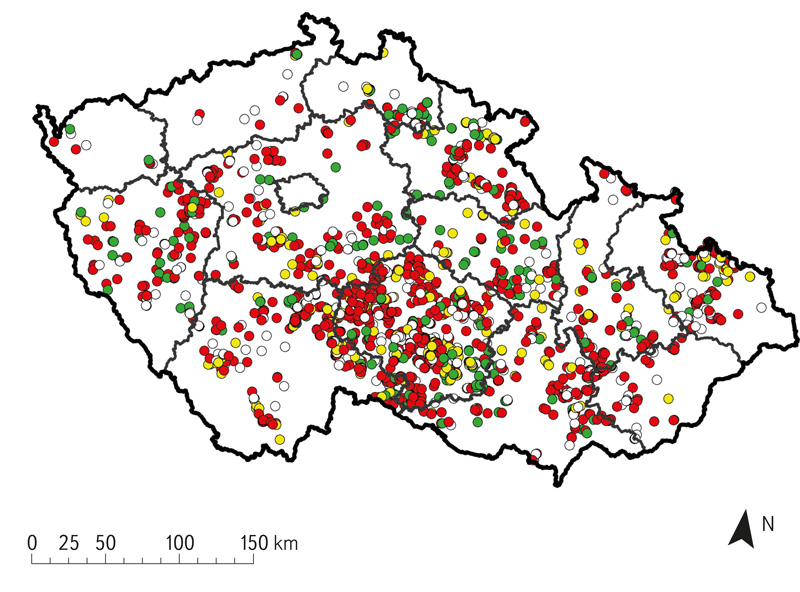
Fig. 7. Number of recorded erosion events in monitoring classified by SoLC risk
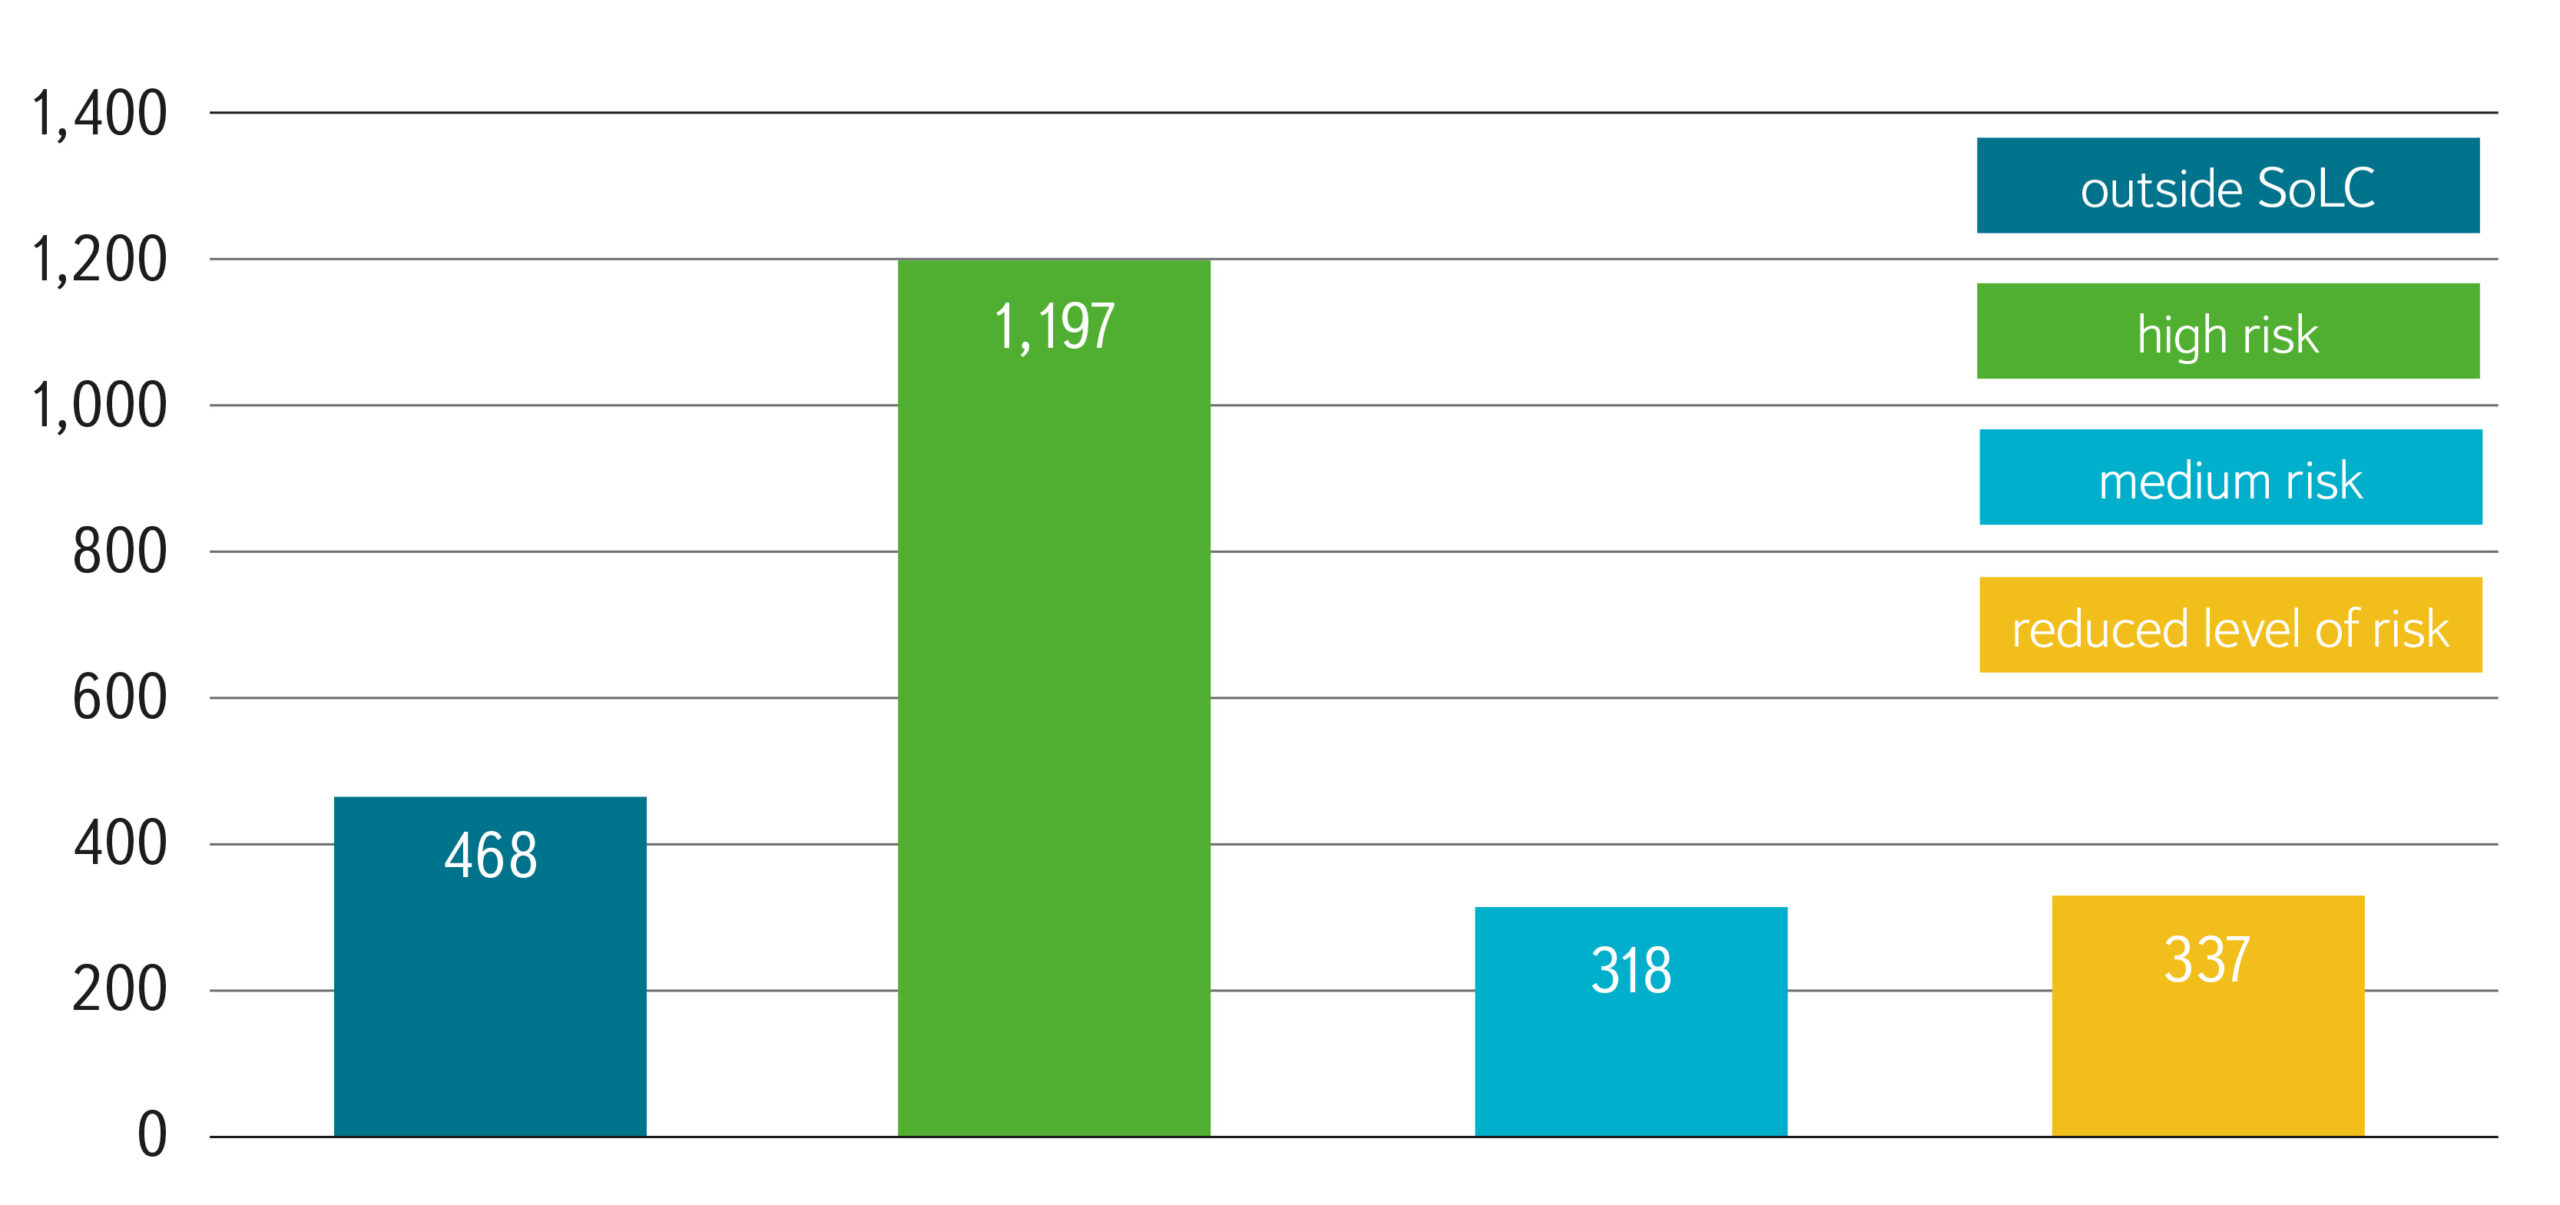
Of the total number of 2,220 recorded events until 2021, half of them were in high-risk catchments. Most of the recorded erosion events are recorded in Vysočina Region and South Moravia. In other regions, where erosion events are not recorded, it is more about the completeness of the database of erosion events than about parts of the Czech Republic without occurrence of events.
Tab. 5. Development of the risk classification of catchment groups produced by cluster analysis
DISCUSSION
Basin classification is more commonly used in experimental hydrology. Basins are also classified in the expanding CAMELS database. In these cases, the list of parameters is larger. In contrast to the selection of parameters presented here, it includes hydrological data of long-term balances and parameters that affect long-term runoff and other components of the balance [6]. In most cases, it monitors larger basins. Long-term series of observations in small basins are significantly less frequent than in larger basins. The small catchments presented here bring information about the upper non-flow basins to the standard classification. At the same time, these upper catchments are classified according to key characteristics affecting the direct component of runoff.
Input data with different spatial resolutions were used to create basin boundaries and their properties. The delineation of the basin boundaries was created on the basis of a terrain model with a resolution of 5 × 5 m, which is sufficiently detailed even for the delineation of small catchments in the considered size category 005. Based on the terrain model, other morphological characteristics were then derived at the same resolution. When using the D8 method at a lower resolution, the creation of basin boundaries could be affected, especially for the smallest category.
The parameters that enter the cluster analysis do not differ significantly in terms of the distribution of values between the categories. Smaller basins are also part of larger basins and together they form SoLC, where at least 20 % of the number of basins from each category is represented. The total area of the upper basins included in the SoLC is 63,000 km2, which is about 80 % of the area of the Czech Republic (78,000 km2).
Several of the 28 parameters considered are mutually correlated. The first group (A, see Fig. 2) of mutually correlated parameters are the geometric parameters of the basin (size, area, runoff path length, runoff accumulation) with Tlag. The shape coefficients (group B) are linked in a mutual correlation with the SND and the length of the runoff paths outside the watercourse. From this group, the parameters SND and α are the least interconnected. Another important group (C) is the intercorrelated parameters describing the slope ratios of the basin, the slopes of the watercourses, the altitude in relation to the land use and soil characteristics of the CNM. This connection corresponds to the use of land in mountainous, mostly steeper sloping areas, which are mainly forested. A separate group of parameters is precipitation (D), which have a mutually strong link. They do not show a significant link with the other parameters.
From the point of view of response and, possibly, from the point of view of the risk of increased flows, mainly short-term rains are key in small headwater catchments. The occurrence of a flood and possible threat is a combination of the current conditions of the basin and the course of the causative precipitation. Especially short-term torrential rains are difficult to predict. However, it is a fact that two differently classified basins, which will have the same initial state and will be loaded with the same rainfall, will have a different response to causative rainfall. The classification of basins according to parameters has a practical impact on possible prioritization in terms of the implementation of measures.
The subsequent cluster analysis of the basins from the point of view of their hydrological response shows that, according to the selected parameters, there is a basic division of the basins into two groups, in which the categories A2 and B2 are gradually separated, which according to their parameters fall into the group with the risk of increased runoff from torrential rains. Above all, risk group C is then separated from these two groups. The independently created group D is created from the previously created groups a and B, and the basins with the lowest risk in terms of threat are separated within it. The creation of two clusters C1 and C2 from group C and partly from group A2, with a total number of clusters of eight, no longer brings new information in terms of possible threat. For the classification of SHCs in terms of their potential threat, it is therefore appropriate to classify them into seven clusters.
Clusters of small catchments were assigned a risk level value on a five-point scale. When divided into seven clusters, the lowest risk is in group A12. Together with D, it falls into the “reduced risk” category, however, it is on the borderline of values for inclusion in the “low” category. Groups A11, B1 and B3 have a medium risk. High risk A2 and C, where A2 is the highest risk of all groups and C is on the borderline for inclusion in the “increased risk” group.
Some validation of the resulting risk can be done by comparing the locations of the actual observed erosion events and the boundaries of the resulting SHC. The result shows that more than half of the recorded events are in the high risk class. Less than 15 % are in the medium and reduced risk classes, and 20 % of the recorded events are on land outside the SoLC, i.e. in inter catchments.
CONCLUSION
The presented derivation and subsequent classification of SHC (small headwater catchments) from the point of view of the level of threat bring insight into their possible hydrological response. It can be said that up to the number of five clusters, the primary division into two groups a and B is preserved, which are already created during the creation of the first two clusters. In both, two groups are gradually formed, which are rather risky. We can consider seven clusters a sufficiently explanatory classification of SHC, where both group D (a very low risk), consisting of elements of groups a and B, and a group C (very threatened) by delineation from groups A2 and B2, will be formed. With seven clusters from the area of the Czech Republic, this approach assesses 28.5 % of the area as at risk, 29.4 % of the area with medium risk, 22 % with below average risk, and 20 % of the area of the Czech Republic is not assessed – it does not fall into the SHC category.
Headwater catchments cover a significant part of the Czech Republic. With the selected limit of up to 5 km2, the SoLC (Set of Largest Catchments) make up about 80 % of the Czech Republic. SHC are a space for the primary accumulation of rainwater. At the same time, these basins are most affected by direct runoff, which subsequently reduces the availability of water in their area. The classification of small headwater catchments in terms of potential threat from torrential rains is one of the possible perspectives. Another use of the spatial delineation of these basins can be subsequent classification, for example, from the point of view of water availability for irrigation, or the application of other adaptation measures with expected climate change.
Within the Czech Republic, it is possible to consider the agriculturally used parts of South Moravia and the western part of the Bohemian-Moravian Highlands and north-western Bohemia to be more at risk. Alternation of high-risk and lower-risk basins is also typical in these areas. The region of South Moravia and Western Bohemia is a typical agricultural landscape. Areas with medium risk are mainly mountainous (Šumava, Krkonoše, Jizerské hory, Jeseníky), which are characterized by increased precipitation totals, the impact of which is reduced by increased afforestation. This group also includes the Beskydy Mountains and northern Moravia. The Ore Mountains fall within an area with a lower risk, which is due to lower precipitation totals. Areas with a lower risk include foothill areas, with the exception of Orlické hory foothills and south-western Pilsen Region, which fall within areas with an increased risk. The largest area of the basin with a reduced risk is Polabí, partly Třeboň Region, and the hilly areas of Brdy and western Bohemia.
Derived boundaries of small catchments are available as a web service on the rain.fsv.cvut.cz portal.
Acknowledgements
This article was created with the support of the Ministry of Agriculture project „Preliminary saturation and design rainfall intensities as runoff response factors in small catchments“ (QK1910029) and the Technology Agency of the Czech Republic „Use of remote sensing data to assess the negative impacts of torrential rainfall“ (SS1020366).
The Czech version of this article was peer-reviewed, the English version was translated from the Czech original by Environmental Translation Ltd.
