ABSTRACT
Bathing ponds represent a specific ecosystem where living organisms play a dominant role in maintaining the quality of water in the water body. At the same time, they are very frequently visited, so the biggest source of pollution is from bathers. The aim of this publication is to present and evaluate possible chemical indicators of anthropogenic load – caffeine and urea at four sites (two of which during the entire bathing season) in the summer of 2023. Furthermore, the results of basic chemical and microbiological indicator detection are presented, including adenosine triphosphate (ATP), which represents a total microbial recovery. The indicators of anthropogenic load (caffeine and urea) show values of up to > 500 ng or µg/l in the peak summer season. The indicators prescribed by current legislation (indicators of faecal pollution E. coli and intestinal enterococci) did not capture this increased anthropogenic load. The determination of ATP has shown promise, but further research will be needed, especially in purifying, i.e. very microbially active zones. Total nitrogen could be a suitable indicator of the gradual increase in anthropogenic load during the bathing season.
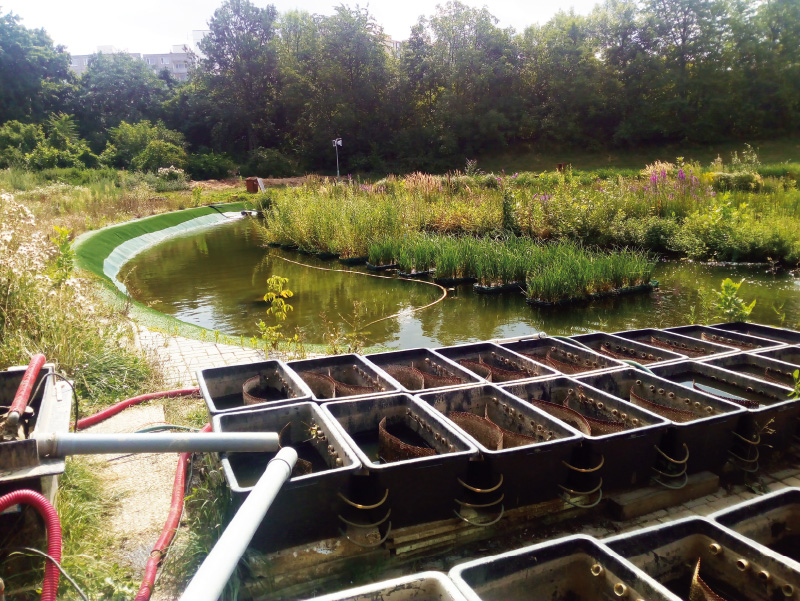
Fig. 1. View of the biological purifying zone
INTRODUCTION
Bathing ponds, natural swimming pools, biologically filtered swimming pools, living pools, eco-pools – these are terms used for public or private swimming facilities where the primary role in maintaining water quality is played by living organisms. In the Czech Republic, the first public bathing pond was opened in 2007 in Kovalovice [1], and by 2024, there were already 40 in operation (IS PiVo, 2025). Bathing ponds were incorporated into national legislation in 2011, along with the definition of requirements for parameters, their monitoring, and evaluation. At that time, experience with bathing ponds in the country was still limited, so the requirements were inspired by German and Austrian regulations [1].
At present, the Public Health Protection Act [2] defines a bathing pond as “a facility approved for the purpose of bathing, equipped with a natural water purification system for bathing purposes.” Decree No. 238/2011 Coll. of the Ministry of Health [3] requires the monitoring of indicators of faecal contamination, specifically Escherichia coli and intestinal enterococci, as well as water transparency. The requirement to monitor Pseudomonas aeruginosa was removed in 2014 due to unresolved methodological reasons. The current legislation relating to bathing ponds is certainly not perfect, and it would be appropriate to improve or update the definitions and requirements during the next revision of Czech legislation.
According to data from the IS PiVo system, the numbers of E. coli and intestinal enterococci are generally well below the limit values (i.e. below 100 and 50 CFU/100 ml, respectively); however, occasional exceedances occur at most sites. At least once per season between 2018 and 2023, E. coli limits were exceeded at 20–30 % of bathing ponds, and the limit for intestinal enterococci at approximately 40 % [1]. In 2023 and 2024, the figures were lower: E. coli exceedances occurred at 11 % and 8 % of sites, and intestinal enterococci at 26 % and 28 %, respectively. Unlike natural bathing sites, the dominant source of contamination is bathers themselves.
Given the predominantly anthropogenic nature of this type of pollution, the use of additional indicators could be considered to help identify it, or to distinguish it from more “natural” forms of contamination. Other potential sources include pollution introduced by birds (primarily mallards, which visit bathing ponds) and, occasionally, seepage into the water body during periods of elevated groundwater levels following heavy rainfall.
The article deals with the assessment of additional possible chemical indicators of anthropogenic pollution (namely caffeine and urea) as well as the results of total adenosine triphosphate (ATP) analysis, which reflects overall microbial activity.
BACKGROUND TO THE ISSUE
Urea CO(NH₂)₂ is found in the urine of mammals, amphibians, and some fish. It is synthesised in the liver through the urea cycle. In the body, urea serves as a waste product through which excess nitrogen is excreted in urine, and to a lesser extent also through the skin during sweating. During the urea cycle, the amino acid arginine is broken down into urea and ornithine. Urea is excreted from the body in urine, while ornithine is reused as a precursor in the synthesis of arginine [4]. Another source of urea is the decomposition of algal and cyanobacterial biomass, as well as the breakdown of certain nitrogen-containing organic compounds and zooplankton excretion [5]. Urea concentrations have been monitored, for example, in Poland in the Great Masurian Lakes, where values typically ranged from 30 to 48 µg/l, with the highest levels (up to 1.5 mg/l) detected in spring, and the lowest at the end of summer during peak phytoplankton development [6]. Urea concentration was found to be inversely proportional to the trophic status of the studied lakes, and it was also shown that the rate of enzymatic urea degradation increases exponentially with water temperature [6]. Given the expected anthropogenic load in bathing ponds, the results of urea measurements in swimming pools, where significantly higher values are often detected, are particularly relevant for comparison. Public bathing and swimming in pools are associated with occasional unintentional (though unfortunately sometimes deliberate) urination in the water. According to a study [7] conducted in Canada in two pools with volumes of 840 m³ and 420 m³, where the concentration of the artificial sweetener acesulfame in pool water was compared over three weeks with its average concentration in human urine, the volume of urine in the pools reached just under 0.01 %. An earlier study [8] reported an estimated input of 60 to 80 ml of urine per swimmer per day, based on changes in potassium concentration in the pool. Karimi [9] monitored water samples from ten swimming pools in Tehran, Iran, which were disinfected using various methods. The average urea concentration in pools disinfected with chlorine was 5.5 mg/l. In pools disinfected with ozone followed by chlorine, the average concentration was 4 mg/l, and in those disinfected with UV light followed by chlorine, the average urea concentration was 3.5 mg/l. Zhang et al. [10] report that urea concentrations in Beijing (China) ranged from 0.07 to 18.73 mg/l. Zhou et al. [11] found urea concentrations ranging from 0.74 to 15.02 mg/l in their study.
Caffeine (1,3,7-trimethylxanthine, C₈H₁₀N₄O₂) is a purine alkaloid found both in widely consumed beverages (coffee, Coca-Cola, tea, energy drinks) and in pharmaceutical products. It enters the environment primarily through wastewater from human settlements and industry. Caffeine concentrations in beverages range from tens to hundreds of mg/l; for example, coffee contains 36 to 804 mg/l, tea 122 to 183 mg/l, Coca-Cola and similar drinks 41 to 132 mg/l, and energy drinks 267 to 340 mg/l [12]. After consumption, caffeine is absorbed into the bloodstream relatively quickly, with about one-fifth absorbed directly from the stomach [13]. Almost all ingested caffeine is metabolized in the liver by demethylation into primary metabolites, paraxanthine (80 %), theobromine (11 %), and theophylline (4 %), which can undergo further demethylation and oxidation, resulting in uric acid salts and uracil derivatives [13]. The rate of caffeine metabolism depends on many factors, with its half-life in the body ranging from 2 to 12 hours, most commonly 4 to 5 hours [13]. Only a small portion of caffeine is excreted unchanged in urine, with reported amounts varying between 0.5 % and 10 % according to different publications [14]. Caffeine is primarily excreted from the body through urine along with its main metabolite, paraxanthine, although traces can also be found in perspiration. Rybak et al. [15] studied the concentrations of caffeine and its metabolites in human urine, reporting median values of 3.39 µmol/l for caffeine, 15.2 µmol/l for paraxanthine, 20.3 µmol/l for theobromine, and 1.63 µmol/l for theophylline; when converted to mass concentration, the median for caffeine is 658 µg/l. The detected concentrations vary mainly depending on age, with the highest values observed in the 40 to 59-year age group [15]. Excretion rates differ between caffeine and its individual metabolites, ranging from 0.423 nmol/min to 46.0 nmol/min [15].
The average caffeine consumption per capita per day was 288.58 mg in 2013, according to data from Food Balance Sheet of the United Nations, with significant differences between individual countries [16]. Numerous studies have investigated the presence of caffeine in water; there is much more data on its occurrence in wastewater and flowing waters than in bathing waters (including lakes). So far, no one has monitored the presence of caffeine in bathing ponds. Buerge et al. [14] propose caffeine as a useful chemical marker for assessing wastewater contamination in watercourses. They determined its removal efficiency in Swiss wastewater treatment plants (WWTPs) to be between 81 and 99.9 %. These authors also commonly detected caffeine in Swiss lakes and rivers (6–250 ng/l), except in mountain lakes. The proposal to include caffeine as an indicator of anthropogenic pollution is also supported by Portuguese researchers Paiga et al. [17], who reported caffeine concentrations in rivers ranging from 25.3 to 321 ng/l. More recent studies have reported caffeine concentrations in lakes in Maine (USA), with average values ranging from 6 to 11 ng/l and a maximum of 21 ng/l [18]. In our previous research, maximum concentrations detected in standing bathing waters were 296 ng/l for caffeine and 0.127 mg/l for urea [16]. In the Vltava River at Prague–Podolí, the average caffeine concentration recorded between 2005 and 2018 was 220 ng/l, with a maximum of 960 ng/l and a minimum of 100 ng/l [19]. Given the relatively effective biodegradation of caffeine at WWTPs, the presence of caffeine in surface waters is more indicative of recent contamination by raw sewage rather than pollution via effluents from WWTPs. Caffeine degradation also occurs in natural waters, primarily through the activity of bacteria from genera such as Pseudomonas, Klebsiella, Bacillus, Rhodococcus, and others [20]. In 12 chlorinated swimming pools in Australia, caffeine concentrations of up to 1,540 ng/l were detected, with significant fluctuations observed throughout the day depending on visitor numbers [21]. In thermal pools in Slovakia, caffeine was found at 44 out of 49 sites, with the highest concentration reaching 69,000 ng/l (median 310 ng/l and arithmetic mean 1,140 ng/l) [22].
Urea and caffeine are not as stable in the aquatic environment as certain pharmaceuticals, for example. Urea gradually breaks down in water into ammonium cyanate and subsequently into ammonia and carbon dioxide. Both acidic and alkaline conditions accelerate this reaction, as does elevated temperature. Even minimal urea decomposition causes an increase in pH, and this alkaline pH in turn catalyses further breakdown. The optimal pH for urea is 6.2 [23]. The alkaline environment in bathing ponds would further accelerate the breakdown of urea (in our cases, the pH ranged from 8.51 to 8.53 – see Results). Caffeine is readily broken down during wastewater treatment (81–99.9 % elimination according to [14]), so its degradation can also be expected in bathing ponds. Other authors [24] report complete biodegradation of caffeine by a pure culture of Pseudomonas spp. at an optimal pH of 6.0 within 24 hours, and also mention the inhibitory effect of both organic and inorganic nitrogen compounds, with the effect of urea found to be stronger than that of ammonium salts. In another study [25], also working with Pseudomonas bacteria, the maximum rate of caffeine biodegradation was quantified at 0.345 µmol/min, with an optimal pH for biodegradation 8.0. It was also observed that among metal ions, Cu2+ and Zn2+ ions had a strongly inhibitory effect on caffeine biodegradation, whereas Fe2+, Ca2+ and Mg2+ ions had a stimulating effect [25]. In the aquatic environment, caffeine may undergo hydrolysis and, under suitable conditions, also photodegradation or biodegradation. Alhassen et al. [26] investigated caffeine photodegradation induced by artificial light with a wavelength of 400 to 500 nm simulating sunlight and recorded a caffeine half-life of 2.3 to 16.2 hours depending on the type of matrix (demineralised water, river water alone, and river water with added leaves). It was found that certain organic substances reduce the rate of caffeine degradation, and that in addition to photodegradation, hydrolysis also contributes to breakdown, although it is significantly slower [26]. In another study, a half-life of six days was observed following inoculation with effluent from a WWTP, or ten days in the case of biodegradation by microorganisms from activated sludge [27].
The ATP test analyses the presence of overall microbial contamination and is a process that measures active microorganisms. The test is based on the detection of adenosine triphosphate (ATP), a molecule that serves as the primary energy carrier in and around living cells, thus providing a direct measure of biological concentration in the sample. ATP is detected by measuring light, and the amount of light produced is directly proportional to the amount of ATP present in a given sample. The measurement is expressed in relative light units (RLU). A direct proportionality is always applied during measurement – the higher the ATP level, the higher the RLU value. We discussed this indicator in detail in our previous article, which also cites relevant literature and examines the issue of free (extracellular) and total ATP [28].
METHODOLOGY
Grab samples were analysed, collected in accordance with the applicable sampling regulations at several bathing ponds in 2023. These were public bathing ponds located in Prague – Radotín (hereinafter A), Prague – Lhotka (B), Kosmonosy near Mladá Boleslav (C), and Lipany (D), situated approximately 3 km west of Říčany. Site D is not a typical bathing pond. It is an open-access reservoir with a partial bypass; however, a natural method of water treatment is also applied. The capacity of bathing pond A is 700 and that of pond B 1,000 visitors per day. The design capacity of the water area at bathing pond C is 100 people at any one time, and 300–500 persons per day. Fig. 3 shows the maximum daily air temperature, precipitation in the study area (archive on the website https://www.in-pocasi.cz/ [29]), and the sampling days for the individual sites. These data allow at least partial inference of the usage intensity of the bathing ponds before sampling. Tropical days are defined as days with a maximum daily temperature exceeding 30 °C; however, the attendance at bathing ponds increases steadily from the threshold for summer days (i.e., maximum daily temperature > 24 °C) [30]. Precipitation, cloud cover, and other factors also have an influence. During sampling, air temperature and recent visitor numbers were always recorded. In terms of visitor attendance, and therefore the expected loading of the bathing pond, it is important to consider not only the weather on the day of sampling but also the conditions over the preceding few days. As shown in Fig. 3 (and supported by our records), the days leading up to the June and July sampling dates at sites A and B were warm, and those before the August and September sampling dates were very warm (site B was out of operation during July). At Site C, samples were taken on a scheduled closing day; however, the days preceding the sampling were warm and without precipitation.
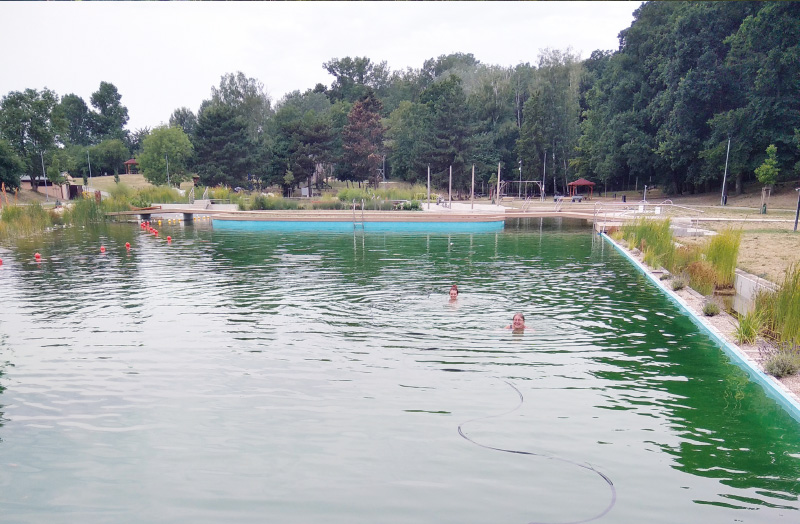
Fig. 2. Bathing pond Kosmonosy
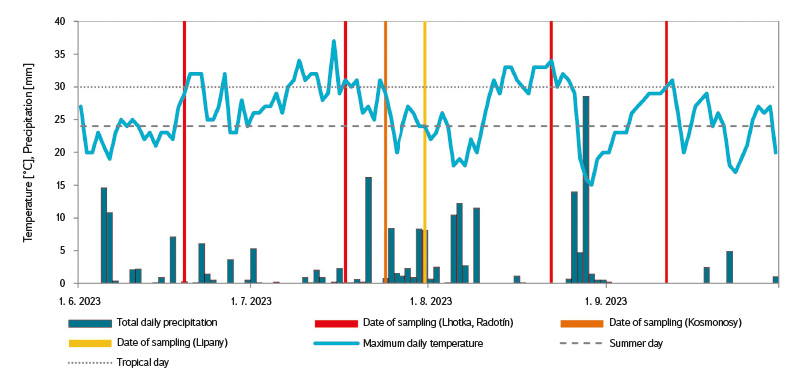
Fig. 3. Maximum daily air temperature and daily precipitation at the Prague – Libuš station and sampling days in the summer season 2023
At sites A–C, two samples were taken from opposite sides of the bathing pond (Fig. 4) for microbiological analysis and determination of urea and caffeine. At site D, samples for these parameters were taken from a single location. Samples for chlorophyll-a were collected at sites A–C from only one sampling point (Fig. 4). Samples for basic chemical analysis were taken at sites A and B: from one location at site A and from two locations at site B (Fig. 4). Total ATP was measured in situ at the above-mentioned sampling points.
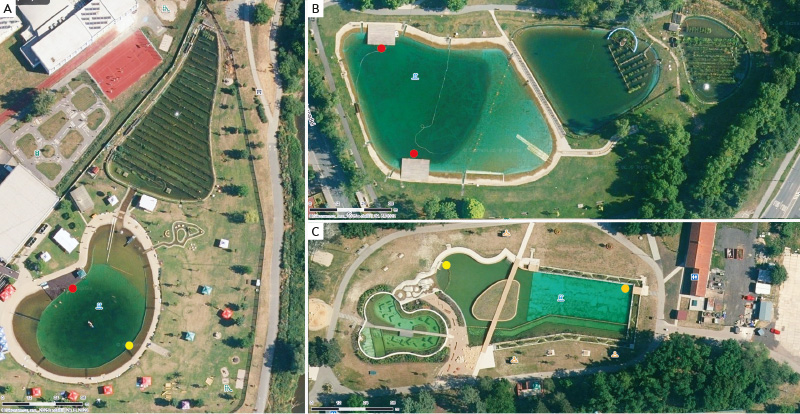
Fig. 4. Position of sampling points at bio-swimming pools A–C; red marks sampling points for all indicators, orange marks microbiological indicators, chlorophyll-a, caffeine and urea, yellow marks microbiological indicators, caffeine and urea (source photomap: www.mapy.cz)
Two bathing ponds (A and B) were sampled repeatedly at four-week intervals throughout the entire bathing season, while two sites (C and D) were sampled only once (Fig. 3).
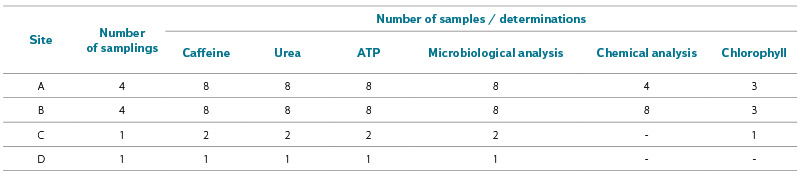
Total number of samples collected at each site is shown in Tab. 1. Samples were transported under constant cooling to the laboratory and processed immediately, except for caffeine determination, where samples were frozen at -18 °C and analysed collectively at the end of the bathing season. Possible changes in urea and caffeine in the samples during transport and storage were verified (considering the effect of sample containers, duration, and storage method), using an internal standard (urea) or blank and duplicate samples (caffeine). Total ATP was measured on-site.
Tab. 1. Total number of samples collected at individual sites
Urea was determined using a method based on the enzymatic breakdown of urea by urease into ammonium ions, which were then measured spectrophotometrically (a modification of the method according to [31]; for details, see [16]). The method’s detection limit is 60 µg/l and the quantification limit is 110 µg/l. Caffeine was determined by LC-MS/MS with a detection limit of 25 ng/l and a quantification limit of 50 ng/l (a modified procedure based on the ČSN ISO 21676 standard [32]).
The indicators of faecal contamination, E. coli and intestinal enterococci, were determined using standardized methods according to ČSN EN ISO 9308-2 [33] and ČSN EN ISO 7899-2 [34], respectively. Total ATP was measured luminometrically (Aquasnap, Hygiena) directly at the site. During the first sampling at sites A and B, we also measured bound ATP, but since these were revitalized sites, the differences between total and bound ATP were small (up to 10 %), as opposed to other previously studied matrices [28]. For this reason (and because it is simpler for potential operational measurements), we decided to measure only total ATP at the bathing ponds.
P. aeruginosa was analysed using an optimised method for bathing waters (i.e. for waters with a high content of accompanying microflora) [35]. Chlorophyll-a was determined according to the procedure specified in ČSN ISO 10260 [36].
Basic chemical analysis included organic carbon, total nitrogen, inorganic forms of nitrogen (nitrite, nitrate, and ammoniacal), orthophosphate phosphorus, total phosphorus, dissolved oxygen, and pH value. Water transparency was measured on site using a Secchi disk, and the concentration of dissolved oxygen (as well as oxygen saturation and water temperature) was measured with a Hach LDO HQ 10 oximeter with an optical probe, at three depths: 30 cm, 1 m, and 2 m. As the values did not vary significantly with depth, only the ‘surface’ values (i.e. 30 cm below the surface), where all samples for analysis were taken, are reported. pH value was measured immediately after transfer to the laboratory using a WTW inoLab® pH level 2 meter with a combined THETA 90 electrode. Organic carbon and total nitrogen were determined using a Shimadzu TOC-V CPH analyser. Spectrophotometric methods in accordance with ČSN EN 26777 [37], ČSN ISO 7890-3 [38], and ČSN ISO 7150-1 [39] were used to determine nitrite, nitrate, and ammoniacal nitrogen. For the determination of orthophosphate phosphorus and total phosphorus (after mineralisation with peroxodisulphate), the spectrophotometric molybdenum blue method was used in accordance with ČSN EN ISO 6878 [40]. Samples were filtered through Whatman GF/C glass fibre filters. The concentration of organically bound nitrogen was calculated as the difference between the total nitrogen (NT) concentration and the sum of the inorganic forms of nitrogen (N-NO2–, N-NO3– a Namo).
RESULTS
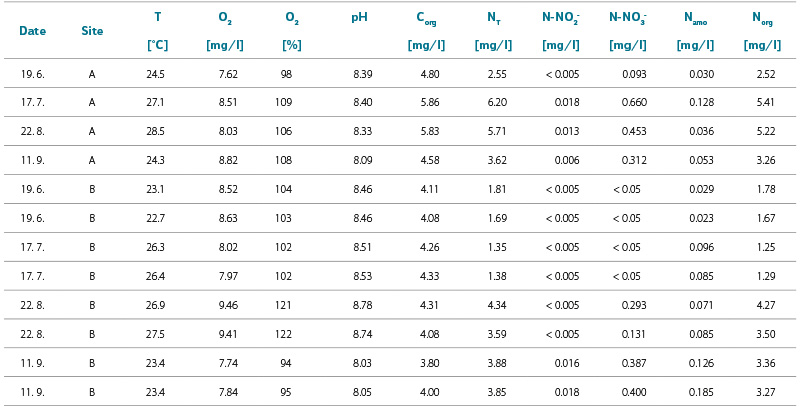
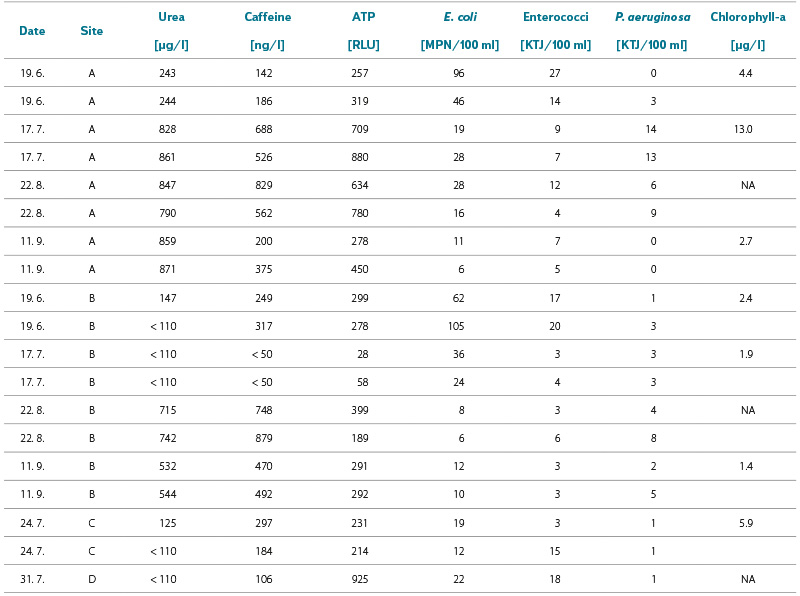
The following tables present the results of all analyses carried out during the 2023 bathing season. Tab. 2 shows the basic chemical analysis at bathing ponds A and B, while Tab. 3 presents the results for caffeine, urea, and microbiological and biological indicators (E. coli, intestinal enterococci, P. aeruginosa, total ATP, and chlorophyll) in all four bathing ponds.
Tab. 2. Basic chemical analysis; at site A, only one sample was taken from the bathing area for basic chemical analysis
Tab. 3. Results of caffeine, urea, total ATP, microbiological and biological indicators detection (NA = not analyzed)
Basic chemical indicators
The values of chemical indicators in bathing ponds A and B (Tab. 2) demonstrate a very low level of pollution by both organic substances and nitrogen compounds. The concentrations of orthophosphate and total phosphorus were below the detection limits in all samples, which are 0.03 mg/l and 0.04 mg/l, respectively (not shown in the table). The water trophic potential is therefore very low, and any development of phytoplankton is strongly limited by phosphorus. This is reflected in the low concentrations of chlorophyll-a (Tab. 2). During the bathing season, a slight increase in the concentration of organically bound nitrogen was observed at both sites, occurring as early as June at site A, and only during summer holidays at site B. The highest recorded concentrations of Norg were 5.41 mg/l at site A and 4.27 mg/l at site B. The concentration of ammoniacal nitrogen fluctuated, with no clear consistent increase, trend, or correlation observed between the concentrations of Namo and Norg. Nitrite nitrogen concentrations were usually below or just above the detection limit (0.005 mg/l), and nitrate nitrogen concentrations were also very low. Transparency at both monitored sites always reached the bottom (3.25 m), except for the August measurement at site B, when it was only 2 m (chlorophyll-a was unfortunately not determined on that day). In terms of organic matter content, the water was only minimally polluted, and during the summer a slight increase in the concentration of Corg was observed, which, together with the temperature drop in September, fell back to the June level. pH values at both sites ranged within the mildly alkaline range. Changes in pH can be attributed to ongoing photosynthesis. The concentration of dissolved oxygen remained around or slightly above the equilibrium value throughout the monitored period at both sites, except for the August measurement at site B, where oxygen saturation rose to 122 %, possibly due to relatively intense photosynthetic activity of the present producers. Apart from this isolated fluctuation, none of the monitored indicators changed significantly over time. This suggests chemical stability of the water and, considering the low concentrations of nutrients and organic substances, also high efficiency of the water’s self-purification. Comparison of the measured indicator values from two sampling points at site B shows that the water in the bathing area is very well mixed.
The chemical indicators included in the basic analysis provide information on water quality and the effectiveness of self-purification processes; however, some determinations, such as organic carbon, do not give information on the nature of the pollution. Therefore, they are mainly suitable as supplementary parameters. The most promising results are those for total nitrogen (NT), which show higher values from July onwards at site A, and from August (with the site out of operation in July) at site B, compared to the beginning of the season.
Microbiological and biological indicators
Tab. 3 presents microbiological and biological indicators for all four sites. Nearly all E. coli and intestinal enterococci numbers complied with current legislative requirements (in accordance with Decree No. 238/2011 Coll. of the Ministry of Health), i.e. 100 CFU (MPN)/100 ml and 50 CFU/100 ml, respectively, and P. aeruginosa numbers exceeded the former limit value of 10 CFU/100 ml in only one sample. Total ATP values corresponded with our theoretical expectations: at site A, they were significantly higher in July and August during peak visitor numbers, and lower in June and September. At site B, they were lowest in the July sample, when the bathing pond was out of operation due to technical reasons. Despite high ATP values (above 200, and even exceeding 500 RLU), no elevated E. coli numbers were recorded at the same time, in contrast with urban water features [41]. This suggests the presence of different, much more natural microbial communities, and in this case ATP did not demonstrate a direct indicative value for faecal contamination. On the other hand, the presence of opportunistic pathogens associated with anthropogenic pollution cannot be entirely ruled out. As results of ATP determination in surface waters, including bathing and natural ponds, have not yet been published, we are unable to compare or discuss them further.
Chemical indicators of anthropogenic pollution – caffeine and urea
The results of the urea and caffeine analyses are also presented in Tab 3. The measured values were predominantly above the limit of quantification, with the highest concentrations again recorded during the summer period when visitor numbers peaked (with the exception of site B, which was out of operation in July; the values recorded at that time were therefore the lowest). The results for both indicators showed a certain degree of correlation (R² = 0.82). A degree of correlation was also observed between caffeine and ATP (R² = 0.65), and between ATP and urea (R² = 0.66). The coefficients of variation for duplicate samples ranged from 9 to 26 % for caffeine determination and from 5 to 48 % for urea determination. These correlations are also illustrated in Figs. 5a and 5b.
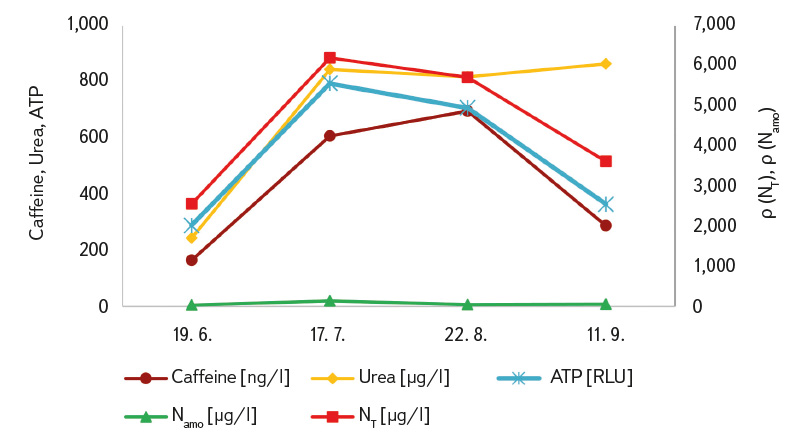
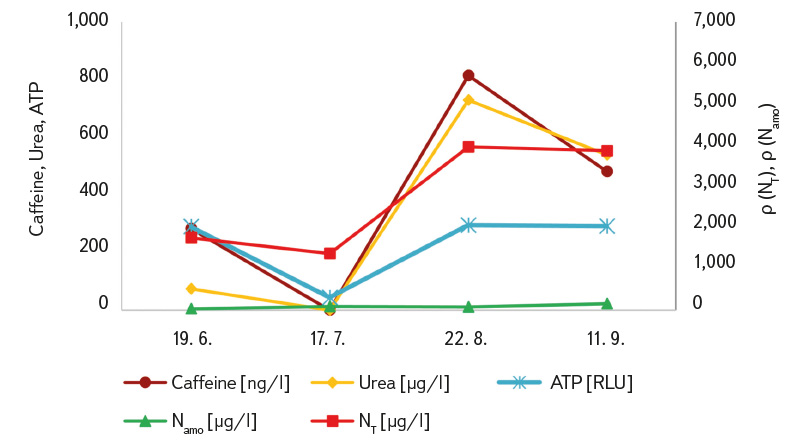
Fig. 5 a, b. Seasonal course of average concentrations (from sites A and B) for caffeine, urea, ATP, ammonia (Namo) and total nitrogen (NT)
DISCUSSION
The work presented in this article builds upon our previous study of bathing waters [16], which, however, focused on significantly larger water bodies (ponds and sand pits) with relatively lower visitor numbers (i.e. a higher ratio of water volume to anthropogenic pollution input). As a result, caffeine and urea concentrations were considerably lower than those observed in the bathing ponds and only rarely exceeded the limit of quantification (for comparison, caffeine (in ng/l): Mělice sand pit < 50–170, Šeberák pond < 50–204, Pilský pond 84–93, Poděbrady sand pit < 50–121, Eliška pond < 50–296). Measured values in lakes reported in the cited literature were also lower; for example, in Maine (USA), concentrations ranged from 6 to 11 ng/l, with a maximum of 21 ng/l [18]. The anthropogenic load of bathing ponds is therefore more comparable to that of artificial swimming pools, where average caffeine concentrations of up to 1,540 ng/l [21] and 1,140 ng/l [22] have been reported. High concentrations of urea have also been detected in swimming pools, namely 3.5–5.5 mg/l [9], 0.07–18.73 mg/l [10], and 0.74–15.62 mg/l [11]. Zhang et al. [10] also report that the average volume of urine released per swimmer could be between 25 and 77 ml. Urea is considered the main nitrogen-based contaminant introduced into pool water by swimmers and is therefore an important indicator of water quality and hygiene in swimming pools. In China, it is regulated at 3.5 mg/l (i.e. 3,500 µg/l; our highest recorded value was 871 µg/l).
Relatively high caffeine concentrations in the bathing ponds were recorded despite the fact that only a small proportion (0.5–10 %) of caffeine is excreted in unchanged form [14], and metabolites were not analysed.
Among other (as yet unpublished) results, caffeine concentrations were as follows: wastewater outflow system (1,160 ng/l), treatment pond (273 ng/l), fishing pond (upper section 66 ng/l, lower section < 50 ng/l), and bathing pond (258 ng/l). Urea in these samples was mostly below the limit of quantification, probably having already degraded into ammonium ions, with detected concentrations of 916, 471, 161, 250, and 185 µg/l. These results also indicate that caffeine and urea levels are higher in bathing ponds than in ponds of any other type.
The indicators we monitored (particularly caffeine, urea, as well as ATP and total nitrogen) exhibited a significant seasonal pattern in the bathing ponds (Fig. 5). Therefore, results for the entire season cannot be averaged; each individual measurement must be evaluated separately. At site B, high ‘summer’ caffeine and urea values were already recorded during the peak bathing season of 2022 (27 July at a concentration of 993 ng/l and 12 August at 432 ng/l; results not previously published), which are comparable to the values we measured during the same period in 2023. Although duplicate samples (in 2023 always taken from two different locations within the bathing area) generally showed only minor differences (mostly within 20 %) in some cases greater variation between duplicates was observed (caffeine 9–26 %, urea 5–48 %). Therefore, especially for newly tested bathing ponds, it would be advisable to collect multiple samples or, preferably, to always take a composite sample.
Confirmation of the correlation between caffeine concentration and the actual number of bathers can be found in the work of Lempart et al. [42], who conducted caffeine monitoring deliberately unaffected by current pool attendance (early morning). The highest average caffeine concentration detected was only 12.81 ng/l at the waterslide, while the average concentration in the swimming zone of the pool was 3.68 ng/l.
Although this research has yielded many interesting insights, it has also raised a number of further questions that would be advisable to address, especially in connection with anticipated future changes to Czech legislation. The indicators currently used to assess water quality in bathing ponds are inadequate (in addition, results take three days to obtain) and do not fully capture the main issues at the sites. In contrast with natural swimming waters, the situation in bathing ponds can be influenced, for example, by increasing the intensity of purification processes. Furthermore, these findings can be used when establishing new bathing ponds. However, for the actual operation of bathing ponds, there is a particular lack of operational indicators that provide rapid results, which the operator can determine independently and use to adjust management in a timely manner. Unfortunately, the determination of caffeine, urea, or total nitrogen does not meet this requirement, as these analyses must be carried out in a laboratory. The potential use of in situ total ATP measurement will require further study, particularly its variations in the treatment section, which is highly biologically active. From a hygiene perspective, it is important to consider the long-term loading of bathing ponds. Prolonged and high loading of bathing ponds may also introduce numerous other substances (such as pharmaceuticals, hormones, cosmetic residues) and occasionally pathogenic microorganisms originating from the skin or mucous membranes, even in cases where existing indicators of faecal contamination do not exceed prescribed limits. This was confirmed, for example, in the case of the occasional ear pathogen Pseudomonas otitidis in bathing ponds during the peak bathing season [35], when the highest counts were found at the end of the season. However, no correlation was observed with caffeine or urea. For monitoring long-term loading, caffeine, urea, and total nitrogen could find application. However, caffeine determination is expensive and is carried out in only a limited number of laboratories. Similarly, urea analysis is not commonly available in laboratories and is relatively labour-intensive. From this perspective, total nitrogen appears the most promising, as it is measured by more laboratories and is more affordable.
CONCLUSION
Bathing ponds are unique systems in which living organisms play a key role in maintaining water quality, while simultaneously a large number of people bathe in a relatively small area during the peak season. Although bathing ponds have been studied for some time, the knowledge gained remains limited and further questions continue to arise. The prevailing pollution is of anthropogenic origin (with bathers representing the main source of contamination), and the monitored indicators of anthropogenic load (caffeine and urea) reach values of over 500 ng/l and µg/l, respectively, during the peak summer season. The indicators prescribed by current legislation (faecal contamination indicators E. coli and intestinal enterococci) did not reflect the increased anthropogenic load. The results of total ATP determination proved to be of interest, but further research is needed, particularly in the treatment zones, which are highly microbiologically active (including its relationship with overall biological activity, etc.). Total nitrogen could be a suitable indicator for tracking the gradual increase in anthropogenic load throughout the season.
Acknowledgements
The article was supported by the Ministry of Health of the Czech Republic – RVO (National Institute of Public Health – NIPH, Company ID 75010330). We thank the operators of natural bathing ponds for allowing sampling and for providing valuable additional information.
ABBREVIATIONS
ATP – adenosine triphosphate
IS PiVo – information system for drinking and bathing water
RLU – relative light unit
CFU – colony-forming unit
MPN – most probable number
NT – total nitrogen
The Czech version of this article was peer-reviewed, the English version was translated from the Czech original by Environmental Translation Ltd.
