

ABSTRACT
Changing climatic and hydrological conditions affect the quality of water in streams and reservoirs. A number of studies have been published on this topic, mostly focussing on specific areas and conditions. However, sufficiently long and detailed time series of flow and water quality data are available in the Czech Republic to enable detailed analysis; this can identify the types of relationships that prevail under different catchment characteristics and pollution sources.
Selected methods were applied to a test dataset comprising water quality data for 2010–2019, supplemented by hydrological characteristics derived from long-term flow time series. For this study, long-term water quality monitoring profiles were selected for which reasonably accurate flow data at the time of sampling, as well as general catchment characteristics, were available.
Measured concentrations of the monitored determinants were compared with hydrological conditions, quantified using the flow percentile on the sampling date based on the long-term flow time series. Concentration-discharge (C–Q) relationships for selected substances can be divided into three categories: chemostasis, where concentrations remain constant or vary independently of discharge; enrichment, where concentrations increase with increasing flow; and dilution, where concentrations decrease with increasing discharge. Which of these relationships prevails, or whether several relationships occur in combination, depends on both the properties of the substances and catchment characteristics. In some cases, the observed relationship can be used to identify the predominant source of pollution in a catchment.
The aim of this article is to highlight the potential of statistical methods for optimizing monitoring campaigns and identifying the key factors and catchment characteristics that influence C–Q relationships.
INTRODUCTION
Climate change in recent decades has affected the hydrological characteristics of watercourses, as demonstrated by long-term monitoring in the Czech Republic [1]. In addition to declining mean flows, drought episodes are becoming more frequent and prolonged, while extreme runoff events are also occurring more frequently. These changes have consequences for water quality, potentially causing serious problems given that many water bodies already fail to meet the requirements for good chemical and ecological status. Despite numerous measures, improvement is slow or non-existent and, in some cases, conditions are deteriorating [2].
A number of studies have examined on the relationships between the quantitative and qualitative characteristics of watercourses in different types of catchments and under different hydrological conditions. Most studies focus on natural catchment chemistry [3, 4] and nutrients [5, 6], with less attention paid to other substances such as pharmaceuticals or pesticides. The relationship between concentration and flow (C–Q) is used as a metric for this purpose and is strongly influenced by both catchment characteristics [7] and predominant pollution sources, including legacy pollution [8]. The relationship manifests itself differently in longer time series based on less frequent monitoring than in high-resolution time series, in which relationships typical of rainfall–runoff events can be identified [9]. The factors determining the behaviour of substances in a catchment may also act in combination, as demonstrated by the model for nitrates developed by Minaudo et al. [10], which incorporates both seasonal patterns and individual events with largely opposing effects.
Understanding these relationships can help identify pollution sources, model responses to climate change or, conversely, to proposed mitigation measures, and improve estimates of constituent loads exported from catchments. Data preparation methods were therefore tested on a selected dataset, and selected results are illustrated in a series of graphs.
The purpose of this study was to compile a sufficiently robust dataset for the Czech Republic combining hydrological and water quality characteristics of watercourses, while testing which data and methods could be used for this purpose and identifying their limitations. A further aim was to analyse the data to determine whether findings reported in the literature also apply under conditions in the Czech Republic and to establish the extent to which methods used for general chemical parameters can be applied to other, less frequently monitored substances. A series of simple graphs generated using a consistent procedure is intended to illustrate the methods and general patterns and help identify the parameters, relationships and types of watercourses that warrant more detailed investigation.
METHODOLOGY
The relationship between water quality and quantity is most commonly determined using paired measurements of concentration and discharge at the time of sampling. Both simple statistical approaches and advanced modelling methods are used to analyse these relationships, including linear and nonlinear regression, correlation analysis and multivariate statistical methods [3, 7].
Linear regression is used when an approximately linear relationship between variables is assumed, although its application is constrained by the requirement for normally distributed residuals. This is particularly problematic for hydrological data, as concentrations and flows typically have strongly skewed distributions. For this reason, one or both variables are often log-transformed, which stabilizes variability in the data and allows the linear relationship to be better approximated in the transformed space [4, 7].
Correlation coefficients, particularly Pearson’s and Spearman’s, are also used to assess the relationship between concentration and flow. Spearman’s rank correlation coefficient is preferred when the data do not meet the assumption of normality or when the relationship is nonlinear or monotonic [9].
More advanced approaches include regression and semiparametric models, such as generalized linear models (GLMs), generalized additive models (GAMs), and mixed-effects models with random effects. Specialized approaches for estimating constituent transport are also frequently used in hydrology, including WRTDS (Weighted Regressions on Time, Discharge, and Season), which can better capture seasonality and long-term trends in the data.
When several explanatory variables are available, multivariate statistical methods such as factor analysis, cluster analysis, or principal component analysis can be used to help identify the dominant processes affecting the export of constituents from catchments [6].
Relating concentrations to flow percentiles is useful for identifying system behaviour under extreme conditions, such as high or low flows. This approach is often used to interpret concentration–discharge (C–Q) relationships [3, 7]. The advantages of this method are its simplicity and interpretability, and the fact that it can be applied even when data are limited or include values below the detection limit.
For this study, mean concentrations were compared across flow percentiles, primarily because of the method’s simplicity, clarity, and ability to illustrate the basic principles underlying the relationship between hydrological conditions and constituent transport. However, it should be emphasized that any analysis of this type is highly dependent on appropriate data preprocessing, which is essential for reliable interpretation of the results.
Selection of monitoring sites
To make the statistical analysis as robust as possible, the dataset needs to be as complete as possible. The limiting factors in selecting monitoring profiles were temporal coverage, the availability of data for the broadest possible range of parameters, and the possibility of obtaining flow data for the time of sampling. For this study, profiles were selected where water quality had been monitored monthly for ten years, measurements were available not only for general parameters relating to oxygen conditions and nutrients but also for other substances, and a suitable hydrological gauging station could be assigned. To obtain hydrological data, each water quality monitoring profile was matched with the nearest hydrological gauging station upstream or downstream. Gauged flows were adjusted according to the ratio of catchment areas. Profiles with a catchment area ratio greater than 4 or less than 0.2 were excluded.
Parameter selection
Parameter selection was based primarily on data availability. Particular emphasis was placed on parameters responsible for failure to achieve good status under the Water Framework Directive [11], and preference was given to monitoring profiles for which a broader range of parameters was available. Operational monitoring data from 2010–2019 were used, and parameters for which insufficient measurement data were available were excluded; the parameters included in the analysis and the abbreviations used in the graphs are listed in Tab. 1.
Tab. 1. Number of available values
| Parameter – name | Number of profiles with measurements | Number of values | Number of values below the detection limit | Abbreviation (in graphs) |
|---|---|---|---|---|
| Acetochlor | 127 | 9.299 | 8.846 | ACETOCHLOR |
| Acetochlor metabolites | 132 | 9.411 | 9.063 | ACETOCHLOR-MB |
| Aluminium | 126 | 10.532 | 1.527 | AL |
| Alachlor | 132 | 10.197 | 10.091 | ALACHLOR |
| Alachlor-ESA | 120 | 5.856 | 2.666 | ALACHLOR-ESA |
| Alachlor metabolites | 122 | 6.594 | 6.578 | ALACHLOR-MB |
| Alachlor-OA | 120 | 5.856 | 5.661 | ALACHLOR-OA |
| AMPA | 126 | 6.803 | 2.122 | AMPA |
| Adsorbable organically bound halogens | 134 | 14.457 | 122 | AOX |
| Arsenic | 133 | 14.384 | 4.146 | AS |
| Benzo[a]pyrene | 133 | 9.832 | 3.794 | B-A-PYRENE |
| Benzo[b]fluoranthene | 133 | 9.833 | 3.077 | B-B-FLUORANTHENE |
| Benzo[g,h,i]perylene | 133 | 9.831 | 3.476 | B-GHI-PERYLENE |
| Brominated diphenyl ether | 114 | 6.534 | 5.432 | BROMDIPHENYL ETHER |
| Five-day biochemical oxygen demand | 138 | 16.135 | 19 | BOD-5 |
| Calcium | 138 | 15.726 | 0 | CA |
| Cadmium | 131 | 11.456 | 7.349 | CD |
| Cadmium – dissolved | 137 | 18.262 | 13 | CD-D |
| Iron – total | 132 | 13.585 | 142 | FE-TOTAL |
| Fluoranthene | 133 | 9.839 | 343 | FLUORANTHENE |
| Metazachlor | 128 | 9.522 | 8.051 | METAZACHLOR |
| Metolachlor | 127 | 9.507 | 7.95 | METOLACHLOR |
| Metolachlor metabolites | 132 | 9.643 | 8.381 | METOLACHLOR-MB |
| Naphthalene | 133 | 9.666 | 2.557 | NAPHTHALENE |
| Ammoniacal nitrogen | 138 | 16.158 | 1.903 | N-NH4 |
| Nitrate nitrogen | 138 | 16.053 | 62 | N-NO3 |
| Total nitrogen | 138 | 14.047 | 8 | N-TOTAL |
| Lead | 131 | 11.485 | 4.31 | PB |
| Lead – dissolved | 137 | 18.268 | 10.696 | PB-D |
| Phosphate phosphorus | 138 | 15.363 | 864 | P-PO4 |
| Total phosphorus | 138 | 16.034 | 25 | P-TOTAL |
Method for assessing hydrological conditions
Daily flows from continuously monitored hydrological gauging stations were used to assess hydrological conditions. Flow percentiles were determined for each profile based on long-term daily flow series for 1980–2019; in a few cases, only shorter series were available, but these covered at least the period 2002–2019.
The adjusted flow at the time of water quality sampling was compared with the corresponding adjusted percentile and assigned to the appropriate group. This made it possible to determine whether flow at the time of sampling was significantly higher or lower than usual.
Catchment characteristics
For each water quality monitoring profile, the catchment area and the proportions of arable land and urban development within the catchment were determined. The catchments were then classified as small (< 500 km²), medium-sized (500–2,000 km²), or large; as having a high (> 60%), medium (20–60%), or low proportion of arable land; and as having a high (> 5%), medium (1–5%), or low proportion of urban development (≤ 1%). The purpose of this classification was to determine which factors influence the relationships between water quality and hydrology – for example, whether small watercourses are more sensitive to periods of drought or, conversely, to extreme rainfall–runoff events, and whether the likely dominant influence of different types of pollution can be distinguished on the basis of the type of relationship. The number of profiles in each group is shown in Tab. 2. To allow conditions in large and small catchments to be compared, profiles in the lower reaches of watercourses were retained in the dataset even where their catchments overlapped with those of upstream profiles.
Tab. 2. Number of profiles
| Small | Medium | Large | |
|---|---|---|---|
| High proportion of arable land, high proportion of urban land | 6 | 3 | 1 |
| High proportion of arable land, medium proportion of urban land | 10 | 13 | 5 |
| High proportion of arable land, low proportion of urban land | 2 | 1 | 0 |
| Medium proportion of arable land, high proportion of urban land | 5 | 6 | 4 |
| Medium proportion of arable land, medium proportion of urban land | 7 | 17 | 17 |
| Medium proportion of arable land, low proportion of urban land | 1 | 7 | 0 |
| Low proportion of arable land, high proportion of urban land | 7 | 1 | 0 |
| Low proportion of arable land, medium proportion of urban land | 10 | 3 | 0 |
| Low proportion of arable land, low proportion of urban land | 10 | 1 | 1 |
This resulted in 138 partially overlapping catchments varying in their characteristics (Fig. 1).
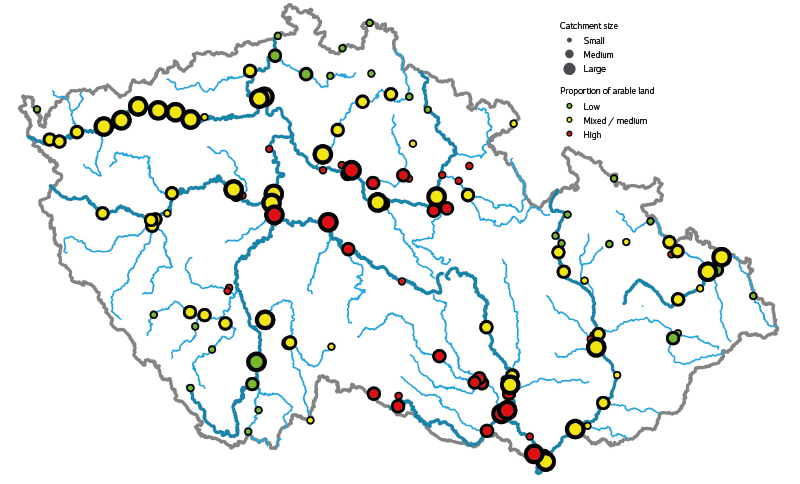
Fig. 1. Location and type of profiles (dot size indicates small, medium and large catchments; green, yellow and red indicate a small, medium and large share of arable land, respectively)
RESULTS
Trends
Although the selected catchments cannot be considered representative for assessing hydrological conditions across the Czech Republic, they nevertheless show a slight downward trend in mean flows since the 1980s, as well as the dry period in the second half of the 2010s. Fig. 2 shows the mean flow across all monitored catchments. The fitted linear trend is downward, although this may be distorted by several dry years at the end of the study period.
The water quality data cannot be considered representative either; nevertheless, trends at the selected profiles are consistent with those previously reported. Fig. 3 shows trends in the average annual concentrations of selected indicators at the monitored profiles. To allow comparison between indicators, changes in concentration are expressed not in the original units but as a percentage of concentrations at the beginning of monitoring. Most indicators show a very slight decline or remain stable, while phosphate phosphorus shows an increase.
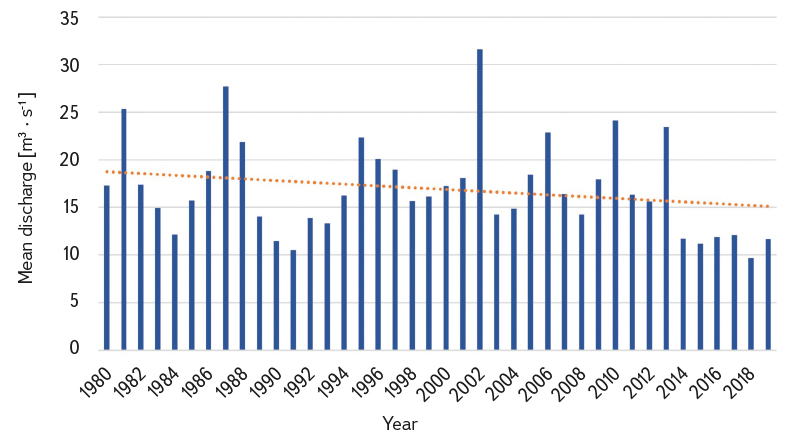
Fig. 2. Average flow rate of the test dataset (m³/s)
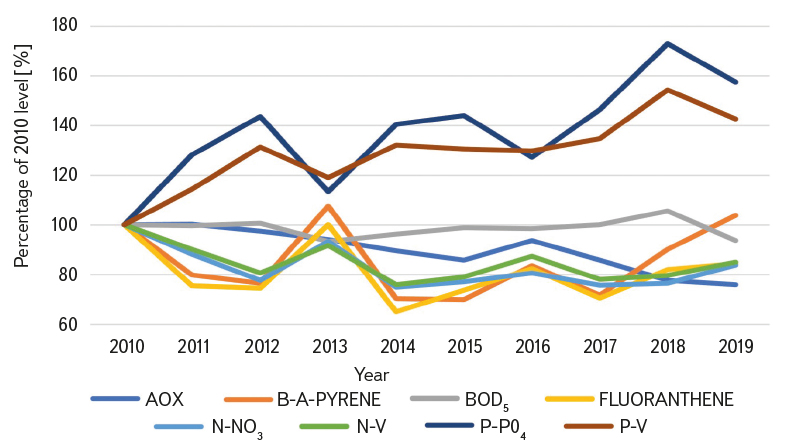
Fig. 3. Development of average annual concentrations of selected indicators in tested profiles (as a percentage of 2010 levels)
Seasonality
An important factor that needs to be taken into account is seasonal variation in both flow and water quality. Low flows are generally more frequent during the summer months, while high flows regularly occur in March and April. This is also reflected in the monthly distribution of samples among flow percentiles.
Fig. 4 shows the number of samples collected at different flow percentiles. Figs. 5 and 6 show the distribution of samples among flow percentiles by month and year, respectively. Samples collected during the summer months were clearly more likely to coincide with the lowest flows.
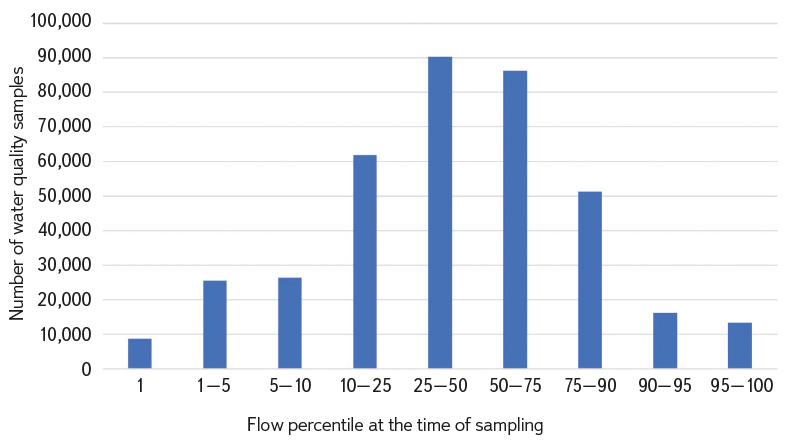
Fig. 4. Number of samples by flow percentile at the time of sampling
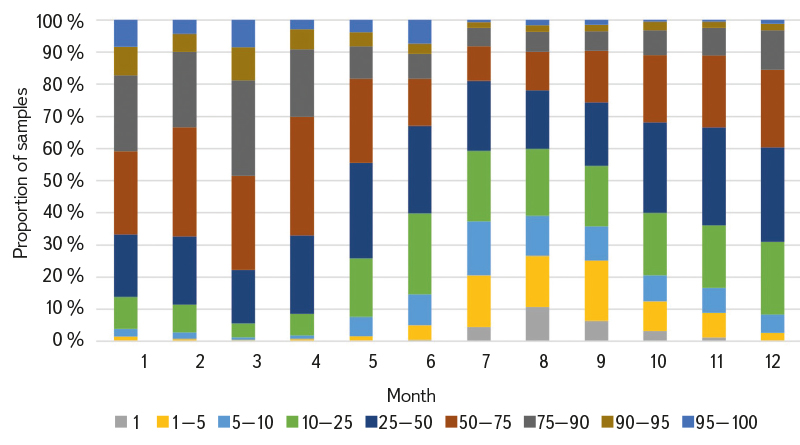
Fig. 5. Number of samples by flow percentile at the time of sampling in each month
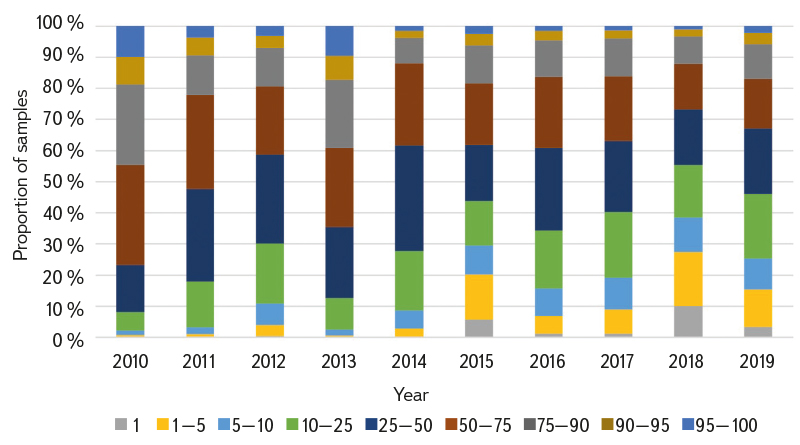
Fig. 6. Number of samples by flow percentile at the time of sampling in each year
Seasonal variation also affects the monitored water quality parameters. Higher nitrogen concentrations in winter and phosphorus concentrations in summer were confirmed. The occurrence of pesticides and some of their metabolites is also seasonal, as clearly demonstrated in Figs. 7–9. These figures show the occurrence of metabolites of alachlor (banned in 2008) and metolachlor (authorized during the data collection period). Although these substances were analysed regularly, measurable concentrations were detected in only some samples, making it necessary to include results below the limit of quantification (LOQ). Comparison of the two parameters shows the seasonal occurrence of the substance still in use, in contrast to the constant occurrence of metabolites of the banned substance, both in terms of detection frequency and measured concentrations.
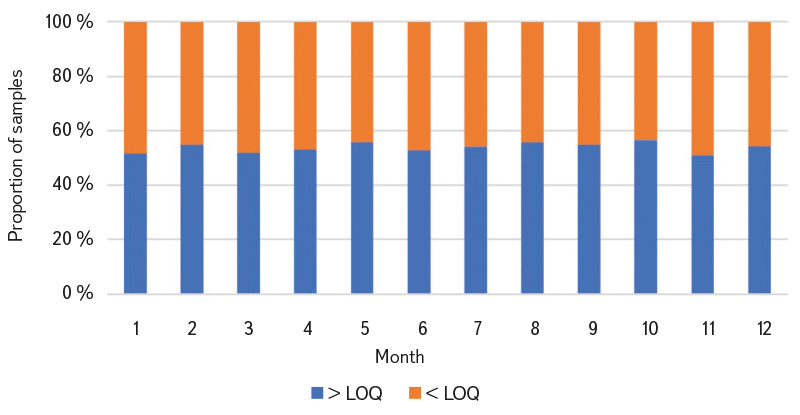
Fig. 7. Alachlor – ESA – numbers of records below and above the limit of quantification in each month
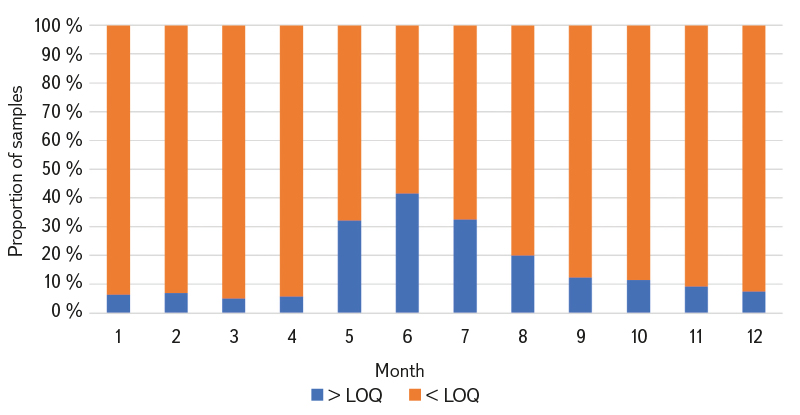
Fig. 8. Metolachlor – numbers of records below and above the limit of quantification in each month
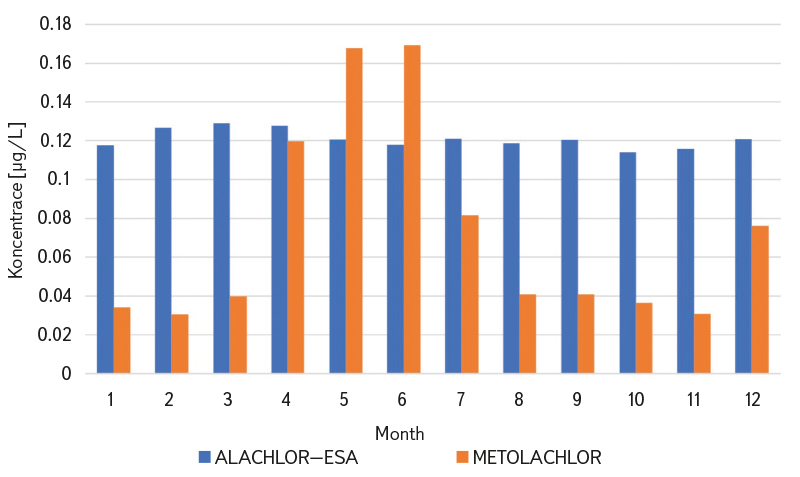
Fig. 9. Alachlor – ESA and Metolachlor – average measured concentrations in each month
C-Q relationships
Using the C–Q slope method, relationships between concentration and discharge can be divided into three basic types:
- chemostasis, where concentration remains more or less constant regardless of discharge,
- enrichment, where concentration increases with increasing discharge,
- dilution, where concentration decreases with increasing discharge.
Chemostasis
Chemostatic behaviour of substances can be attributed to stable long-term stores within the catchment and the significant influence of groundwater.
Arsenic provides an example of chemostasis in the test dataset: its concentration varies little with discharge, with only a slight increase during extreme drought events, and even this increase is not particularly pronounced (Fig. 10).
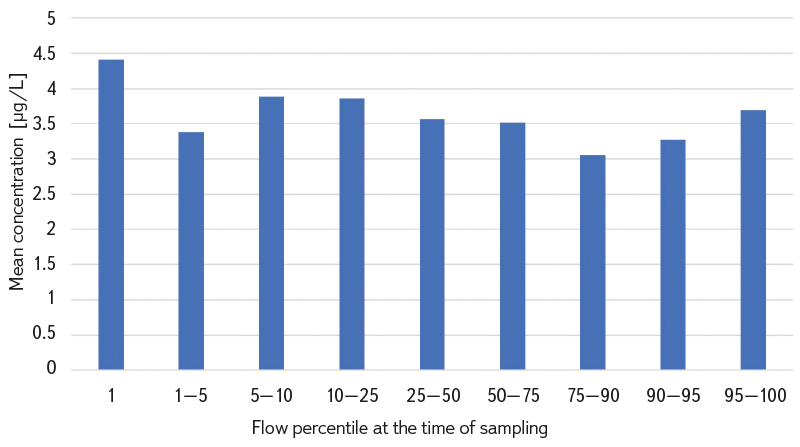
Fig. 10. Average arsenic concentrations (µg/L) by flow percentile – example of a chemostatic relationship
Enrichment
Enrichment is a relationship in which concentration increases with increasing discharge. It is typical of substances bound to sediment and those strongly influenced by surface runoff. In the test dataset, iron provides a clear example of enrichment (Fig. 11): concentrations remain stable at below-average and average flows, increase slightly at higher flows, and then rise severalfold under extreme flow conditions.
A similar pattern can be observed for some polycyclic aromatic hydrocarbons (PAHs) (Fig. 12), with concentrations remaining stable under normal conditions but in some cases increasing sharply at higher discharges.
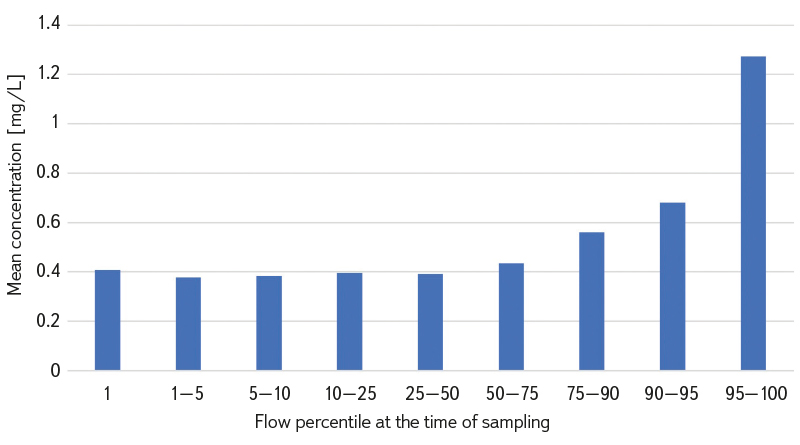
Fig. 11. Average iron concentrations (mg/L) by flow percentile – example of enrichment
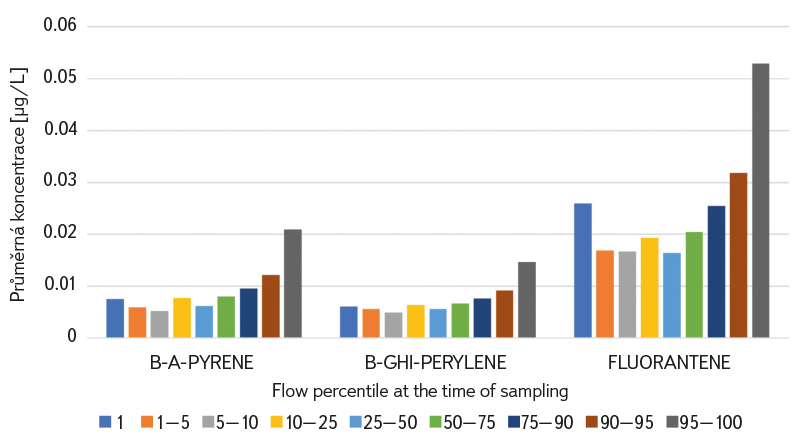
Fig. 12. Average concentrations of selected polycyclic aromatic hydrocarbons (µg/L) by flow percentile – example of enrichment
A somewhat different enrichment pattern is seen for nitrate nitrogen (Fig. 13): concentrations increase progressively across the flow range, while the additional increase under extreme flow conditions is only slight.
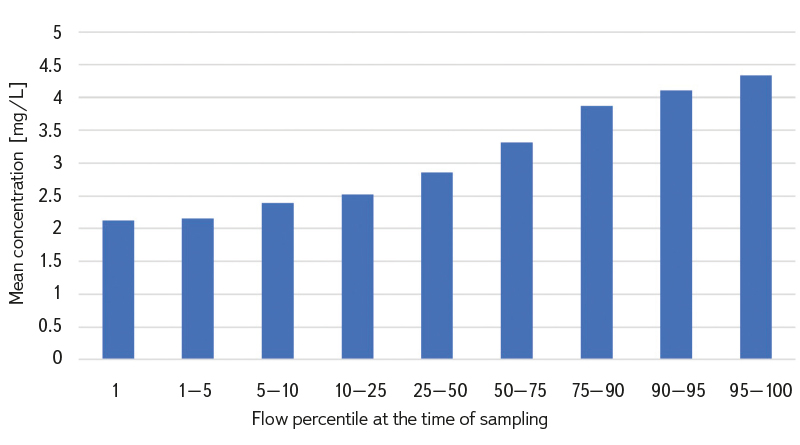
Fig. 13. Average nitrate nitrogen concentrations (mg/L) by flow percentile – example of another type of enrichment
Dilution
A relationship in which concentration decreases with increasing discharge may occur for substances entering surface waters primarily from groundwater; their decline may indicate a decreasing contribution of baseflow relative to surface runoff (e.g. calcium, Fig. 14). In some cases, however, dilution can also indicate pollution from point sources, which is independent of hydrological conditions.
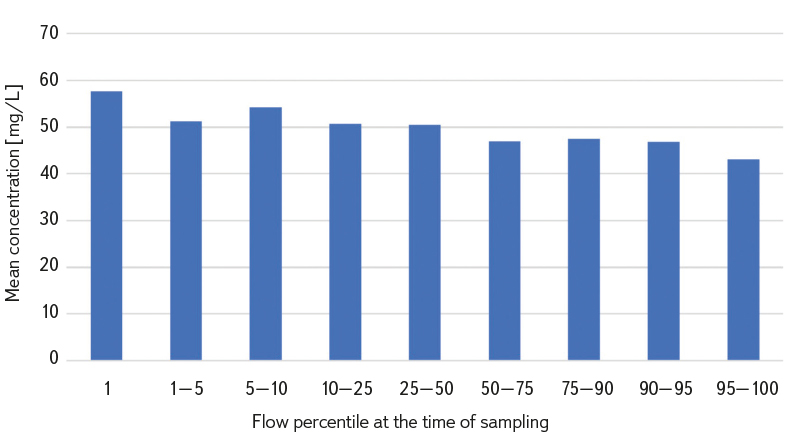
Fig. 14. Average calcium concentrations (mg/L) by flow percentile – example of dilution
Combination
The resulting pattern may reflect a combination of several factors, with extremes occurring at both ends of the flow range. Fig. 15 shows a classic dilution pattern for phosphate phosphorus. Total phosphorus follows a broadly similar pattern at lower flows, but concentrations increase again at high flows.
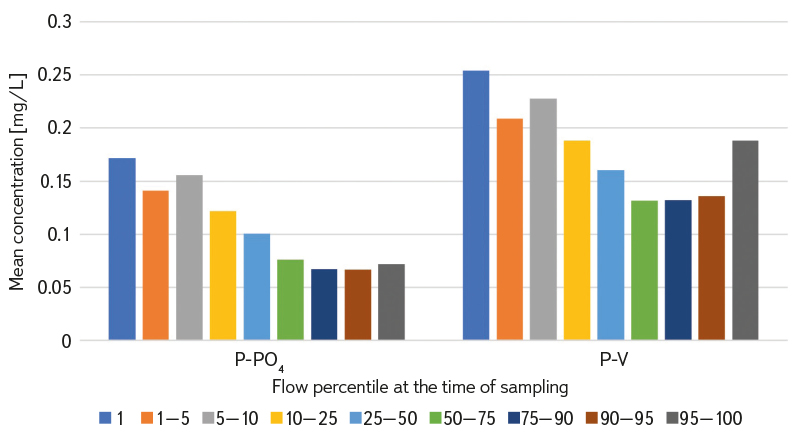
Fig. 15. Average concentrations of phosphate phosphorus (dilution) and total phosphorus (combination of dilution and enrichment) (mg/L) by flow percentile
Influence of catchment characteristics
Catchment characteristics have a major influence on the relationship between hydrology and water quality. The basic characteristics examined – catchment size and the proportions of arable and urban land – also proved important in the test dataset. The following figures illustrate these effects using nutrients as examples.
Figs. 16 and 17 compare nitrate nitrogen and total phosphorus concentrations in small (< 500 km²) and large (> 2,000 km²) catchments. At average and high flows, nutrient concentrations are almost identical in small and large catchments, whereas differences emerge at low flows, with higher concentrations particularly evident in small catchments. For total phosphorus, this pattern occurs in both large and small catchments but is considerably more pronounced in small catchments. For nitrate nitrogen, concentrations in large catchments continue to decline at low flows, whereas those in small catchments remain similar to concentrations at intermediate flows.
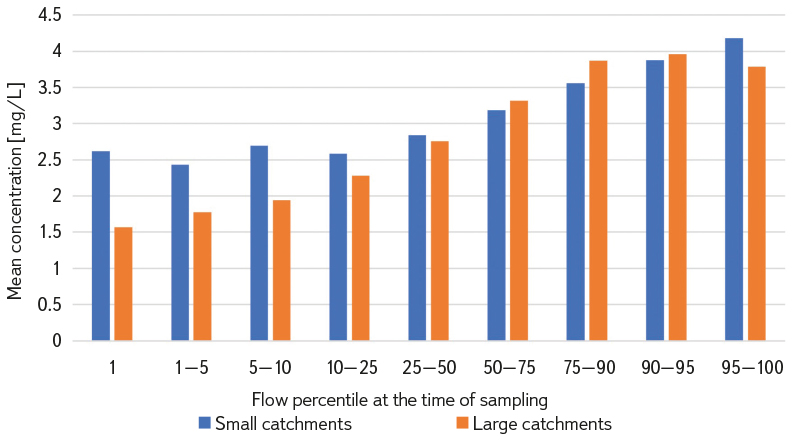
Fig. 16. Differences in the C–Q relationship for nitrate nitrogen (mg/L) by catchment size
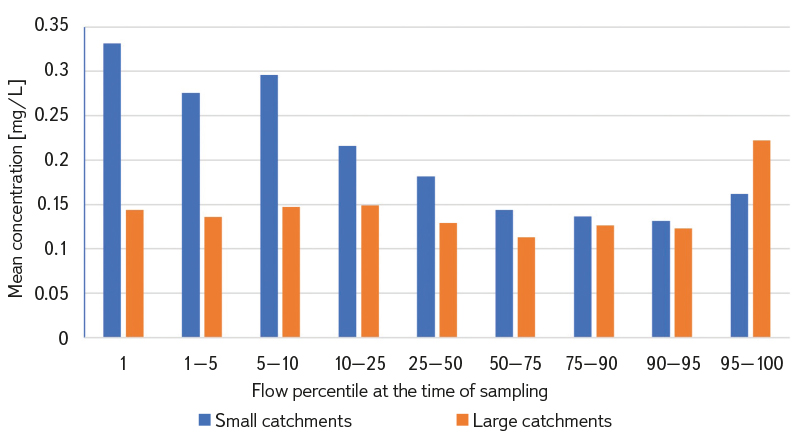
Fig. 17. Differences in the C-Q relationship for total phosphorus (mg/L) by catchment size
The differences are even more pronounced between catchments with high and low proportions of arable land (Figs. 18 and 19). For total phosphorus, the overall pattern is broadly similar, but concentrations are considerably higher in catchments with a high proportion of arable land. For nitrate nitrogen, however, the patterns are completely opposite. In catchments dominated by arable land, nitrate concentrations increase with increasing discharge, whereas in catchments with a low proportion of arable land they remain constant or even decrease.
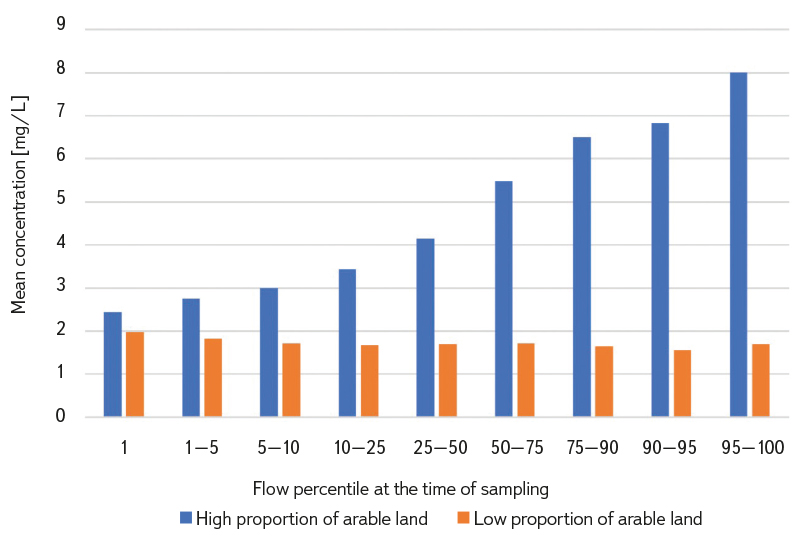
Fig. 18. Differences in the C-Q relationship for nitrate nitrogen (mg/L) by proportion of arable land in the catchment
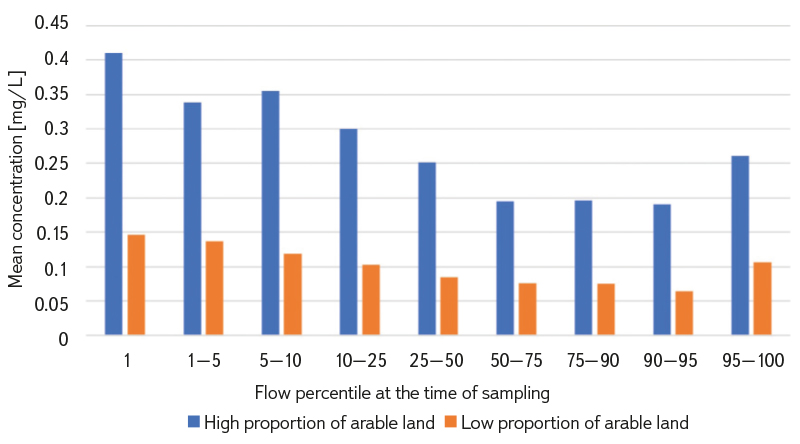
Fig. 19. Differences in the C-Q relationship for total phosphorus (mg/L) by proportion of arable land in the catchment
In the example shown, the proportion of urban land is reflected more in an overall increase in concentrations than in a change in the pattern (Figs. 20 and 21).
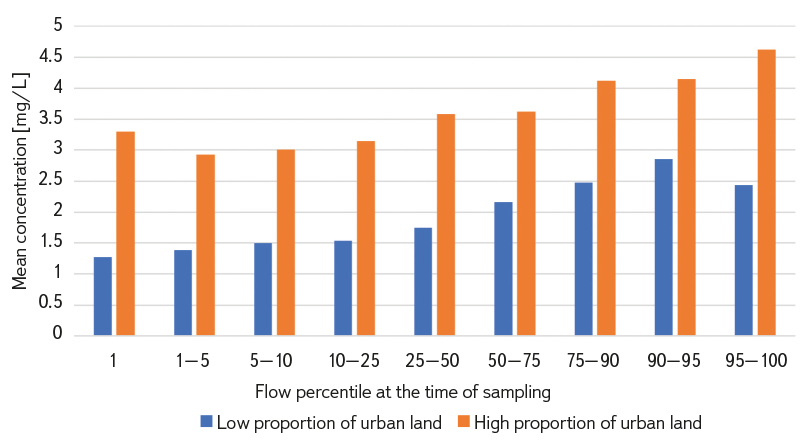
Fig. 20. Differences in the C-Q relationship for nitrate nitrogen (mg/L) by proportion of urban development in the catchment
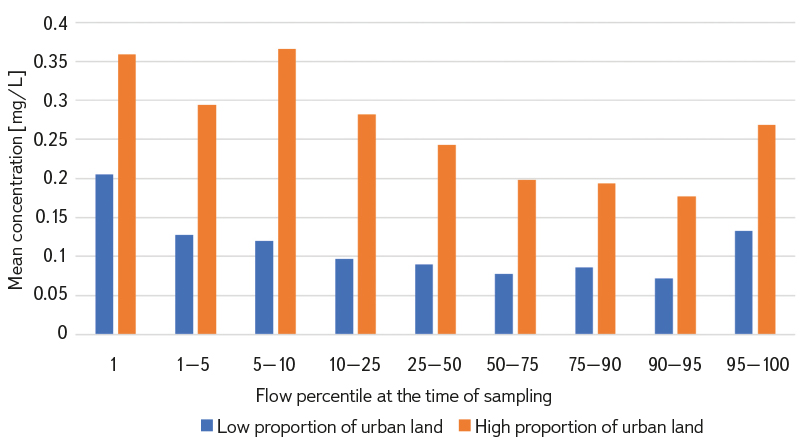
Fig. 21. Differences in the C-Q relationship for total phosphorus (mg/L) by proportion of urban development in the catchment
DISCUSSION
The simple method used here clearly demonstrates the wide range of questions that can be asked and the various aspects of the relationship between hydrological and water quality parameters that can be examined. However, detailed evaluation and the drawing of conclusions require many factors to be taken into account, which must be addressed according to the specific purpose of the analysis.
For comparative purposes, independent (non-overlapping) catchments should be selected. Analysis of catchment characteristics requires a more thorough examination of correlations among the characteristics themselves, for example between population density and agricultural activity. In this analysis, settlement area was represented only by its proportion of land use; population and the structure of wastewater treatment would be more appropriate predictors. The use of mean daily flows does not capture the dynamics of individual extreme events, such as the first flush during extreme flow events [13], or differences in the effects of drought depending on its duration.
The test data also demonstrate, among other things, the influence of arable land on nitrate concentrations. This influence is sufficiently strong to reverse the pattern of the relationship: enrichment predominates in catchments with a high proportion of arable land, whereas dilution predominates in catchments with no arable land. This pattern suggests a likely combination of sources that could be captured by more complex models, such as that described in [10], which distinguishes between enrichment, predominating in agricultural catchments in winter, and dilution, predominating in all catchment types in summer. A similar model appears likely to be applicable under conditions in the Czech Republic. The results also show that enrichment does occur at extremely high flows, but is not pronounced. Small catchments are more vulnerable to drought.
A number of authors have investigated phosphorus in the Czech environment, e.g. [13, 14]. The test data confirm that dilution is the predominant relationship for phosphorus; enrichment occurs only for total phosphorus under extreme flow conditions. Further research should examine whether enrichment at high flows occurs in all types of catchment or only in those with a higher proportion of arable land. Small catchments with dense development and intensive agriculture are the most vulnerable in terms of phosphorus, with dry periods potentially leading to severalfold increases in concentrations. A more detailed analysis would be possible with more comprehensive data on population and wastewater management.
Similar statistical methods can be applied to any parameters for which sufficient data are available. Substances other than nutrients are much less well represented in the literature. The test data clearly show a positive relationship between the concentrations of most PAHs and discharge – i.e. enrichment – which becomes more pronounced as flows become more extreme. This relationship mirrors that observed for suspended solids and, for example, iron, indicating an association with the proportion of surface runoff. Further investigation could usefully compare the influence of impervious surfaces with that of other land-cover types, such as erosion-prone arable land. As this relationship is relatively consistent, it could potentially be used to model concentrations based on correlations with discharge or suspended solids. Fieldwork could then focus on validation measurements, or the relationship could be used to improve estimates of emissions, as required for priority substances under the Water Framework Directive.
Analysis of the pesticide results yields interesting findings, although these are severely limited by data availability. Given the large number of results below the limit of quantification and the inconsistent limits used for different measurements, one option is to include these data and focus on the probability of exceeding the limit of quantification.
Overall, the influence of hydrological conditions can be so strong that it obscures long-term improvements in pollution levels. Many substances responsible for failure to achieve good status are sensitive to both extreme rainfall events and, in particular, episodes of drought.
C–Q relationship models can be used, with a certain degree of uncertainty, to compensate for limited data availability, for example to improve estimates of constituent loads.
CONCLUSION
Many statistical methods are available for working with large datasets and, with appropriately formulated questions and carefully selected data, they can yield valuable insights. Such analyses inevitably involve a degree of simplification and cannot replace detailed analysis of the catchment under study. On the other hand, statistical analyses of existing data are quick and inexpensive and can provide valuable information, for example for analysing pollution sources within a catchment, modelling responses to proposed measures, or planning monitoring campaigns to obtain as much information as possible at the lowest cost.
Despite the numerous challenges encountered, the dataset and analytical approach proved effective.
The data and methods used show that hydrological conditions have a major influence on surface water quality. Summer drought episodes significantly increase phosphorus concentrations, with a greater effect in small streams than in large rivers with extensive catchments. Slight to moderate increases in discharge are associated with higher nitrate concentrations, particularly in winter, but only in catchments with a substantial proportion of arable land; concentrations remain constant in catchments without arable land. Concentrations of PAHs increase very sharply at high to extreme flows. Pesticides warrant a separate, more detailed investigation.
The simple visualizations demonstrate clear relationships for both nutrients and other parameters. Future research should focus on additional or more precise catchment characteristics (e.g. population and connection to public sewerage systems rather than the crude proportion of built-up land) and investigate other parameters in greater detail – particularly pesticides and pharmaceuticals – where sufficient measurements are available under a range of conditions.
Acknowledgements
This article was produced as part of Technology Agency of the Czech Republic project No. SS02030040, Prediction, Assessment and Research into the Sensitivity of Selected Systems and the Effects of Drought and Climate Change in Czechia (https://www.perun-klima.cz/). We thank the River Basin Authorities and the Czech Hydrometeorological Institute for providing the data.
The Czech version of this article was peer-reviewed, the English version was translated from the Czech original by Environmental Translation Ltd.
