SUMMARY
The aim of this article is to describe the experience gained while using alternative technology for measuring annual precipitation in severe mountain conditions without a source of electrical energy. For this purpose, a Lufft WS100 radar precipitation sensor was installed in Šumava in 2020 at an altitude of 1270 m above sea level. The measurements so far have shown evident advantages; for example, maintenance free sensor, detailed measurement step, and distinction of the type of precipitation. The question remains how accurate the measurement is, when during some precipitation episodes the radar precipitation sensor probably overestimates its measurements. Accurate comparison with other measurements is difficult in these mountain ridge conditions. On the other hand, the radar sensor also gives accurate measurements during some precipitation episodes, which we verify by a non-heated tipping bucket rain gauge located within the station and also by measuring the height of the snow. Using these proxy data, systematic error was excluded. Measurements will continue for a more detailed evaluation. The radar sensor is, among other things, part of the monitoring of Kaplický potok in Boubín National Nature Reserve, where runoff is also monitored. From this point of view, information about precipitation and its type is important for the evaluation of the hydrological properties of the basin.
INTRODUCTION
Measuring year-round precipitation, especially winter precipitation, is problematic in remote mountainous areas due to the absence of an electricity source for heating rain gauges and other sensors recording the intensity and amount of precipitation. Radar estimates can be distorted by a number of measurement errors, such as shielding by mountain massifs or high vertical and horizontal variability of precipitation, which can lead to an underestimation of hydrological risks [1]. At the same time, it is precisely in the mountain ridge areas that precipitation totals are the highest, and the impossibility of monitoring them in real time is a disadvantage, for example, from the hydro-prognosis point of view. Automatic weather stations operating from a battery source are most often equipped with non-heated tipping bucket or weighing rain gauges and ultrasonic measurement of snow height. The information from these sensors does not provide a valid overview of the precipitation total and certainly not of the intensity and type of precipitation in winter. A possible solution to the above-mentioned problems can be the use of a Lufft WS100 sensor (Fig. 1). This sensor works like a radar rain gauge with a heated housing with relatively low power consumption. Due to the relatively short time since its introduction to the market, there has not been enough experience with its application and accuracy. For example, it was tested in Peru in a recent study [2], where the measured amounts of precipitation were approximately 100 % higher than the actual values. The reason was probably faulty detection of raindrop size. A similar device under the name Micro Rain Radar was also tested by Peters et al. [3]. The detected inaccuracies were probably caused by turbulence, i.e. sudden vertical and horizontal changes in wind speed in the measured field. This article describes experience with pilot installation of a radar rain gauge in mountainous conditions and provides an initial evaluation of the accuracy of the rain gauge and its behaviour in typical precipitation situations. The results will serve to direct further use of this sensor and to maximize its effectiveness in terms of the accuracy of measured data.
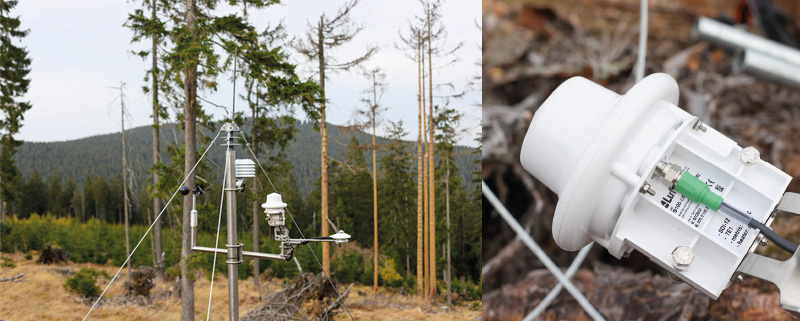
Fig. 1. View of the radar rain gauge installation and detail of the WS100 sensor
INSTALLATION
A weather station from FIEDLER AMS, s. r. o., located on the border of Boubín National Nature Reserve (NNR), below Basumský hřeben peak at an altitude of 1,270 m, was chosen for the installation. The station is in a clearing created after storm Herwart in 2017 (Fig. 2). The radar rain gauge mounted on the arm at the top of the mast is 15 cm wide and 19 cm high (Fig. 1). Its power consumption ranges from 0.4 VA (economy mode) to 1 VA; if shield heating is active, consumption increases to 9 VA. The measurement principle consists of a Doppler radar that scans an area of 9 cm2 above the sensor [4]. Based on the measured size and speed of precipitation particles, the intensity of precipitation is calculated using the diagram shown in Fig. 3 [5]. In the case of precipitation detection, totals are recorded at intervals of one minute. Another feature is the distinction of the type of precipitation according to six categories: rain, snow, mixed precipitation, freezing rain, hail, and drizzle. Measurement accuracy in the case of liquid precipitation is stated by the manufacturer to be ± 10%. A distinct advantage of the rain gauge is that it is completely maintenance-free; there is no need for cleaning, emptying, or any other regular management. Although electricity consumption is low compared to other heated sensors, due to the energy-demanding conditions, an island system was installed with the weather station consisting of a 280 W solar panel and an AGM 12 V/125 Ah battery.
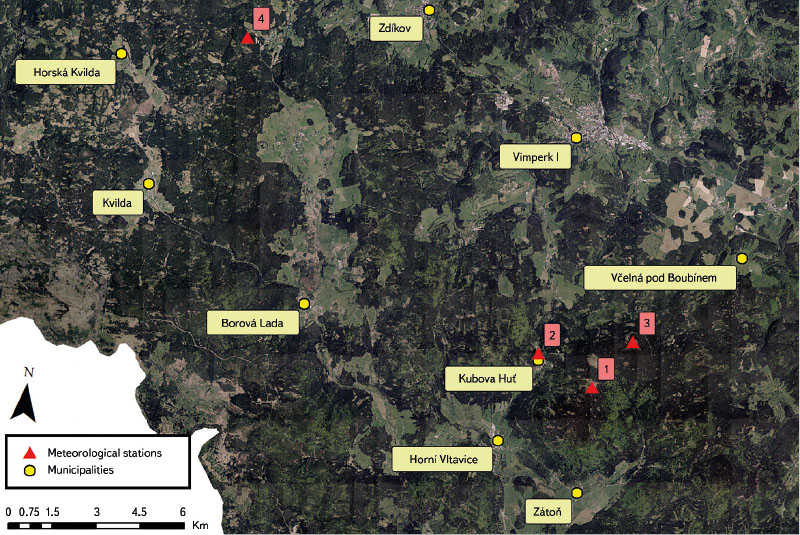
Fig. 2. Locations of meteorological stations used as source of precipitation data. 1 – Basum, 2 –Kubova Huť, 3 – Boubín, 4 – Churáňov
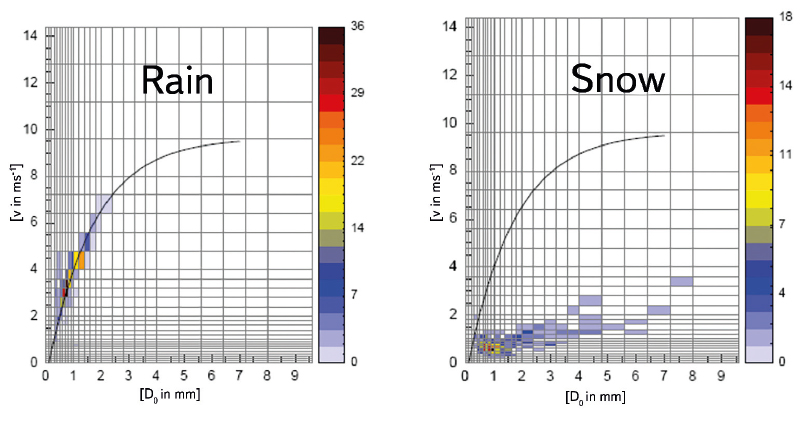
Fig. 3. Diagram for rainfall intensity calculation [5]
The station is also equipped with other sensors for measuring hydrometeorological variables. In addition to the WS100 sensor, liquid precipitation is also measured by the MR3 rain gauge from Meteoservis, v. o. s., with a capture area of 500 cm2; this is commonly used by the Czech Hydrometeorological Institute (CHMI). Snow height is measured by a US42000 ultrasonic sensor. The station also records air temperature and relative humidity, global radiation with a Kipp & Zonnen CMP3 pyranometer, wind speed with a WS103 sensor, and soil temperature and humidity at depths of 15, 30, and 60 cm with a CS650-DS sensor. All data is recorded by the H7-G-TA4-SZ monitoring unit and transferred online using a SIM card.
MEASUREMENT
Measurement started in the autumn of 2020. A non-heated tipping bucket rain gauge was also installed to compare the precipitation measurements and, in the summer of 2021, an ultrasonic snow height measurement was also installed. The current goal is to evaluate the reliability of measurement by the WS100 sensor, to determine approximate deviation of the measurement, and to define the weather situations that have an adverse effect on accuracy of measurement of the precipitation amount. Comparison of winter precipitation is most problematic, as the reported loss for heated tipping bucket and weighing rain gauges reaches values of up to 30% during snowfall due to evaporation from the heated parts and the effect of wind circulation. This effect should be eliminated with the WS100 sensor.
During 2021, the WS100 radar rain gauge measured a total of 1,435.5 mm of precipitation at an altitude of 1,270 m above sea level (asl). For comparison, the surrounding stations measured the following values: Churáňov 1,109.2 mm (1,118 m asl); Filipova Huť 1,279.2 mm (1,110 m asl) [6]. Unfortunately, year-round precipitation is not measured at a similar altitude and the same time outside the border ridge, which is richer in precipitation, but where Basumský hřeben does not fall into. The non-heated tipping bucket rain gauge measured an annual total of 836.9 mm. Here, we can expect a significant underestimation, especially of snowfall (which occurred until the end of May). In addition, the station is located in a very windy place on a north-south oriented part of the ridge. However, the winter period was below average in terms of precipitation, and most of the precipitation fell in the summer half of the year.
Liquid precipitation
If we look at the totals for the rainfall-rich period June–August 2021, the radar rain gauge measured 562.8 mm and the tipping bucket rain gauge 390.1 mm. Churáňov, located 152 m lower, recorded 450.4 mm [6].
The following conclusions can be drawn from the comparison of individual daily totals. The overestimation of precipitation compared to the tipping bucket gauge does not appear to be systematic and the percentage overestimation is highly variable. The advantage of the tipping bucket rain gauge is that it also partially records settled precipitation, where on some days it shows totals in the range of 0.1–0.2 mm during the morning hours. The radar rain gauge does not record precipitation in these cases. Rain gauges sometimes reach surprisingly similar values during short, high intensity rainfall, such as on 8 July 2021, when almost 20 mm fell in about 15 minutes. The whole event lasted 40 minutes, and both rain gauges showed the same 23.6 mm, despite, for example, wind gusts reaching 18 m/s. The next day, just after midnight, steady five-hour rain came. While the radar rain gauge showed a total of another 23.6 mm, the tipping bucket rain gauge only showed 14.2 mm, i.e. 40% less, while wind gusts were only in the range of 0–5 m/s. If we evaluate the percentage overestimation of the radar rain gauge in these three months for daily precipitation higher than 5 mm, we get a value of 36.5%. However, if we compare daily amounts less than 5 mm and more than 0.5 mm (to eliminate settled precipitation), we find that the radar rain gauge underestimates by 36.2%. A question remains about the accuracy of a tipping bucket rain gauge in such demanding weather conditions.
Solid precipitation
Snowfall can only be compared with the measurement of snow height by ultrasonic sensor. The results are quite satisfactory, although there are not many valid events to compare because the height of snow cover was up to 20 cm during most of the winter and could be affected by the wind in rugged terrain. Nevertheless, some of the most significant snowfalls in the winter season can be mentioned: 25 December 2021 – total of 6 mm and snow + 7 cm; 6–7 February 2022 – total 20 mm and snow + 23 cm (Fig. 4); 31 January 2022 – total 18 mm and snow + 13 cm (strong wind). More detailed conclusions cannot be established without knowledge of the water value of new snow. For comparison, the values of winter precipitation for the period December 2020 to February 2021 on the radar rain gauge – 260.8 mm and Churáňov – 210.2 mm [6] can be shown.
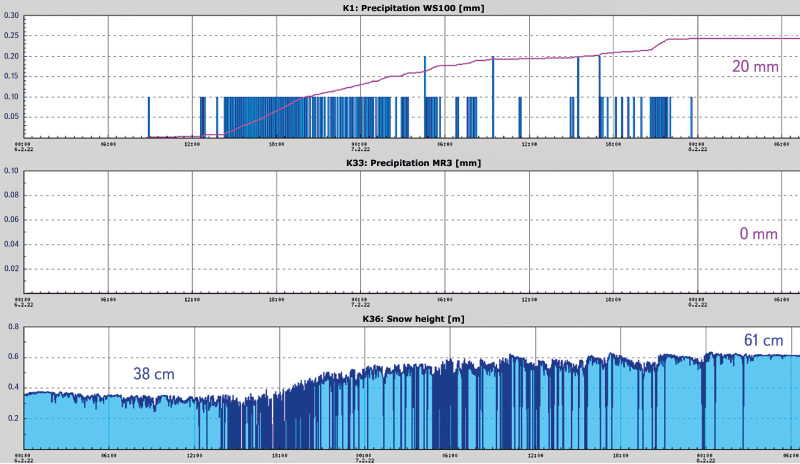
Fig. 4. Outputs of the WS100 radar rain gauge (first graph), the non-heated SR03 tipping bucket rain gauge (second graph), and the ultrasonic snow height measurement (third graph) during moderate snowfall on 6–7 February 2022
Precipitation type distinction
Differentiating the type of precipitation helps to recognize, for example, the beginning of the occurrence of liquid precipitation on the snow cover (so-called rain-on-snow situation), when snowfall often turns into rain. The sensor sends a precipitation type code based on its own evaluation. In the graphical display, the detection of precipitation is shown in red; other colours show the type of precipitation detected.
Fig. 5 shows the arrival of a cold front on 1 November 2021, when it cooled from 15 °C to 0 °C during the day. The synoptic situation from this date is shown in Fig. 7. At the beginning it is rain, which turns into mixed precipitation and snow. The sensor evaluates the type of precipitation continuously and determines only one type of precipitation at any given time. Under boundary conditions, it can alternately detect different types of precipitation, the occurrence of which appears to be simultaneous in the graphical display. Fig. 6 shows the situation as captured by the radar rain gauge, the non-heated tipping bucket rain gauge, and the snow height measurement sensor. At the beginning the temperatures were above zero, but with a decreasing tendency, and after the first hour the rain changed to mixed precipitation and snow. The temperature stayed above zero, so the snow was melting in the tipping bucket rain gauge, and simultaneously, a layer of wet snow up to 2 cm was forming on the ground surface. Just before midnight, the temperature dropped to 0 °C and the tipping bucket rain gauge stopped detecting precipitation. The value stopped at 12 mm, but it can be assumed that part of the precipitation was caught by the funnel in the form of wet snow (at least to the amount that was lying on the ground). By then, the radar rain gauge had detected 18 mm of precipitation. The temperature stayed at freezing point until 9 o’clock in the morning; precipitation stopped just before that. During this time, the radar rain gauge detected another 12 mm of rain, and the height of snow increased by 8 cm to 10 cm. Considering the fact that the snow fell wet, the ratio of 12 mm of water to 8 cm of snow is relevant. After 9 o’clock in the morning, the snow in the tipping bucket rain gauge started to melt, and after it melted (with the inclusion of lower precipitation in the evening), the amount of precipitation stopped at 27 mm. The radar rain gauge reported 32 mm. The tipping bucket rain gauge measured 5 mm less. This is an acceptable figure and difference, considering the snowfall and wind conditions on the ridge clearing. However, it should be noted that the wind did not exceed an average speed of 3 m/s and gradually decreased to 0.5 m/s.
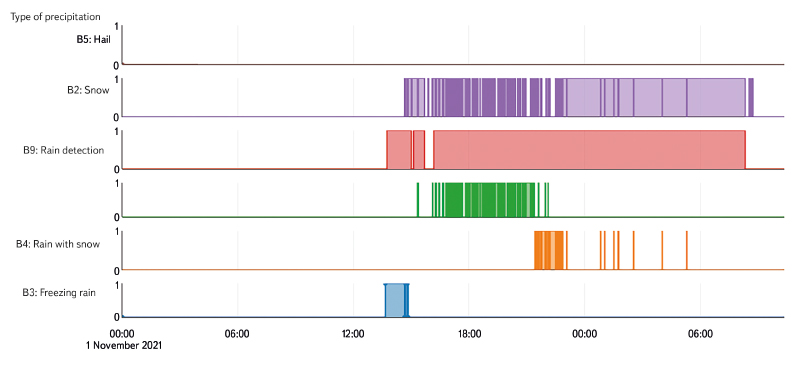
Fig. 5. Graphical representation of precipitation type detection during a cold front on 1 November 2021
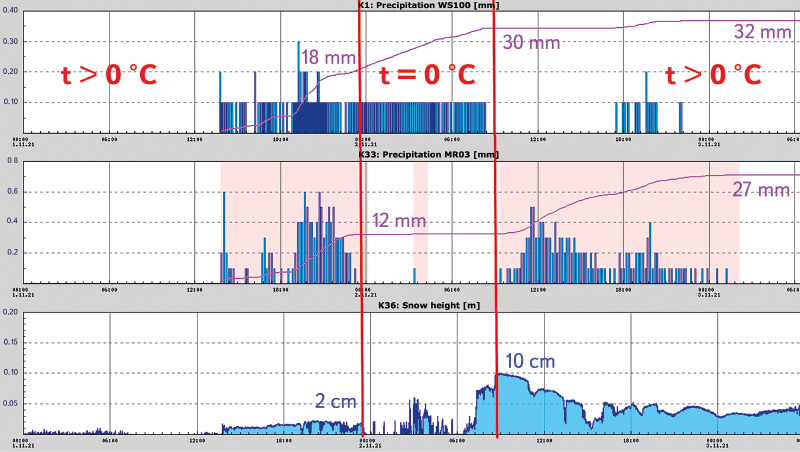
Fig. 6. Outputs of the WS100 radar rain gauge (first graph), the non-heated SR03 tipping bucket rain gauge (second graph), and the ultrasonic snow height measurement (third graph). The red vertical lines separate the period of time when the temperature dropped to freezing point. Subtotals of precipitation and snow depth are shown numerically.
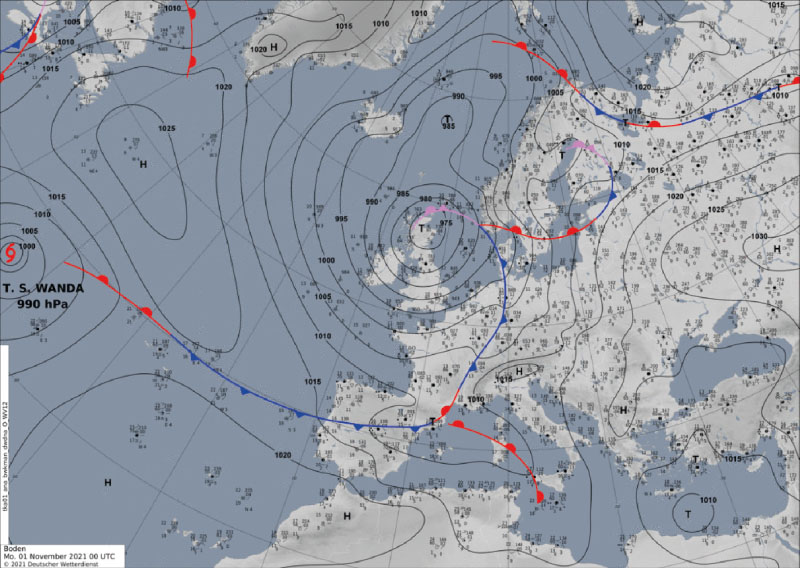
Fig. 7. Synoptic situation on 1 November 2021 [7]
Evaluation of WS100 rain gauge accuracy
Based on longer-term measurements, systematic overestimation by the radar rain gauge is evident. Tab. 1 (below) compares monthly totals from the nearest rain gauge stations at Boubín (1,353 m a.s.l.), where year-round rainfall is measured by a combination of an MR3 non-heated tipping bucket rain gauge and a Metra886 manual rain gauge [9], and from Kubova Huť station (1,010 m a.s.l.) and the more distant Churáňov station (1,118 m a.s.l.), where precipitation is measured using the most accurate method – a MRW500 weighing rain gauge [6]. The comparison is burdened by the uncertainty of the high variability of precipitation totals in mountain conditions, both from the point of view of altitude and the distance between the stations and the influence of windward precipitation and lee behind the main Šumava ridge. The average value of overestimation of precipitation totals is 36%. This value may realistically be slightly lower due to higher losses when measuring by tipping bucket rain gauges, with which the values are compared. In mountainous areas, losses on heated tipping bucket rain gauges and manual rain gauges can be 15–66%, depending on wind conditions [8]. The problem of wind circulation influence on measurement accuracy can also be expected with the weighing rain gauge at Churáňov station; simultaneously, this station is located in the lee and it lies at an altitude 152 m lower. This fact should be negligible in this case due to the small size of the WS100 sensor. The monthly values in the table also do not confirm seasonal dependence, and measurement deviations are the same throughout the year. During the screening of measured variables at Basum station, other possible weather conditions affecting measurement accuracy of the WS100 sensor were excluded. Influence on measurement deviation was excluded for wind speed, temperature, and air humidity. It will be necessary to subject the intensity of precipitation and the size of the drops to a more detailed analysis. In Fig. 8, daily totals in the hydrological year 2021 are compared in the graph. Here, systematicity of the error is confirmed because the differences between measurements at individual rain gauging stations also grow with increasing sum of the daily total. Fig. 9 shows the probability of exceeding daily totals. The graph clearly shows that the WS100 sensor overestimates regardless of daily precipitation intensity, and the probability of exceeding daily totals is higher in almost all cases with the radar rain gauge.
Tab. 1. Comparison of monthly totals measured at Basum station and at Boubín, Kubova Huť ,and Churáňov stations. Average percentage deviation of the WS100 sensor is also shown.
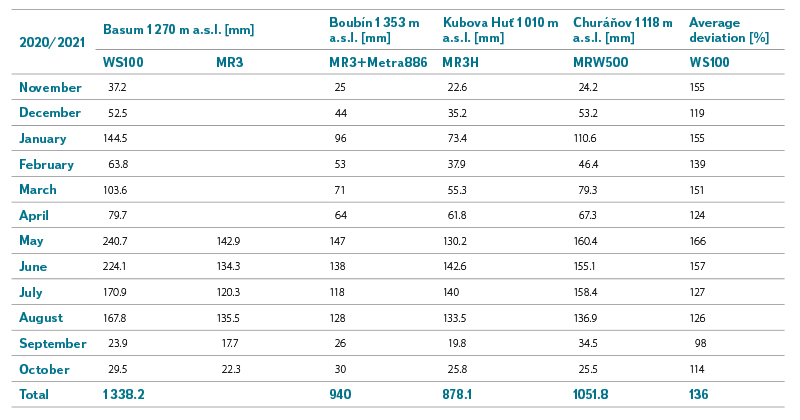
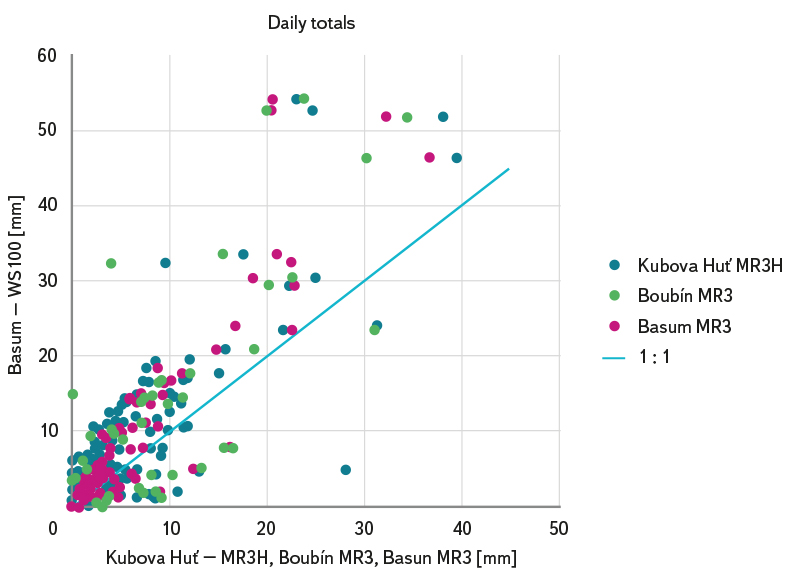
Fig 8. Comparison of daily totals in the hydrological year 2021 measured by the WS100 radar rain gauge, the nearest meteorological stations at Kubova Huť, Boubín, and the tipping bucket rain gauge at Basum station
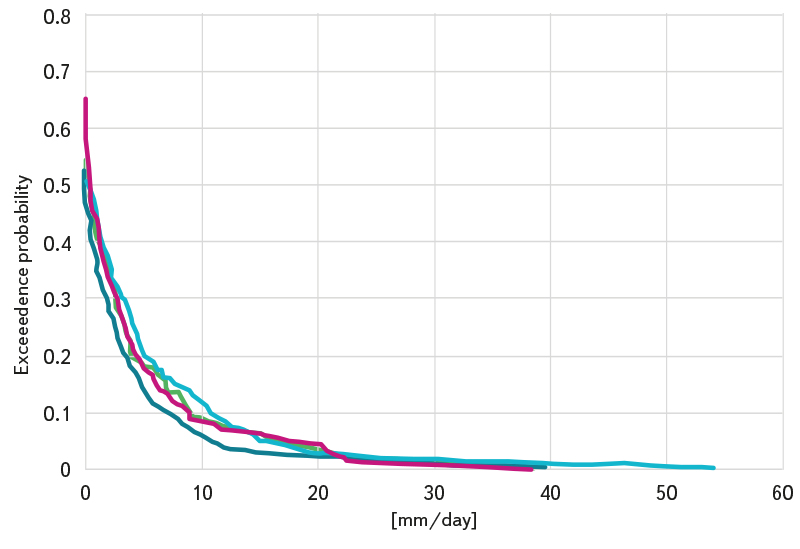
Fig. 9. Exceedance probability of daily totals in the hydrological year 2021 measured by the WS100 radar rain gauge, the nearest meteorological stations at Kubova Huť, Boubín, and the tipping bucket rain gauge at Basum station.
CONCLUSION
From the experience gained so far, the maintenance-free nature of the radar rain gauge and the amount of information it provides through its measurements can be highlighted. The accuracy of measurements in ridge areas is difficult to assess due to the absence of valid comparative measurements. Nevertheless, an overestimation of precipitation can be observed, which was also detected by Valdivia et al. [2]. As a probable reason in their measurement conditions, they stated inaccurate determination of raindrop diameter, in which the raindrop size distribution measured by WS100 sensor does not correspond to a typical gamma distribution [10]. On the other hand, systematic underestimation of precipitation by the WS100 sensor compared to the heated tipping bucket rain gauge was described by Pishniak et al. [11], who tested different types of rain gauges at a station in Antarctica. The reason for this underestimation may be the prevailing snowfall. Nevertheless, the results of their studies contradict each other. The cause of the inaccuracy can also be individual, caused by, for example, microclimatic conditions. The solution to these inaccuracies can be, for example, a firmware update modifying the measurement methodology (e.g., modification of precipitation intensity diagram) or a statistical correction of systematic errors, the determination of which will be the subject of further research.
Nevertheless, this sensor has a number of advantages and the potential to be a suitable tool for measurements in such demanding conditions in remote locations in the future. The next step will be detailed analysis of precipitation events and determination of possible meteorological or other causes in situations where different precipitation totals were measured by tipping bucket and radar precipitation gauges. The results will serve to correct the data and as a basis for further use of radar-type rain gauges. For more accurate determination of the causes of the inaccuracy, it would be advisable to place another WS100 sensor near a weather station with a heated rain gauge and away from the extreme conditions that prevail on a mountain ridge.
Acknowledgements
The operation of the weather station is supported by a WRI internal grant (3600.52.16/2022).
This article has been peer-reviewed.
The article was translated on the basis of the Czech original by Environmental Translation Ltd.
