ABSTRACT
The study focuses on assessing changes in runoff conditions and approaches to determining flood hazard in confluence areas of river systems. Based on the analysis of several model catchments, the results of numerical simulations of water flow during floods with different return periods are presented. The analyses revealed that separate modelling of the main river and its tributaries produces distorted results, as the hydraulic conditions in confluence areas are characterized by complex interactions between individual streams. Therefore, the authors recommend a comprehensive approach using 2D numerical models, which allow for more accurate evaluation of inundation extent, water depths, and flow velocities. The study results include proposals for updating the methodological guidelines of the Ministry of the Environment, emphasizing a unified approach to the development of flood hazard and risk maps.
INTRODUCTION
The catastrophic floods of 1997, which primarily affected the Morava and Oder river basins, represented a major shock for most of society. In an effort to increase preparedness for similar events and to reduce their impacts in the future, the Flood Protection Strategy for the Territory of the Czech Republic was approved by the Government of the Czech Republic in 2000 [1]. The aim of this document was to establish a framework for defining specific procedures and preventive measures to enhance systemic flood protection in the Czech Republic. One of these measures was defined as the delineation of floodplain extents based on the preparation of a detailed digital terrain model.
At present, the method for delineating floodplains is defined by Decree No. 79/2018 Coll. [2] on the method and scope of preparing proposals for, and establishing, floodplains and their documentation. According to the Decree, a floodplain is delineated by the flood line corresponding to a flood with a return period of 100 years. The extent of the assessed area corresponds to the hydraulic conditions of a continuous reach of a watercourse and its inundation area and takes into account the officially designated floodplain. For the inundation area of each watercourse reach, flood hazard maps are prepared for floods with return periods of 5, 20, 100, and 500 years; these maps depict the extent of inundation, flow depths, and flow velocities. In 2025, floodplains in the Czech Republic were designated for 16,889 km of watercourse reaches.
EU Directive 2007/60/EC on the assessment and management of flood risks (hereinafter referred to as the Floods Directive) also requires Member States, inter alia, to prepare flood hazard and flood risk maps for areas with potentially significant flood risk. Flood hazard is defined by the extent of inundation, flow depths, and flow velocities; in the Czech Republic, flood hazard maps are prepared for floods with return periods of 5, 20, 100, and 500 years. Maps prepared in accordance with the requirements of the Floods Directive are updated in six-year cycles (for the first time in 2013). The extent of watercourses mapped in this way is significantly smaller than that of designated floodplains; in 2025, it covered just under 3,000 km of watercourses.
Procedures for fulfilling the requirements of the Floods Directive are described in the Methodology for the Preparation of Flood Hazard and Flood Risk Maps ([3], hereinafter referred to as the Methodology). This Methodology defines how the outputs of standard hydraulic models (flood extent, flow depths, and flow velocities) are to be represented in hazard maps and how these outputs are then used to prepare flood risk maps. The intention of the Methodology was not to standardise hydraulic modelling procedures, as this is a broad and complex topic that should be addressed in a separate document.
During preparations for the production of flood hazard and flood risk maps within the first planning cycle, a pilot study was carried out in 2011. This study outlined possible approaches to hydrodynamic modelling of watercourse confluences and proposed procedures for calculating flow parameters in these confluence areas [4]. The study divided the issue of modelling confluence areas into three basic schemes:
The hydraulic calculation is carried out only on the tributary, while water levels for the required N-year discharges are known on the main watercourse. The hydrodynamic model of the tributary is constructed independently, without considering the influence of the main watercourse.
The hydraulic calculation is carried out only on the tributary, while the model of the main watercourse has already been developed previously. The results of the previously prepared model of the main watercourse serve as boundary conditions for the tributary model. Outputs from the tributary model must be in a format compatible with that of the main watercourse model so that the two can be seamlessly integrated.
Both a tributary model and a main watercourse model are prepared. The models do not have to be schematised using the same approach (1D or 2D), do not have to be developed within the same modelling environment, and do not have to be prepared by a single contractor.
The aforementioned study [4] discusses the last variant in detail. It states that the simplest situation arises when the models for both watercourses are prepared by a single contractor within one computational environment and a single model is created for the entire confluence area. In such a case, the calculation is relatively straightforward, with the only challenge being the correct specification of boundary conditions.
In cases where each watercourse is modelled using a different schematisation, or by a different contractor, the study proposes addressing this situation by selecting an appropriate connection point for linking the two models on the tributary upstream of the confluence. This point should allow the transfer of boundary conditions from the main watercourse model to the tributary model. The outcome of this approach should be unified outputs of the flood hazard map characteristics (extent of inundation, depths, and velocities) covering the modelled confluence area without overlapping areas [4].
However, the two completed planning cycles under the Floods Directive have shown that this approach has not always been applied. Some confluence areas were modelled separately for the main watercourse and for tributaries, even though the entire confluence area was prepared by the same contractor. As a result, maps exist that display, within the confluence area, modelling outputs for only one watercourse at a time. This manner of presentation significantly reduces the informative value of flood hazard information for both professional users and the general public, as there is no clear overview of inundation extent, depths, and flow velocities across the entire confluence area simultaneously.
This paper analyses examples of hydraulic models of selected confluences, and on the basis of the results obtained, recommendations will be formulated for updating the Methodology and other methodological procedures of the Ministry of the Environment (MoE).
METHODOLOGY
The procedures proposed within the pilot project [4] reflect the state of knowledge at the time of their development approximately 14 years ago and, from today’s perspective, some of them may be considered outdated. At present, hydraulic calculations of water flow in floodplains are carried out predominantly using 2D numerical models. The basic prerequisites for valid modelling of confluence areas are as follows:
- From a hydraulic perspective, confluence areas are typically characterised by complex flow regimes; for this reason, it is desirable to model them using 2D numerical models that encompass the main watercourse, the inundation area, and any tributaries.
- Combining different numerical model dimensions (1D and 2D) is undesirable; if the combination of different models is unavoidable, the connection between individual models should be implemented at a location where the flow is no longer influenced by the confluence area.
- The connection and merging of results in the confluence area from different contractors is possible; however, a more reliable approach is to develop a single hydraulic model for the entire confluence area.
The following text presents three case studies that demonstrate different approaches to the treatment of confluence areas. These involve selected reaches of watercourses with significant flood risk, delineated within the 3rd planning cycle in accordance with the requirements of the Floods Directive:
- DYJ 09 Svitava, Křetínka, Třebětínka, Kladorubka,
- MOV 10 Valová, Hloučela, Romže, Český potok,
- MOV 01 Morava, Olšava, Dlouhá řeka, Okluky.
The hydrodynamic calculation was carried out using a 2D shallow-water flow model [13, 14]. The simulation results describe steady-state conditions of depth-averaged flow velocities and water depths for individual flood scenarios with an average return period of N years. For comparison of the calculation results, historical flood hazard data prepared within previous planning cycles [5] or as part of studies of runoff conditions and floodplains [8–12] were used. The case studies focus on issues related to confluence areas from the perspective of the availability of hydrological data (DYJ 09, MOV 10) and the possibilities for merging flood hazard data [5] derived using different computational approaches or prepared by different contractors (MOV 01).
DYJ 09 Svitava, Křetínka, Třebětínka, Kladorubka
The case study of reach DYJ 09 focuses on the procedure for determining upstream boundary condition (UBC) values in the given confluence area. The conceptual model is shown in Fig. 1, including the locations of upstream (UBC) and downstream (DBC) boundary conditions. At the UBC, the discharge Q(t) and the energy line slope IE are defined. At the DBC boundary, a rating curve h(Q, t) is specified. The confluence model requires the definition of UBCs for individual flood scenarios on the delineated reaches as the corresponding value of the peak discharge QN on the selected watercourse and discharge contributions from related tributaries in the area [4].
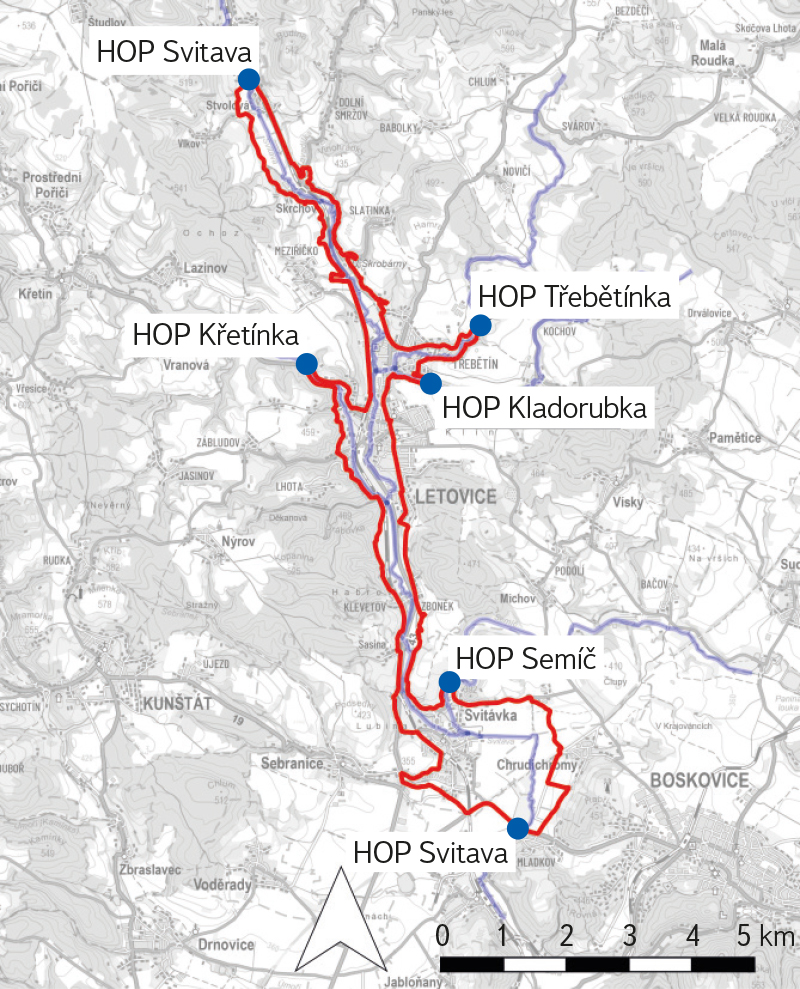
Fig. 1. Conceptual model DYJ 09
The procedure for determining all UBCs is documented for the loading scenario from the Svitava river at discharge QN. The hydrological profile closest to the downstream boundary condition (DBC) on the Svitava is Svitava – below Semíč (A) (Fig. 2). Similarly, the closest profile upstream of the confluence is Svitava – above Semíč (C). The discharge contribution from the UBC at Semíč can be derived according to [4] as follows:
![]() (1)
(1)
where:
QN(A) is a value of the N-year peak discharge at the relevant profile A (Fig. 2).
 Fig. 2. Hydrological data at the confluence of Svitava – Semíč, Křetínka, Kladorubka, Třebětínka
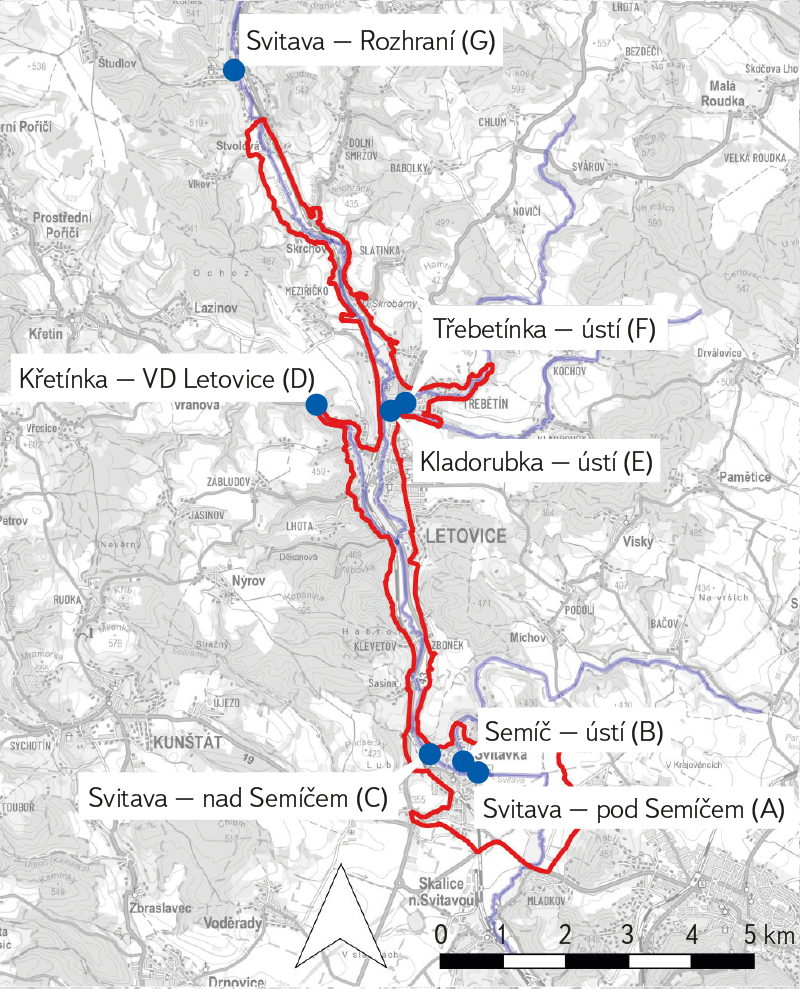
Svitava – Rozhraní is the nearest profile in the upstream reach of the model above the confluence (Fig. 2). According to [4], the discharge contributions from the individual UBCs within the reach (Fig. 2) should satisfy the following condition:
 (2)
(2)
Given the number of unknowns in the equation for this reach, the method described in [4] cannot be applied, and the discharge contributions must be derived using alternative approaches. In the case study, a method based on the ratio of individual QN values was selected, derived from the following equations:
 (3)
(3)
 (4)
(4)
which allows the determination of UBC values using the following equations:
 (5)
(5)
 (6)
(6)
MOV 10 Valová, Hloučela, Romže, Český potok
The case study of reach MOV 10 documents, analogously to the DYJ 09 reach, the procedure for determining UBCs for the given confluence area (Fig. 3).
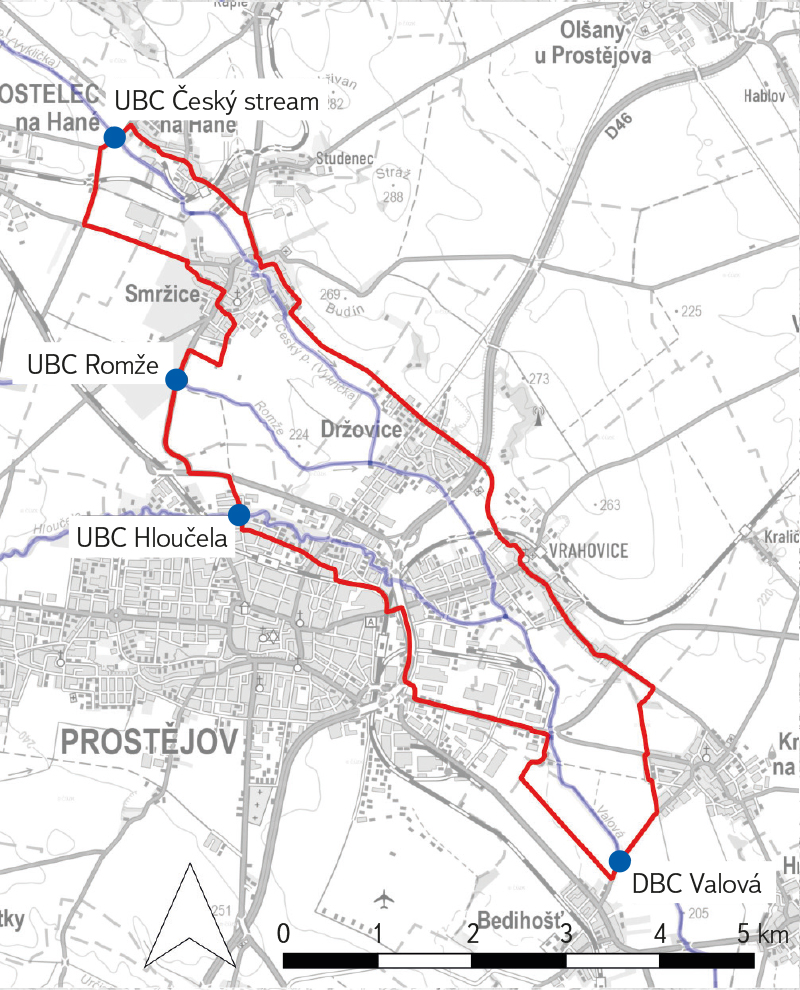
Fig. 3. Conceptual model MOV 10
The determination of all UBCs is carried out for the loading scenario QN from Český potok. The hydrological profile closest to the DBC on the Svitava is Valová – Polkovice (A) (Fig. 4). The discharge contribution from the UBC on the Hloučela will be:
![]() (7)
(7)
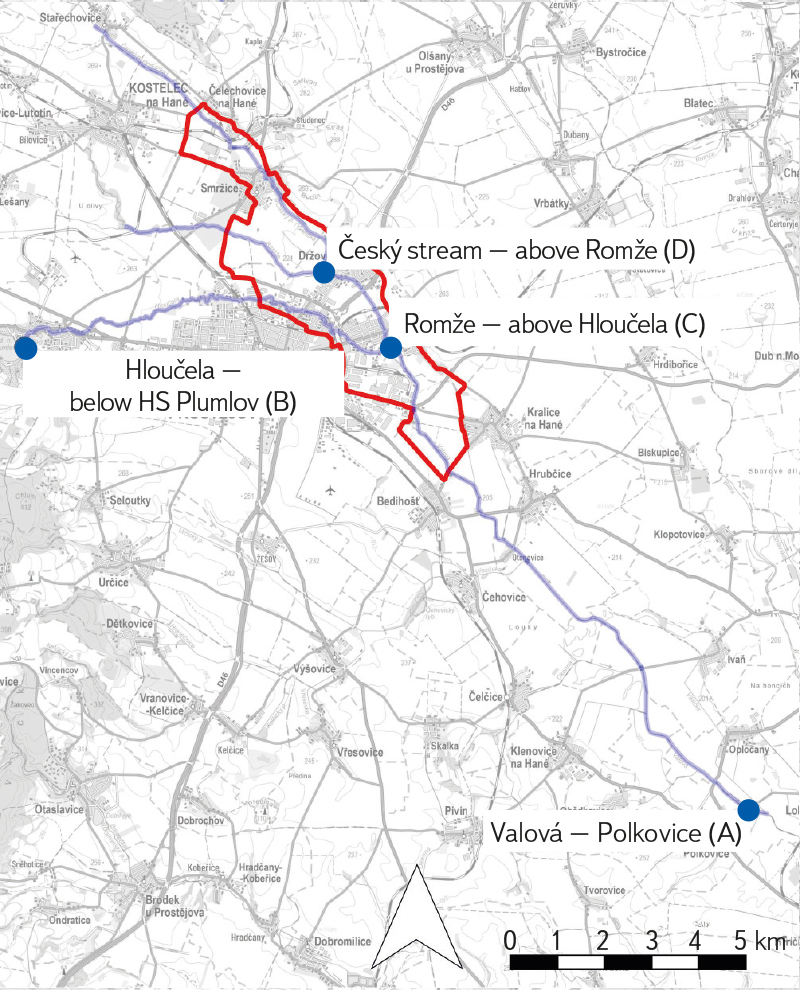
Fig. 4. Hydrological data at the confluence of Valová – Hloučela, Romže, Český potok
The discharge contribution from the UBC on the Romže can be determined as:
![]() (8)
(8)
Similarly, for the loading scenario QN from the Romže, the discharge contribution for the Hloučela UBC can be derived according to equation (7). Given the absence of hydrological data for the Romže upstream of its confluence with the Český potok, the discharge contribution from the UBC on the Český potok can be conservatively assumed to be zero:
![]() (9)
(9)
The UBC on the Romže will then take the value of the corresponding loading scenario QN. When using the QN ratio approach, the UBCs for the Český potok and the Romže can be determined from the following equations:
 (10)
(10)
 (11)
(11)
For the loading scenario QN from the Hloučela, the discharge contributions can be derived as:
 (12)
(12)
Using the QN ratio, the discharge contributions between the Romže and the Český potok can be determined as:
 (13)
(13)
 (14)
(14)
MOV 01 Morava, Olšava, Dlouhá řeka, Okluky
The case study of reach MOV 01 presents possibilities for merging flood hazard data in a confluence area derived from inputs prepared by different contractors (see areas A, B, and C in Fig. 5), in all cases using 2D models. The analysed reach is significantly influenced by the confluence of the Morava river with the Olšava, Okluky, and Dlouhá řeka. The objective of the work was to create continuous datasets from the partial flood hazard maps [5] for the individual sub-areas A, B, and C.
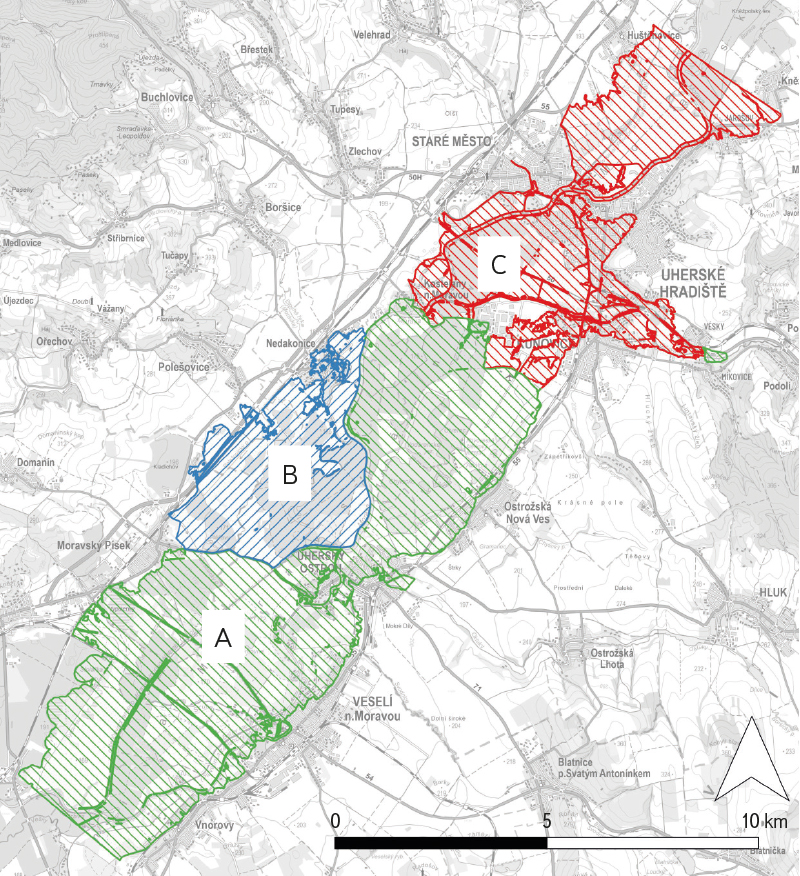
Fig. 5. River section MOV 01 with indication of sub-areas A, B, C calculated by different authors
The merging of inundation maps was carried out in the following steps and is demonstrated using the Q500 scenario as an example; the same procedure can be applied identically to the other QN scenarios:
- The updated areas B and C were removed from the historical results for area A (see Fig. 6). The boundaries of polygons B and C were suitably selected at locations where approximately one-dimensional flow could be assumed (channel flow, embankment overtopping, flow through bridges and culverts).
- The updated areas B and C were clipped to the extent of polygons B and C only. The resulting partial map for Q500 corresponds to Fig. 6.
- At the contact lines between polygon boundaries, the datasets were merged and any singularities were removed (Figs. 7 and 8).
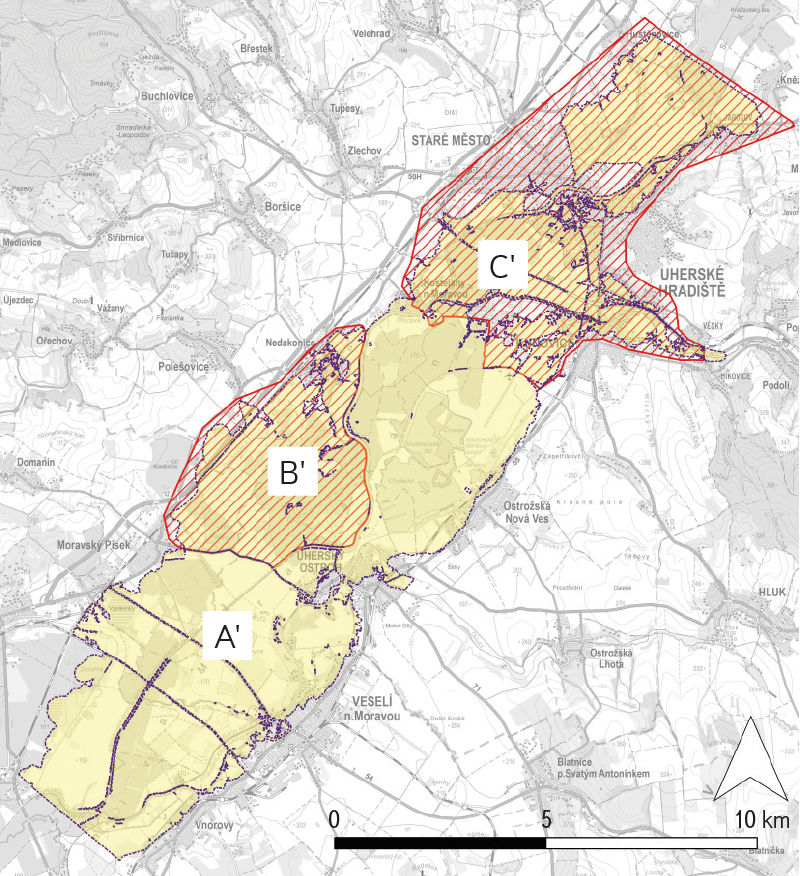
Fig. 6. The extent of data exclusion in the locations of updated areas B and C
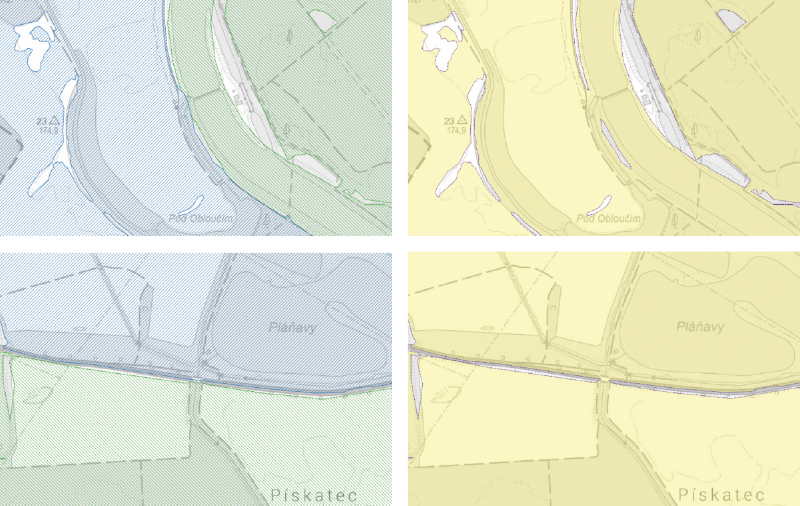
Fig. 7. Examples of polygon boundary merging between areas A and B
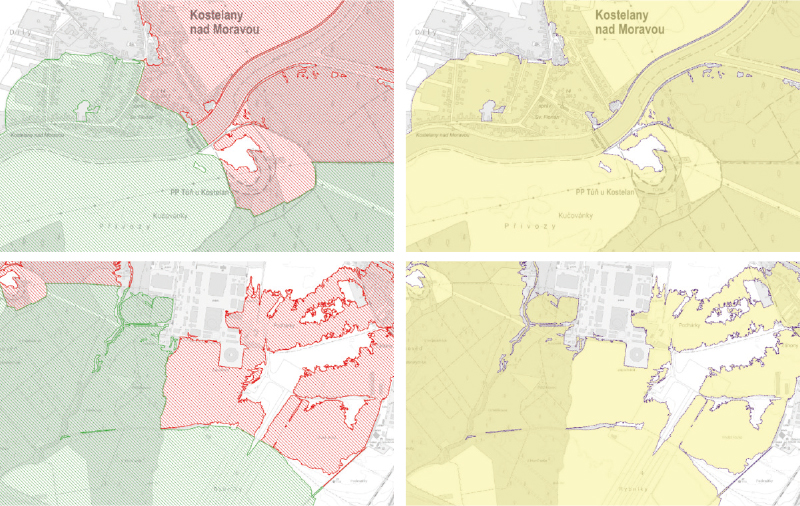
Fig. 8. Examples of polygon boundary merging between areas A and C
Based on the inundation maps processed in this way, the raster hazard maps (water depths, flow velocities, and water surface elevations) can subsequently be adjusted. The adjustments were carried out in the following steps:
- Clipping the raster maps to the extent of the polygons of areas A, B, and C.
- Merging the clipped raster layers.
- Filling missing data in the rasters using bilinear interpolation (Fig. 9).
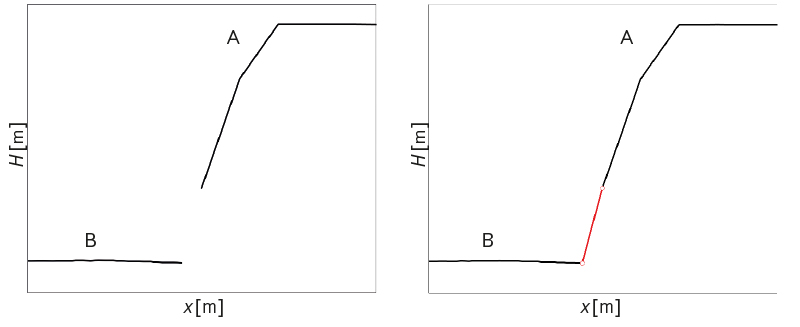
Fig. 9. Example of using bilinear interpolation to fill in missing values of level H during connection of sections A and B
RESULTS AND DISCUSSION
DYJ 09 Svitava, Křetínka, Třebětínka, Kladorubka
In this case, the confluence area is more complex than that considered in the LABEL pilot project [4]. Complete hydrological data were not available for all confluence profiles, in particular upstream and downstream of the analysed confluences. The missing hydrological data required for specifying boundary conditions had to be derived using equations (1) to (6).
The selected area cannot be addressed without considering the significant tributaries of the Svitava river. Given the relatively complex hydraulic conditions, it was necessary to treat the area as a whole using a 2D hydrodynamic model. The 2D model of the confluence area yields markedly different results compared to historical data that did not consider tributaries (Figs. 10–12).
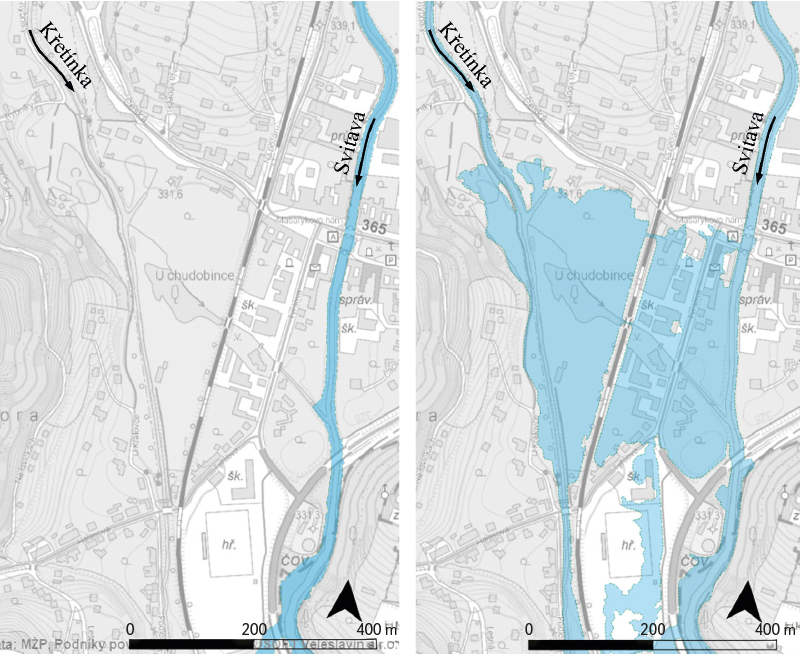
Fig. 10. Flood scenario with return period Q20 on confluence of the Svitava and Křetínka rivers; left – without confluence effect [6], right – with confluence
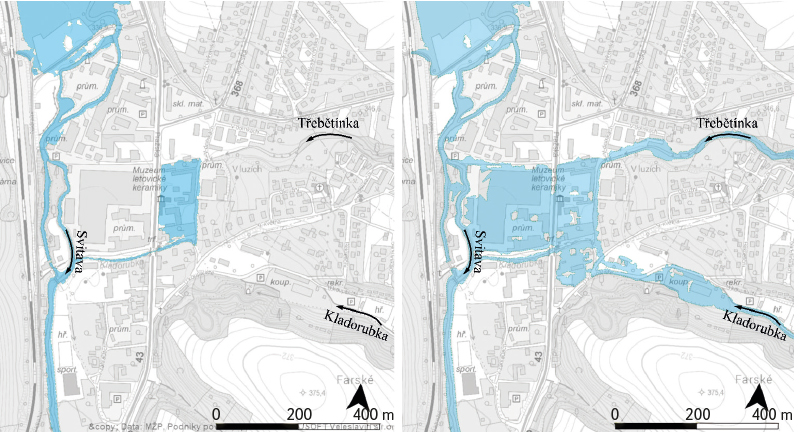
Fig. 11. Flood scenario with return period Q20 on confluence of the Svitava – Kladorubka and Křetínka rivers; left – without confluence effect [6], right – with confluence
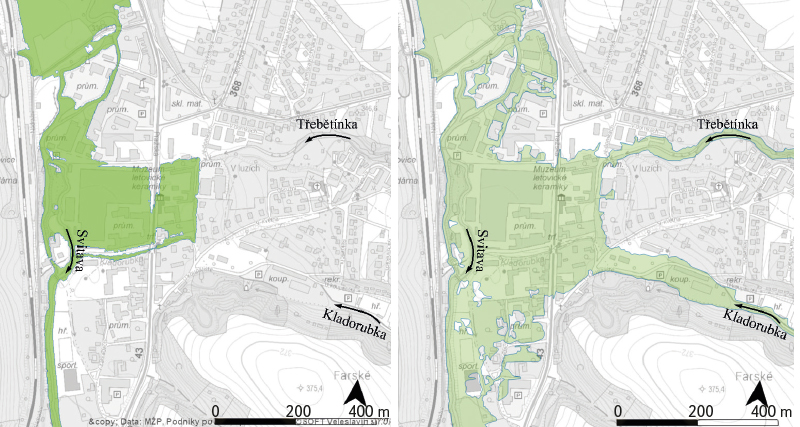
Fig. 12. Flood scenario with return period Q100 on confluence of the Svitava – Kladorubka and Křetínka rivers; left – without confluence effect [6], right – with confluence
MOV 10 Valová, Hloučela, Romže, Český potok
In the analysed area, it was not possible to apply the procedures for determining UBCs according to [4], primarily due to the unavailability of some hydrological data for all confluence profiles. The UBCs were therefore derived using equations (7) to (14).
Given the complex hydraulic conditions (for example, water transfers between the individual reaches), the area had to be treated as a whole (Figs. 13 and 14).
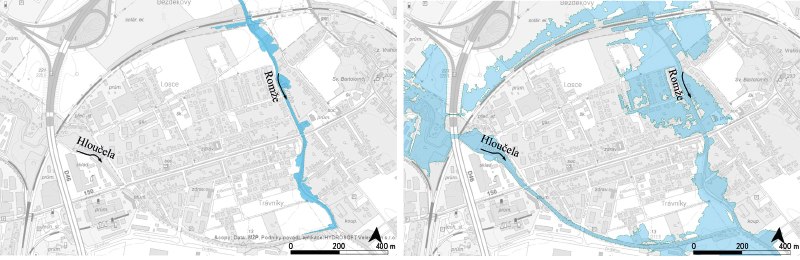
Fig. 13. Flood scenario with return period Q20 on confluence of the Hloučela – Romže rivers; left – without confluence effect [6], right – with confluence
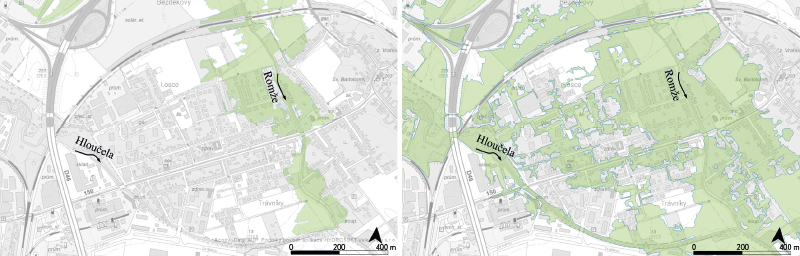
Fig. 14. Flood scenario with return period Q100 on confluence of the Hloučela – Romže rivers; left – without confluence effect [6], right – with confluence
MOV 01 Morava, Olšava, Dlouhá řeka, Okluky
The pilot area confirmed that merging data produced by different contractors in confluence areas is feasible, but only under relatively strict conditions. Fundamentally important is particularly the existence of suitable profiles for linking the partial reaches. It is also desirable to maintain consistent parameters of the computational models (boundary conditions, surface roughness, and the digital terrain model). When connecting raster layers, it must be taken into account that profiles with completely identical values generally cannot be found, which necessitates creating transition zones and completing missing data, for example using simple bilinear interpolation. In view of the above, the linking of partial reaches in confluence areas should be regarded as a marginal solution and applied only in justified cases.
CONCLUSION
The quantification of flood hazard in confluence areas represents a time- and cost-intensive process, not only in terms of the hydraulic calculations themselves but also with regard to securing the necessary extent of required hydrological data. Hydraulic solutions based on 2D models typically require the creation of relatively extensive computational domains with a large number of calculation elements. In confluence areas involving multiple watercourses, this is further compounded by the need to perform a large number of simulations for partial scenarios with different combinations of boundary conditions.
Despite the above-mentioned challenges, it can be unequivocally recommended that confluence areas be modelled as a whole, without subdivision into separate individual watercourse reaches. The conducted case studies demonstrated that mutual interactions of flow between individual watercourses can have a fairly substantial influence on flood hazard values.
The conclusions presented will be incorporated into Chapter 4.9, Hydraulic calculations for the purposes of floodplain delineation, of the Methodology for the preparation of flood hazard and flood risk maps.
Acknowledgements
The article was prepared within the framework of project No. SS02030027 Water systems and water management in the Czech Republic under conditions of climate change, implemented with financial support from the Technology Agency of the Czech Republic under Subprogramme 3 – Long-term environmental and climate perspectives of Programme SS – Programme of Applied Research, Experimental Development and Innovation in the Field of the Environment – Environment for Life.
The Czech version of this article was peer-reviewed, the English version was translated from the Czech original by Environmental Translation Ltd.
