ABSTRACT
This article deals with the hydraulic analysis of a flap gate in Doksany and Strakonice based on the evaluation of experimental measurements performed on a physical and mathematic model at the Water Management Experimental Centre, Faculty of Civil Engineering, CTU in Prague.
The measurements within the Doksany weir were carried out on a physical model at a scale of 1 : 12.5 and on a mathematical 3D model in Ansys CFX. Both models were set up for ordinary and extraordinary situations, i.e. without aeration and with exceeding the maximum operating level. For the Strakonice weir, a physical model was built at a scale of 1 : 7, on which levels and flows were measured for ordinary operating conditions.
In connection with climate change, there has been an increase in the frequency of intense rainfall events, which often lead to sudden flooding. These extreme meteorological phenomena pose a significant risk to both property and human lives. Given this reality, it is essential to refine coefficients of overflow discharge, which are used to determine discharge rating curves. These discharge rating curves used in operation regulations and automated control systems are more in line with reality, which helps in the operational management of flooding through hydraulic structures, e.g. to improve transformation at reservoirs, where decisions need to be made quickly and efficiently about operations in water management systems to minimise possible negative impacts.
The aim of the research is to complement the existing curves of overflow coefficients for higher degree of downstream flooding and for extraordinary conditions. The research includes a comparison of different types of baffles and a mathematical description of flap gate movement.
INTRODUCTION
Flap gates are currently the most common type of movable gate found on weirs and dams in the Czech Republic; simultaneously, they can also be described as the most widely used type of gate in the reconstruction of weirs along the Elbe–Vltava waterway and other weirs in the Czech Republic, as well as in overflow control structures of dams such as Nechranice Reservoir. This is due to their advantages, particularly the possibility of precise operation and the cost-effectiveness of both construction and operation.
Flap gates were the subject of research by Jaroslav Čábelka, Gerhard Wickert, and Gerhard Schmausser at the end of the 20th century [1, 2]. However, these publications focus only on ordinary conditions without significant influence from downstream flooding.
For this reason, and in view of the accelerating pace of climate change, which is bringing more frequent occurrences of extreme rainfall, Czech research has been extended to include ordinary conditions with greater downstream influence as well as exceptional situations. Exceptional situations refer to conditions in which the water level in the watercourse rises above the ordinary operating level due to increased flow, or when the aeration pipe of a flap weir becomes clogged, resulting in increased discharge over the control structure.
METODOLOGY
As part of the research, sectional physical models of weirs fitted with flap gates were constructed at the Water Management Experimental Centre of the Faculty of Civil Engineering at CTU in Prague. At the same time, 3D mathematical models were created for one of the weirs. The aim was to analyse the hydraulic behaviour of the overflows under various flow rates, geometric modifications to the overflow crest of the flap gate, and water flow around the overflows. The measured and calculated values were used to obtain water surface profiles, which could be compared across the different methods, including numerical calculations based on graphs from existing research.
DATA
Doksany hydraulic structure
Doksany hydraulic structure (Fig. 1) is located on the Ohře river in the southern part of the municipality of Doksany in the Ústí nad Labem Region. The components of the structure include a machine room, a weir, a small hydropower plant, and a fish pass. The weir consists of a reinforced concrete structure with a movable control element mounted on top – namely, a steel gate in the form of a hollow flap. Flap gates have large U-profile baffles and small L-profile baffles installed on the overflow crest. The raising structure has a total of two overflow spans, each 20 m long, with a fixed overflow elevation of 150.81 m a.s.l. The maximum water level of the weir reservoir, according to the operational regulations, is 153.25 m a.s.l. At each weir span, the pier houses a DN300 aeration pipe and an opening for the flap locking pin. Below the weir, there is a 13.2-metre-long stilling basin, 1.6 m deep, ending with three steps and a raised threshold that is 0.3 m above the reinforced channel bed. The riverbed area around the weir is reinforced with stone paving and topped with a stone embankment. It should be noted that the height difference between the upstream and downstream beds is 1 m, which significantly limits the influence of downstream overflow flooding.
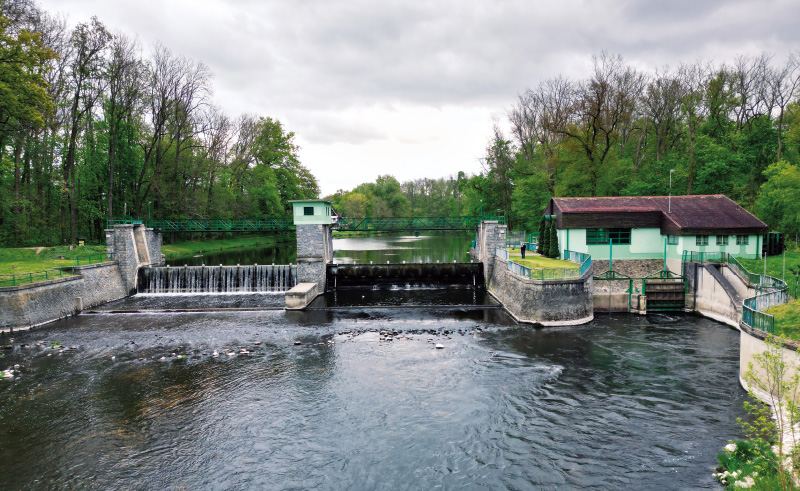
Fig. 1. Doksany weir
Strakonice hydraulic structure
Strakonice hydraulic structure – also known as Strakonice stabilising weir – is located on the Otava river in the town of Strakonice in the South Bohemian Region. The structure consists of a reinforced concrete weir with two spans, each 20 m long, on which a pair of flap gates with seals are mounted between the transverse braces. It is equipped with lifting mechanisms, machine rooms above the pillars, and a sluiceway that also functions as a fish pass. The fixed overflow elevation is 387.00 m a.s.l., which is the same as the bed elevation downstream of the overflow. The ordinary operational reservoir level is 388.30 m a.s.l., while the maximum reservoir level, according to operational regulations, is at an elevation of 388.50 metres a.s.l. The downstream stilling basin was 6 m long and 0.8 m deep. In 2019, the stilling basin was reconstructed to meet hydraulic conditions required for sufficient dissipation of the kinetic energy of water flowing over the weir gate.
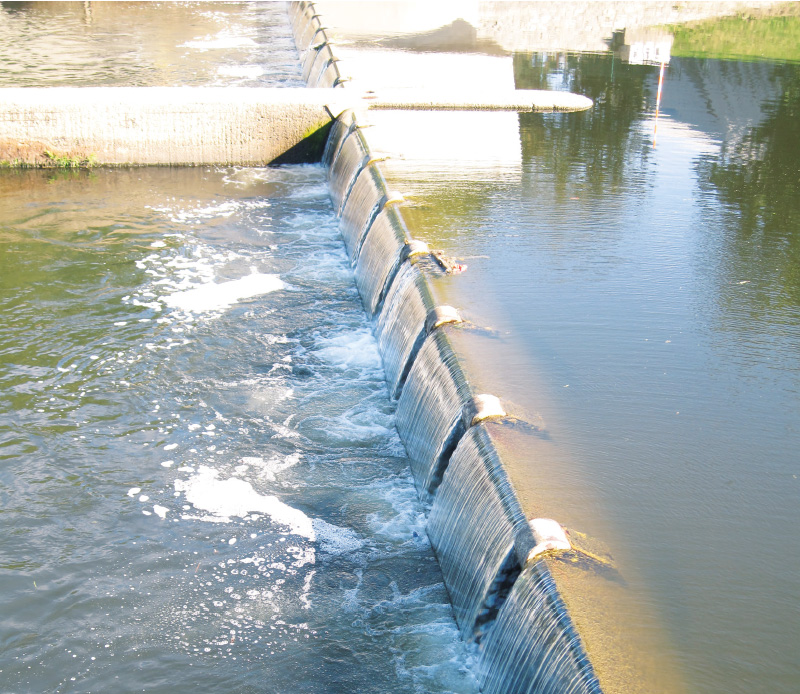
Fig. 2. Strakonice weir
Physical models
Hydraulic phenomena, water flow, and hydraulic characteristics can be studied on an actual hydraulic structure; however, for practical reasons, such research is significantly more difficult, and therefore, investigations are conducted on a scaled-down model in the laboratory. Initial, boundary, and limiting conditions are determined by dimensional, force, and mass analysis, which are based on the conditions for studying phenomena on the model using Froude’s law of mechanical similarity [3].
Two physical models were constructed for measurements in the water management laboratory. The first model, 0.4 m wide, representing Strakonice weir with a flap gate and seal, was built at a scale of 1 : 7. On this model, water levels and flow rates were measured for various flap positions with increased downstream influence, as the difference in bed elevation between the upstream and downstream sides is 0 m. The second model, 0.52 m wide and built at a scale of 1 : 12.5, represented Doksany weir (Fig. 3). Water levels and flow rates were measured on this model for extraordinary situations, such as when the aeration pipe is non-functional or when the reservoir level exceeds the maximum operating level.
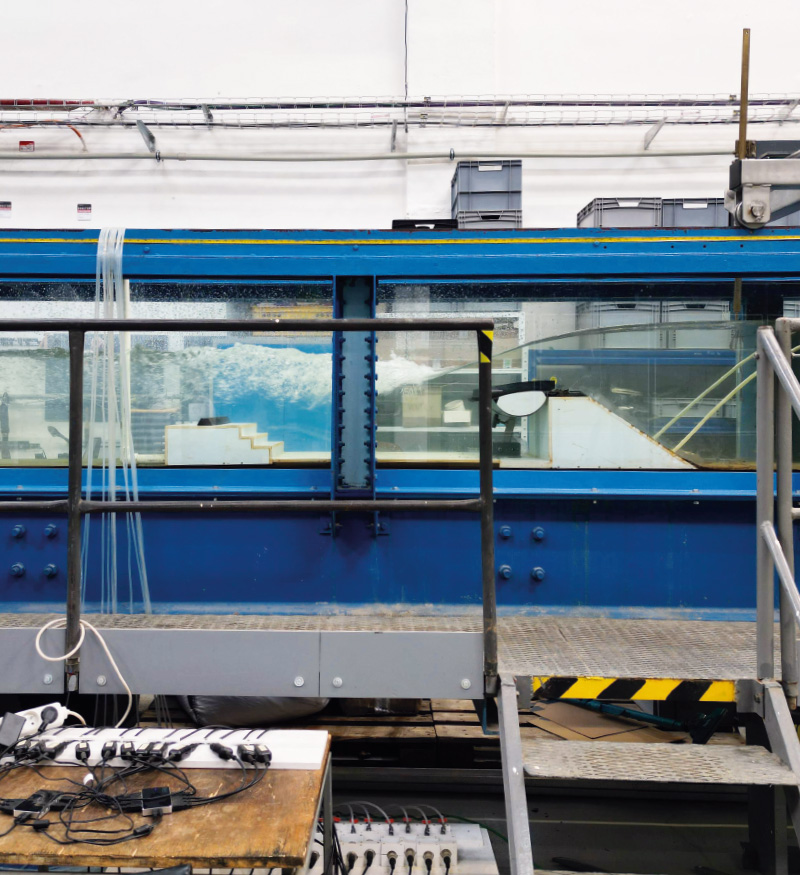
Fig. 3. Physical model of Doksany weir
Within this model, different types of baffles (types RV.x and RM.x) were also mutually assessed in terms of flow capacity (Fig. 4). However, due to the model conditions, it was not possible to determine the impact on the overflow coefficient. The conversion of individual characteristics from physical models to actual hydraulic structures can be performed using the following formulas:
- length scale ML
- velocity scale Mv = ML1/2
- flow rate scale MQ = ML5/2 [3]
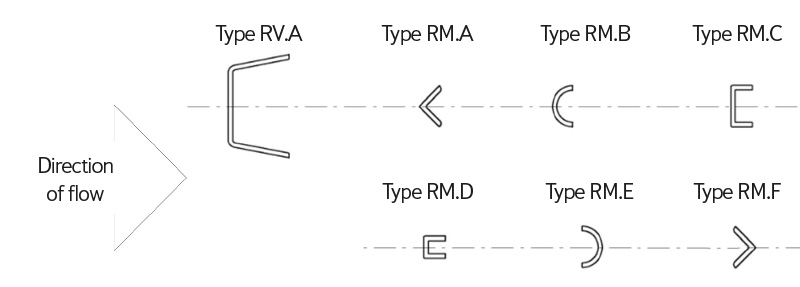
Fig. 4. Types of baffles
Mathematical model
A mathematical 3D model was only created for Doksany weir (Fig. 5), with the same conditions maintained as in the physical model, except for the model width; only half of the weir field with a length of 10 m was modelled. The computational mesh was created using ICEM CFD software, and all calculations were performed in Ansys CFX. In connection with the use of the symmetry function in the model, subsequent verification revealed that a certain degree of error had been introduced into the model, resulting in a higher flow capacity [4, 5].
The aim of selecting a computational method for determining water flow and discharge was to identify calculation uncertainties using CFD technologies. The choice of an appropriate method is crucial for minimising uncertainty in mathematical modelling; it is essential to carefully select the method with regard to hydraulic behaviour and to minimise risks during the measurement of flow in the hydraulic structure [6].
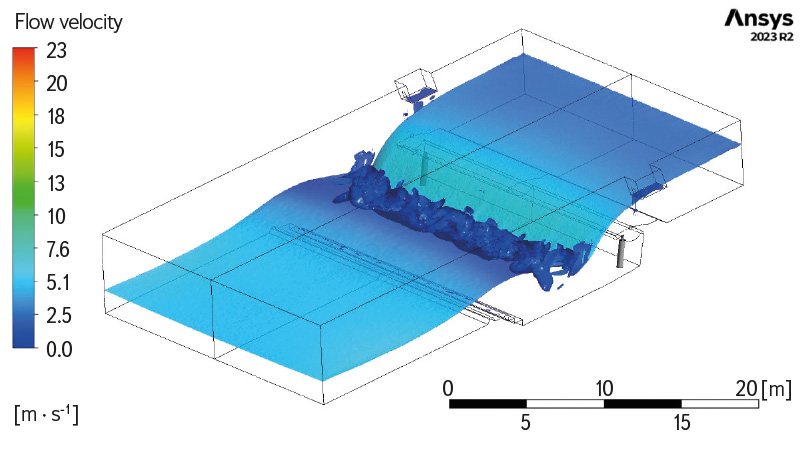
Fig. 5. Mathematical model of Doksany weir
Mathematical model of flap gate movement
In engineering practice, when calculating overflow discharge over a flap gate, water levels are often measured from the flap’s pivot point at its lowest edge. However, this approach does not accurately reflect reality. This introduces an error into the calculation of the overflow head due to a discrepancy in the tilt of the flap gate compared to its actual position, which affects the discharge curve – a critical factor for operational control. As a result, operations at the hydraulic structure become inaccurate, leading to reduced effectiveness of operational control within water management systems.
For this reason, equations describing the movement of a flap gate were derived, incorporating eccentricity between the gate plate and the bearing axis (Fig. 6). It should be noted that the equations relate to the movement of a flap gate with a radius of R = 2.25*H. Equations were also derived for the simultaneous movement of baffles together with the flap gate. All equations, including their application within calculation tools, are described in detail in the Master’s thesis titled Hydraulic Analysis of Flap Gates and Jambor Sills [7].
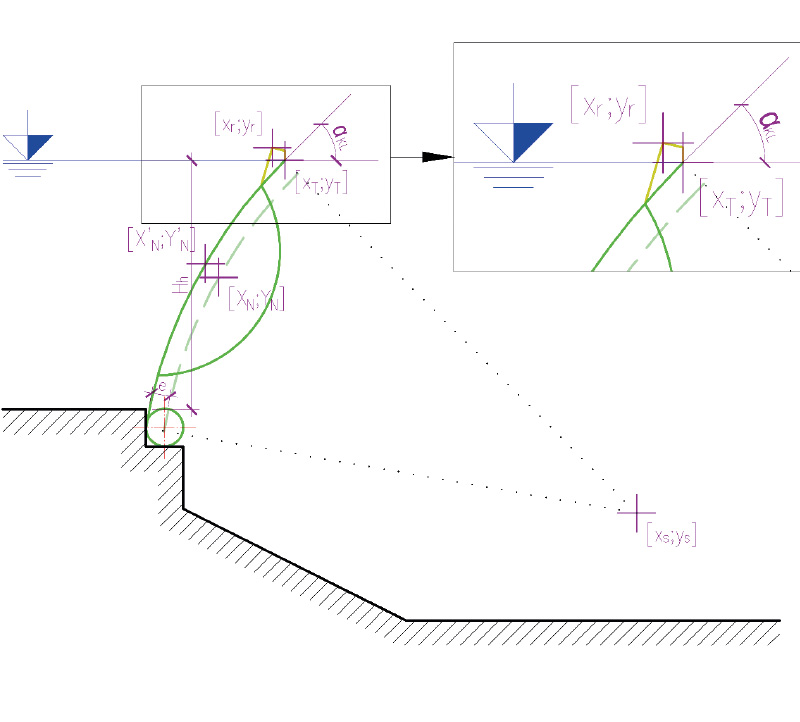
Fig. 6. Diagram of a flap gate
RESULTS
The measured and calculated data from the Doksany weir models for extraordinary situations were inserted into an existing graph with curves by J. Čábelka (CR), which allows the coefficient of the overfall µpσ to be read (Fig. 7). These data are presented in the form of points from the physical model (PM) and the mathematical model (MM), and it is not possible to construct curves from them, as each measured value corresponds to a different pressure and level of aeration beneath the flap, which cannot be measured in practice during extraordinary situations. For this reason, the values in the graph (Fig. 7) are divided according to the degree of downstream flooding for practical application, as this degree plays a more significant role in calculations for other hydraulic structures.
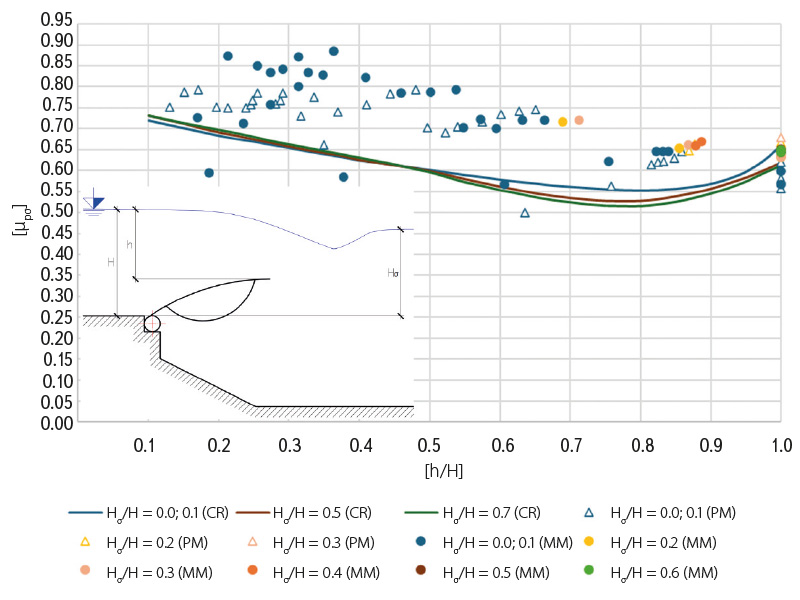
Fig. 7. Graph of overfall coefficient for extraordinary situations (non-aerated)
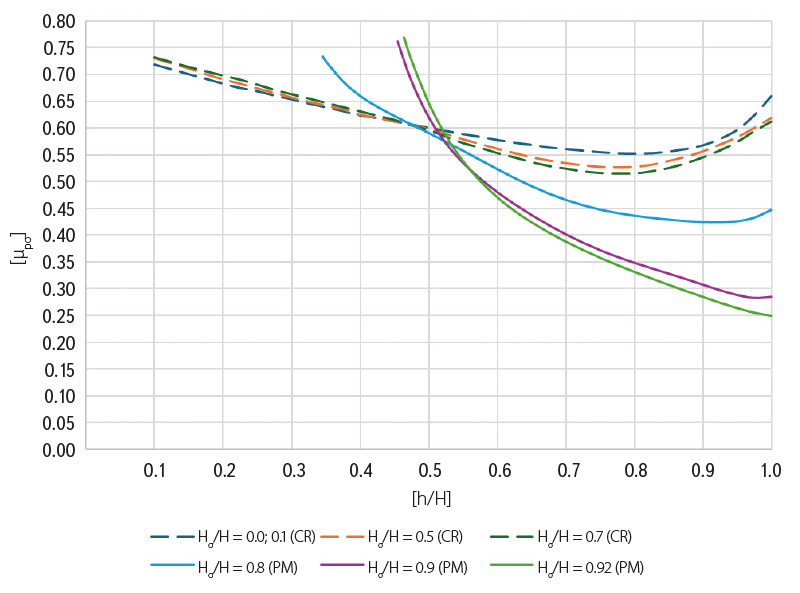
Fig. 8. Graph of overfall coefficient for ordinary situations (aerated)
Similarly, data from measurements on the physical model of Strakonice weir were inserted into the same graph by J. Čábelka (Fig. 8). However, in this case, it was possible to fit curves to the data due to the typical situation involving a raised downstream level. Compared to the current research (CR), where the ratio Hσ/H reached a value of 0.7, it was now possible to achieve a value of up to 0.92 on the physical model (PM), which will aid in the calculation of discharge curves for other hydraulic structures, such as Klášterec weir on the Ohře river. The use of the overfall coefficient is evident in the following overflow equation:
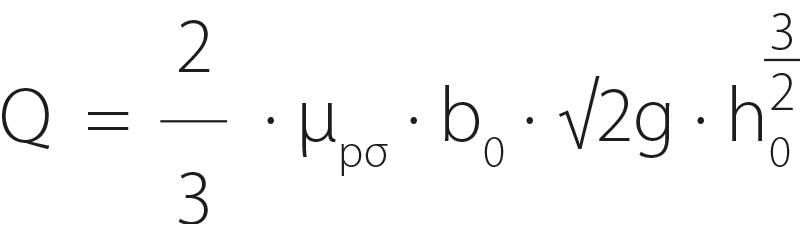
where:
Q is discharge [m3 ∙ s-1]
µpσ overfall coefficient [-]
b0 effective overflow width [m]
g gravitational acceleration [m ∙ s-2]
h0 energy head of the overflow [m]
The energy head of the overflow is calculated using the following equation:
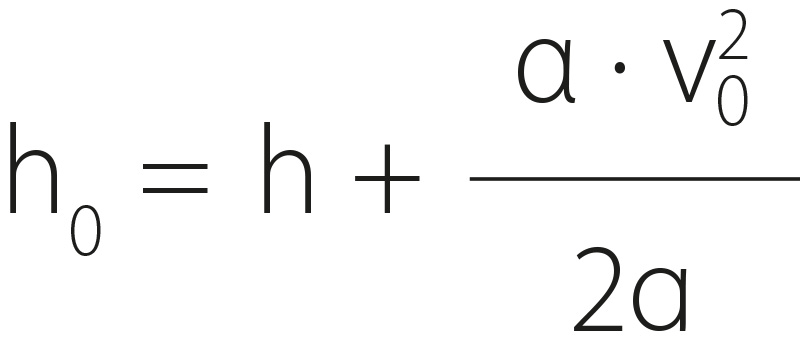
where:
h0 is energy head of the overflow [m]
α Coriolis coefficient [-]
v₀ inflow velocity [m3 ∙ s-1]
g gravitational acceleration [m ∙ s-2]
To understand how to read the overfall coefficient µpσ, it is important to be familiar with the parameters used for its determination:
H is overflow head
H height from crest of the fixed weir to the upstream water level
Hσ height from crest of the fixed weir to the downstream water level
In the course of investigations on flap gates, a practical question arose regarding the similarity of the hydraulic behaviour of a flap gate and a Jambor sill, with the focus placed on identifying a flap position that would correspond to this configuration. Based on the research of Prof. Čábelka on flap gates and V. Laco [1] on Jambor sills, it was concluded that similar hydraulic behaviour of the flap gate occurs either when the flap is fully lowered or when it is raised by approximately 5 cm above the fully lowered position, depending on sill height p (Fig. 9).
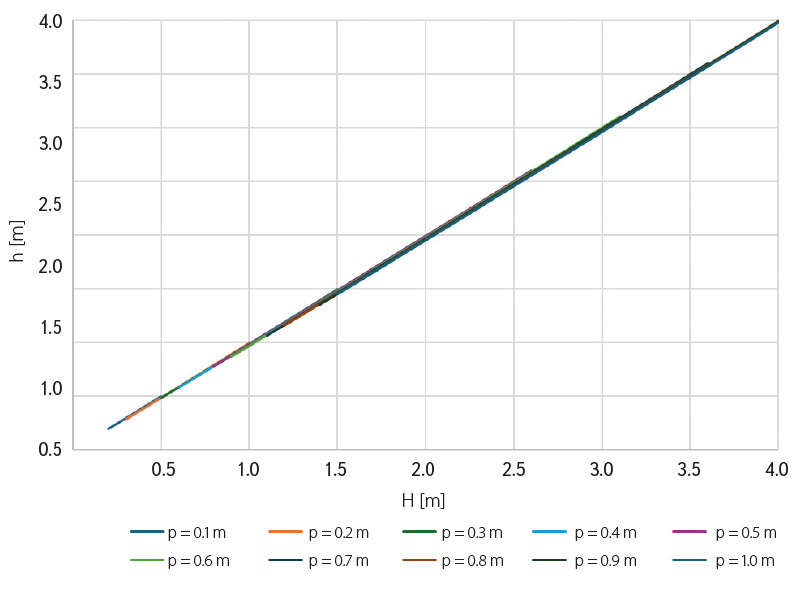
Fig. 9. Graph of dependence of a flap gate and Jambor sill
Research on the flap gate equipped with additional large baffles and interchangeable small baffles led to the identification of optimal baffle types for use on real hydraulic structures (Fig. 11), where they help to mitigate flap gate oscillation at low discharges. Optimal baffle shapes are L-profile (type RM.A) and semicircle (type RM.B), with the leading edge oriented against the direction of water flow. On the physical model of the flap gate, the baffles were arranged in the following sequence: 1× RM.x, 1× RV.A, 2× RM.x, 1× RV.A, 2× RM.x, 1× RV.A, 1× RM.x. The centre-to-centre distance between RM.x baffles was 52 mm, and between RV.A and RM.x baffles it was 60 mm. In cases without a combination with RM.x, the centre-to-centre distance between RV.A baffles on the model was 172 mm. The dimensions of the baffles themselves were adopted from or standardised according to the flap gate at Doksany weir. As part of the observations on the model, the effective overflow widths at lower discharges were monitored (but not measured). For combinations of RV.A and RM.A baffles, individual jets overflowing the flap gate were observed. In contrast, for combinations of RV.A with RM.B, RM.C, or RM.D baffles, unification of the jets at the edges of the flap gate was observed. In the case of the combination of RV.A with RM.E or RM.F baffles, the jet became unified across the entire centre-to-centre distance between the RV.A baffles. As a result, no narrowing of the effective overflow width around the RM.E or RM.F baffles was observed [7].
DISCUSSION
The results for the overfall coefficient under extraordinary conditions (Fig. 7) indicate that varying degrees of flooding of the aeration pipe result in an increase in discharge capacity. The graph also reveals a noticeable fluctuation in the results. This fluctuation was caused by the effect of unstable pressures, or rather negative pressures, which must not occur in practice, as they induce vibrations in the structure, leading to its eventual damage. Given that the percentage of flooding of the aeration pipe cannot be directly measured at the hydraulic structure during an extraordinary situation, it is also possible to use such measured and calculated values from models for other applications. However, it is necessary to include the variability of the overfall coefficient values in subsequent calculations.
In the case of the overfall coefficient for ordinary conditions (Fig. 8), higher coefficient values can also be observed with greater flap gate inclination combined with a higher degree of flooding. This may also be caused by negative pressures, as in the previous case, despite the presence of a functioning aeration pipe. However, with increasing overflow head and greater flap gate inclination, the values of the overfall coefficient in the graph demonstrate the effect of a functioning aeration pipe, as these coefficient values are noticeably lower than those observed under conditions of minimal downstream flooding. Confirmation of this hypothesis can be expected following recalculation of the discharge curves for Klášterec weir by the staff of the state enterprise Povodí Ohře, with verification based on the water management balance results between the profiles upstream and downstream of this hydraulic structure.
In connection with the above statements and in relation to the graph showing the correlation between the flap gate and the Jambor sill (Fig. 9), the values presented in this graph can be confirmed. At the same time, the graph of percentage deviations between the flap gate and the Jambor sill (Fig. 10) clearly shows the percentage deviation for different values of H. This graph confirms the similar hydraulic behaviour of the flap gate even when the flap is slightly raised by approximately 5 cm compared to the fully lowered position, for various sill heights p. To better understand the connection between the two graphs (Figs. 9 and 10), one can, for example, read from Fig. 9 that for a height H = 2 m (i.e. from the crest of the fixed weir to the upstream water level), the overflow head h ranges from 0 to 5 cm. With increasing sill height p, both the overflow head and the percentage deviation increase.
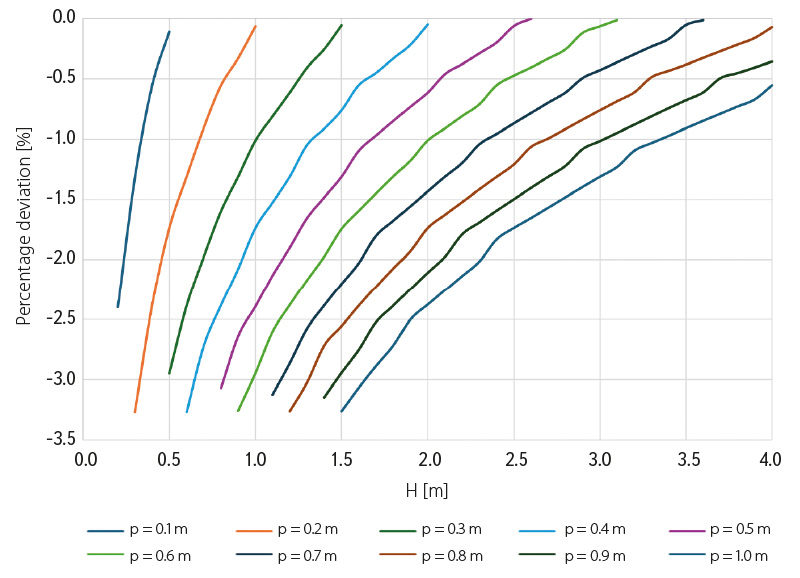
Fig. 10. Graph of percentage deviation of a flap gate and Jambor sill
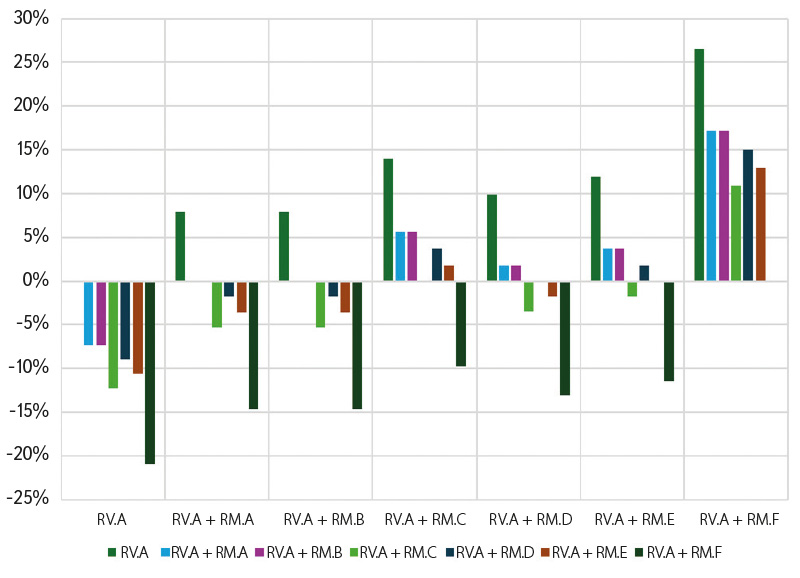
Fig. 11. Graph comparing types of baffles
Based on the comparison of baffle types, it must be concluded that determining the overflow coefficient for various baffle geometries is, in fact, irrelevant for practical use. Nevertheless, research into the hydraulic behaviour of these baffles has made it possible to identify the optimal baffle geometry for further applications – one that fulfils its function without reducing discharge capacity. The comparison graph of baffle types (Fig. 11) shows a comparison of the baffles presented in the illustration of baffle types (Fig. 4). The graph can be interpreted as indicating how much worse the baffle variants shown in the legend columns perform in comparison to the respective reference column of each baffle. For example, in the first column representing baffle RV.A, all the columns corresponding to combinations of RV.A with RM.A through RM.F show negative percentages, as these baffle combinations reduce the overall discharge capacity of the flap gate.
CONCLUSION
The results of the research described above provide new insights into various conditions and scenarios encountered on flap gates. By employing physical and mathematical models, it was possible to measure and calculate data that had been missing in previous studies, making it now possible to apply these new findings in engineering practice. Given that the flap gate is the most commonly used type of gate closure on weirs and dams in the Czech Republic and Slovakia, this research makes it possible to refine the discharge curves in existing operating rules and to correct values in automated control systems of hydraulic structures. This, in turn, enhances the safety of the structure and improves water management within the broader water management system.
For hydraulic structures equipped with flap gates designed according to J. Čábelka’s geometry, i.e. with R = 2.25H, equations describing the flap motion with introduced eccentricity can be used. This simplifies calculation procedures and eliminates errors associated with reading values from design drawings. This innovative approach offers practical benefits both in the design phase and in subsequent reassessments. At the same time, regarding the issue of flap gate vibrations caused by dynamic water loading, this research enables the use of a suitable type of baffle as a damping element, which extends the structure’s lifespan and reduces negative effects during both ordinary and extraordinary situations.
It is important to say, however, that an unexplored area of the overfall coefficient graph according to J. Čábelka is the interval of the ratio of overflow head to water level height (h/H) for values less than 0.1. Determining this would require access to a larger physical model than those used so far.
Acknowledgements
This paper was written with the support of CTU Prague grant no. SGS25/084/OHK1/2T/11 “Combined Research of Water Flow on Hydrotechnical Structures.”
The Czech version of this article was peer-reviewed, the English version was translated from the Czech original by Environmental Translation Ltd.
