ABSTRACT
The SCS–CN method is one of the most widely used hydrological methods in the Czech Republic for estimating direct runoff from precipitation events in small catchments. Its practical application is sensitive to the quality and consistency of input data, in particular land use (LU), soil characteristics defined by the hydrological soil group (HSG), and appropriately specified design rainfall. The tool, designed to utilise open data in the Czech Republic as a plug-in for the QGIS GIS platform, automates the preparation of input data and the subsequent SCS–CN analysis. Land use is derived from ZABAGED data in combination with LPIS data. HSG and design rainfall are obtained via download services provided at rain.fsv.cvut.cz.
CN values are derived based on the spatial intersection of LU and HSG layers.
The tool operates in three main steps. Within an area of up to 20 km², it automatically downloads and processes LU layers using a uniform priority hierarchy and classification scheme, and vectorises the downloaded HSG raster. It then performs geometric intersection of these layers and assigns unique CN2 values to each combination, also deriving CN3 values. For the specified design rainfall (for selected return periods or user-defined events), it calculates the depths and volumes of direct runoff. When using design rainfall from the rain.fsv.cvut.cz service, the tool weights the resulting volumes across six synthetic hyetographs and the probability of antecedent saturation (based on API), in accordance with the latest design rainfall characteristics.
The tool is published as open-source software, and its development is documented on GitHub platform. It is intended both for professional practice and for educational purposes. The tool does not include the calculation of peak discharges or hyetograph shapes, as deriving these requires additional expertise in hydrology, hydraulics, and GIS.
INTRODUCTION
The estimation of direct runoff using the SCS–CN method [1] is widely applied in the Czech Republic, particularly for determining hydrological response in small catchments, ungauged profiles, and in the design of water management measures in the landscape. The use of this method is accepted, for example, in the design of infiltration strips, swales, ditches, and other shared facilities within land consolidation projects, as well as in the preparation of spatial studies. The implementation of this method under Czech conditions has been presented in a number of standards and methodological guidelines prior to this publication. In particular, this includes the most recent methodology Soil Erosion Protection [2], preceded in the field of hydrology by the methodology Short-term Rainfall for Hydrological Modelling and the Design of Small Water Management Structures in the Landscape [3].
The conceptual approach of the SCS–CN method, which is widely used for its simplicity and clarity of methodological procedures, nevertheless has its limitations. The method itself was derived and developed for small catchments, typically a few km² in size. Its application to larger areas, additionally affected by uniform rainfall, is therefore debatable. The SCS–CN method is used to derive runoff depth, i.e. runoff volume, and does not account for changes in runoff conditions under different rainfall intensities. To obtain peak (design) discharges, it is necessary to combine this method with another approach (e.g. a unit hydrograph). A major limitation is the classification of soils into only four hydrological soil groups. This limitation can be overcome by physically based methods. An example is the Czech model SMODERP [4], which can operate with inputs similar to those used by the tool described here. However, due to their application demands, physically based models are currently used only to a limited extent and primarily in specific cases.
The SCS–CN method is implemented in a range of proprietary and open-source modelling tools, for example in the freely available HEC-HMS [5], the Czech-localised Atlas HYDROLOGY [6], and the HydroRAIN web service [7]. The tool described here is partially based on the latter. The SCS–CN method is also used by the Czech Hydrometeorological Institute (CHMI) as one of the approaches for deriving hydrological characteristics of surface waters in ungauged profiles (ČSN 75 1400).
Despite the simplicity of the method itself, its practical application is constrained by (1) the use of different data sources and their varying quality, (2) inconsistent assignment of CN values to land use (LU) classes, and (3) the need to correctly handle design rainfall and antecedent moisture conditions.
The aim of the tool developed and described here is to partially consolidate input data and derived outputs in the form of a plug-in (hereafter referred to as the “plugin”) for the open-source geographic information system software QGIS [8]. The tool standardises and automates individual steps in the processing of geospatial data using open data sources in the Czech Republic, and provides direct outputs both as geospatial layers (CN layers, direct runoff volume layers) and as tabular outputs within the QGIS environment.
The tool has been designed to be:
- practical (minimal manual intervention, step-by-step guidance),
- transparent (documentation and open-source code),
- verifiable (automated tests and input validation),
- adaptable (parameter configuration via separate editable files and modular steps under user control).
MATERIALS AND METHODS
The SCS–CN method and selected parameters
The SCS–CN method is described in a number of available publications [1–3]. Only a very brief outline of the method is presented here. The direct runoff depth H₀ from total rainfall Hs is determined by the maximum potential retention A and the initial abstraction Ia = λA (with λ = 0.2 by default), according to the following equation:
The retention is determined by the curve number (CN) according to the following equation:
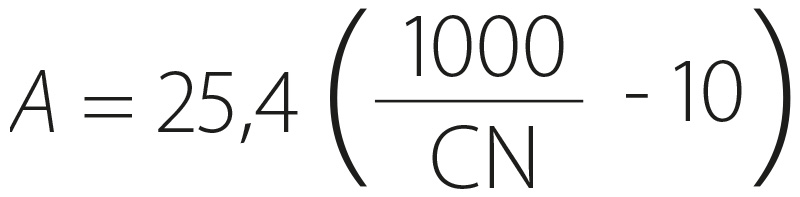 (1)
(1)
The CN value itself is tabulated for combinations of land use (LU) and hydrological soil group (HSG) for three fixed antecedent moisture conditions, based on the antecedent precipitation index. In Czech practice, the scenarios of antecedent moisture CN2 (average conditions) and CN3 (increased antecedent moisture) are used, with CN3 derived from CN2 using a standard transformation. CN1 (dry conditions) is of marginal relevance in the Czech Republic and is practically not encountered. The method was originally derived empirically for the entire USA, including arid regions.
The antecedent precipitation index is applied in a five-day form (API5), determined according to the following equation [3]:
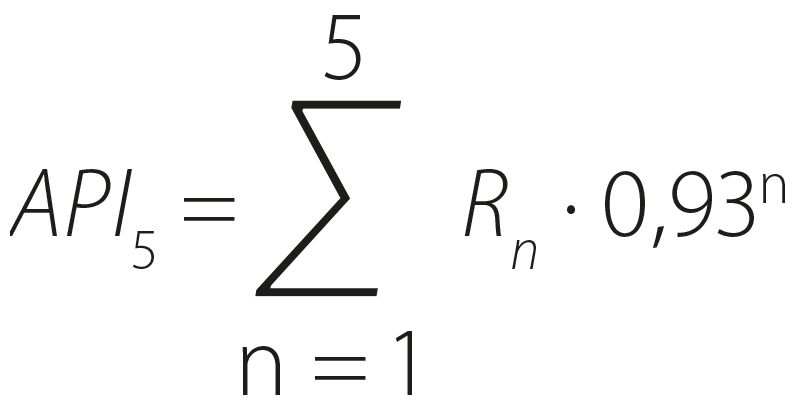 (2)
(2)
where:
Rn denotes
the 24-hour rainfall total for the period beginning n days prior to the rainfall event. A 30-day antecedent precipitation index (API30) is also used in some cases.
Technical solution
OGC web services for the automated acquisition of input vector data from open data sources use the OGC Web Feature Service (WFS) specification, which enables distributed access to spatial features, including their geometric and attribute characteristics. Within the developed tool, datasets provided under the open data framework in the Czech Republic (ZABAGED and LPIS) are retrieved using standard WFS operations. These two datasets form the primary information input for subsequent land use classification. HSG and design rainfall data are obtained via the OGC Web Processing Service (WPS) provided by the rain.fsv.cvut.cz project. To ensure smooth operation of the plugin user interface, communication with remote servers is handled asynchronously. This approach enables continuous updating of input data, a high degree of automation, and full reproducibility of the computational workflow.
QGIS processing tools
The computational workflow was implemented in the open-source QGIS environment using a combination of built-in analytical tools and functionality extended through a custom plugin. The core principle of the processing is the stepwise transformation of input vector layers representing land use (LU), hydrological soil groups (HSG), and rainfall characteristics into derived thematic layers used as inputs to the SCS–CN model. This process employs spatial overlay operations, attribute- and geometry-based joins, buffer generation, and raster vectorisation. These computational operations are carried out using standard QGIS tools executed via the Python interface PyQGIS, enabling their automated chaining and ensuring output consistency. The entire workflow is complemented by a system of input data validation and ongoing checks of computational steps, aimed at eliminating errors in the generation of CN layers and the subsequent calculation of direct runoff volumes. The objective of the technological solution is to ensure numerical stability and reproducibility of results.
Development of the custom plugin
The development of the plugin was conceived as a stepwise integration of individual analytical steps into the QGIS environment. The implementation was carried out in the Python programming language using the PyQGIS interface and the PyQt library for the development of the graphical user interface. Emphasis was placed on the modularity of the solution, the transparency of individual computational steps, and the possibility for user-defined adjustments of input parameters and layer prioritisation via configuration files in YAML format, thereby enhancing the flexibility and practical applicability of the resulting plugin.
DATA AND RESULTS
Description of the technical solution
The plugin is developed as open-source software under the GNU GPL licence and is available on the GitHub platform. Installation instructions and the user manual are available on the rain.fsv.cvut.cz website.
The workflow is divided into four consecutive steps. This allows the user to verify individual steps and use their own or modified data, thereby enabling the use of only selected parts of the workflow.
The tool validates input layers (specifically the existence and types of attributes defining land use (LU), hydrological soil groups (HSG), and CN2 values), parameter ranges (λ in the interval 0.1–0.3), the numerical format of user-defined rainfall inputs, and the structure of configuration files and CSV tables. It also includes a uniformly applied symbology for generated LU, CN, and direct runoff volume layers (using a quantile classification), comprehensive user documentation (CZ/EN, MkDocs), and a suite of automated tests implemented via GitHub Actions, verifying data retrieval, editing operations, CN value assignment, and the generation of direct runoff volume layers.
Input data and their basic processing
The model operates with national open data and other available data sources.
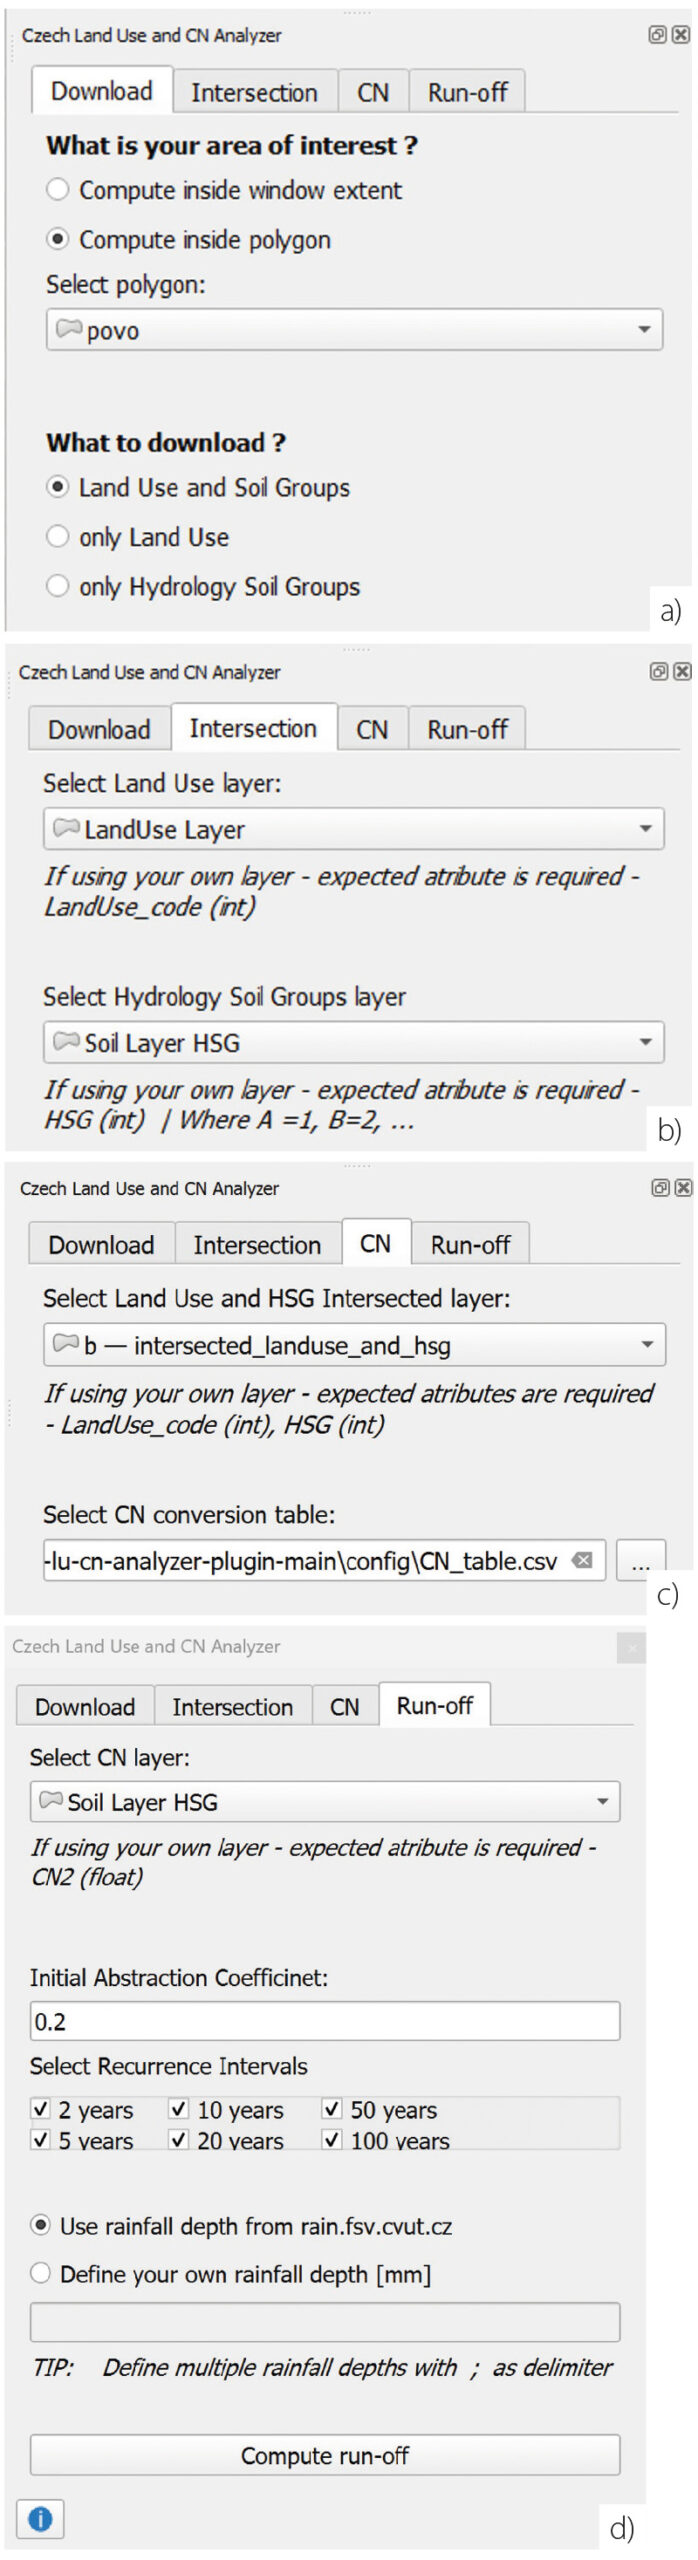
Fig. 1. Plugin interface: a) data download, b) linking LU and HSG layers, c) assignment of CN values, d) retrieving or entering precipitation data and running the calculation of runoff depth and runoff volume
Land use
The derivation of land use (LU) is based on a combination of selected ZABAGED and LPIS layers with a defined priority hierarchy. Selected linear features are interpreted as polygon features using buffers defined by attribute values. The result is a topologically consistent layer without overlaps between input layers.
Hydrological soil groups
Hydrological soil groups (HSG) are obtained using the integrated WPS service soil-texture-hsg (https://rain.fsv.cvut.cz/webapp2/ogc-wps/#1-wps), operated on the rain.fsv.cvut.cz server and used to provide soil data. The HSG layer was created using digital soil mapping in combination with pedotransfer functions (PTFs) as part of the TA CR project No. TJ02000234. The derivation is described in two publications [9, 10]. The data are provided in raster format with a spatial resolution of 20 m. HSG are not derived in military training areas, where soil mapping is not available, in areas of surface mining, in the centres of large cities, or in water bodies. The raster data are subsequently vectorised without smoothing, and values are supplemented in water bodies to enable the assignment of CN = 99 for these areas.
Design rainfall, probability distribution of hyetograph shapes and initial conditions
The plugin primarily operates with six-hour design rainfall totals for return periods ranging from two to 100 years, which were derived for the purposes of hydrological modelling [11]. In addition to the design rainfall depth itself, the plugin, in accordance with current methodologies [2, 3], incorporates the probability distribution of hyetograph shapes [12] in combination with the probability of elevated (abnormal) initial saturation conditions. The user is also allowed to specify a custom rainfall total.
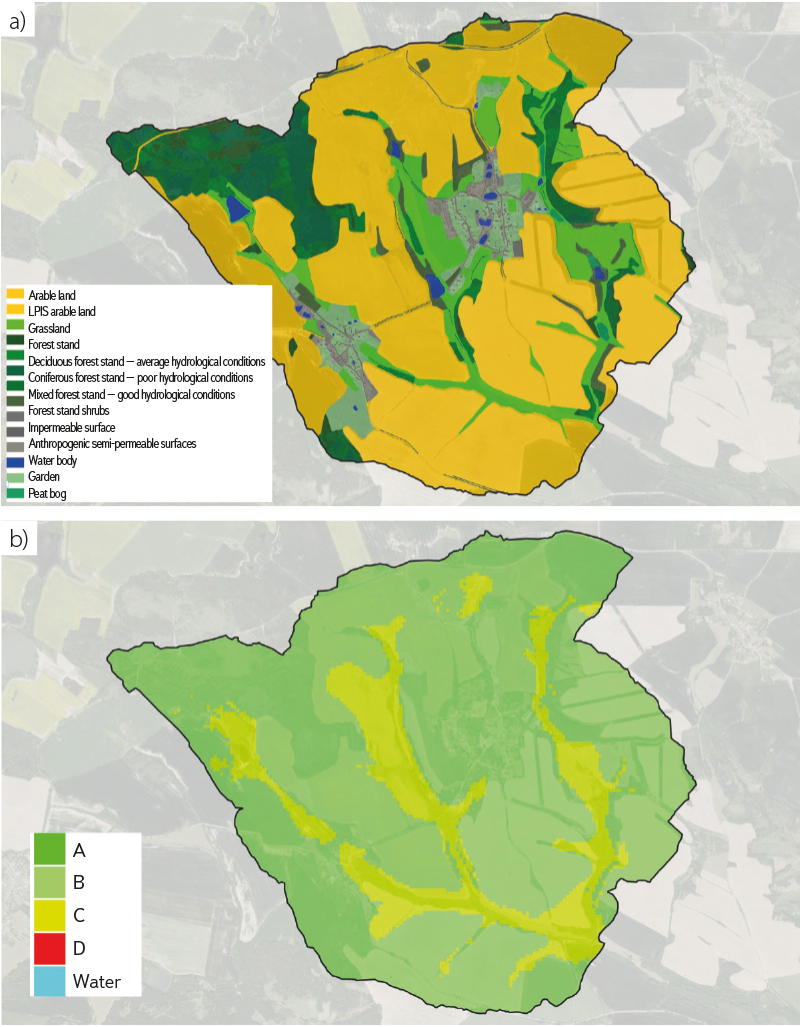
Fig. 2. Input data processed with the plugin for Třebešice and Býkovice (Benešov District): a) LU layer derived from ZABAGED and LPIS data, b) HSG
The characteristics of design rainfall (total depth, distribution of hyetograph shapes, and probability of initial saturation) for the selected return periods are retrieved via an integrated WPS service, d-rain6h-timedist (https://rain.fsv.cvut.cz/
webapp2/ogc-wps/#1-wps), which is incorporated into the plugin.
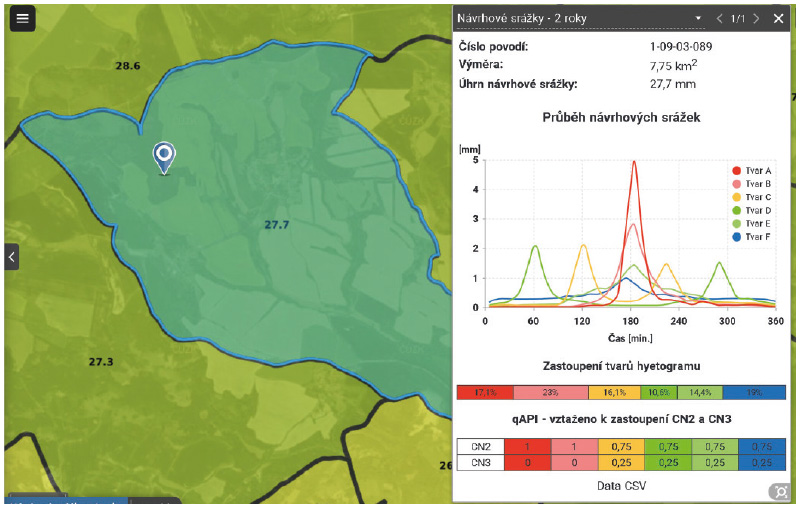
Fig. 3. Interface providing pre-prepared design rainfall data for fourth-order catchments (https://rain1.fsv.cvut.cz/); the plugin retrieves the data for the user-specified area
Assignment of CN values and calculation of runoff depth and volume
The assignment of CN values is carried out in two steps. In the first step, an overlay of the LU and HSP layers is performed. This allows the user to work directly with downloaded data, data refined to reflect actual conditions, user-defined datasets, or future scenarios/designs. This is followed by the assignment of the CN value itself based on the code designation of LU and HSP. The plugin includes an integrated CN table derived from the original United States Department of Agriculture (USDA) methodologies [1] and their interpretation for Czech conditions [2], published in more detail at https://rain.fsv.cvut.cz/scs-cn/scs-cn-met/ for average antecedent moisture conditions (CN2). For the determination of CN3, the tool applies a derivation from CN2 according to the following equation:
 (3)
(3)
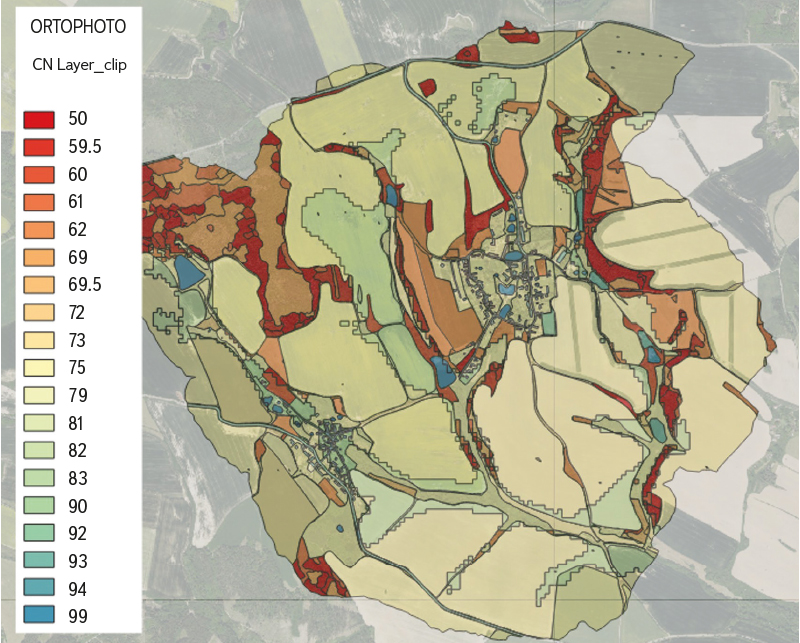
Fig. 4. Assigned CN values based on the intersection of LU and HSG layers
Calculation of runoff depth and volume
If the user employs design rainfall for N-year return periods from the rain.fsv.cvut.cz service, runoff volumes are calculated including the probability distribution of hyetograph shapes and the probability of occurrence of elevated saturation conditions. In the case of user-defined rainfall, these probabilities are not included, and the calculation is performed only for average antecedent moisture conditions (CN2).
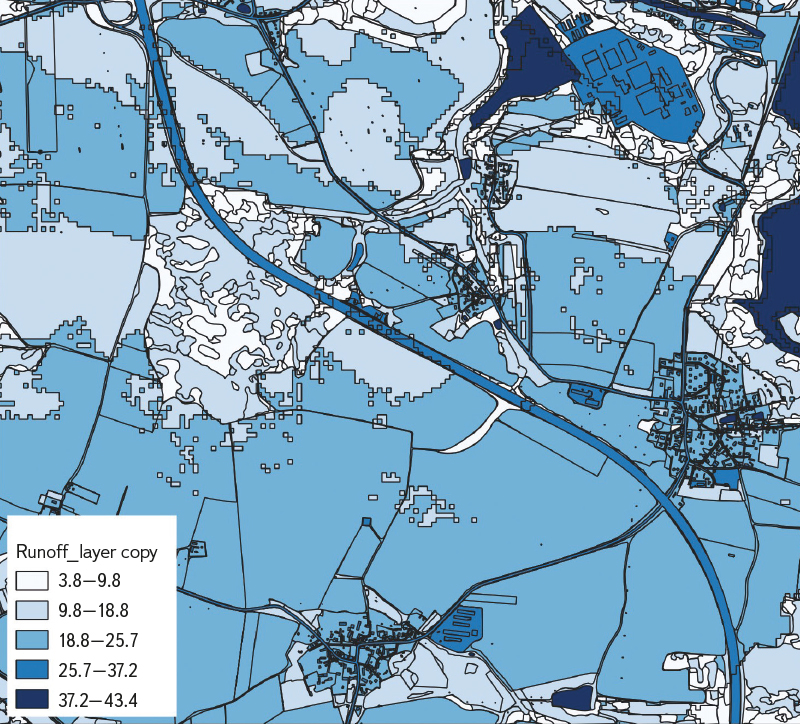
Fig. 5. Example of calculated runoff depth for individual polygons for a 30 mm precipitation event; the result illustrates which parts of the catchment generated higher direct runoff (dark blue)
The result consists of runoff depths or runoff volumes for individual polygons resulting from the overlay of LU and HSP layers. Further processing of these values and their possible aggregation is left to the GIS user. For the calculation of the average runoff depth, another QGIS plugin, Area Weighted Average may be used.
CONCLUSION
The presented plugin, “Czech Land Use and CN Analyzer” for QGIS, consolidates and significantly accelerates the practical application of the SCS-CN method for open data in the Czech Republic by automating key steps—namely, the acquisition and harmonisation of LU layers (a combination of ZABAGED and LPIS), the processing of hydrological soil groups, and their geometric integration into a unified data structure for the derivation of CN2/CN3. On this basis, the tool enables the direct calculation of direct runoff depths and volumes within the QGIS environment for both user-defined and design rainfall totals. When design rainfall from the rain.fsv.cvut.cz service is used, the tool also accounts for the distribution of synthetic hyetographs and the probability of elevated initial saturation, thereby facilitating the application of current methodological recommendations.
The detailed solution based on ZABAGED data enables the use of derived CN values not only for catchments but also for urbanised areas. These values can be applied in specialised hydrological models for urban areas, such as Storm Water Management Model (SWMM) [13]. The geometric accuracy and timeliness of land use data are determined by the accuracy and timeliness of the ZABAGED dataset.
The principal benefit of the tool lies in its transparency (open-source code), the reproducibility and verifiability of the entire workflow, and the use of consistent symbology for data layers. As a result, it is suitable both for design and applied practice (e.g. rapid identification of spatially dominant runoff sources and supporting data for the design of measures) and for education and methodological support for local authorities, where rapid orientation within a territory and a consistent methodological approach for users with differing professional backgrounds are often essential.
At the same time, it is necessary to emphasise that, within the limits of the SCS-CN method, the tool remains focused primarily on the volumes (runoff depth) of direct runoff, rather than on the estimation of peak discharges or the shape of the hydrograph, which require subsequent procedures and additional expert inputs and knowledge.
The limitations of the SCS-CN method lie primarily in the limited level of detail of soil data and in the treatment of the CN value as a static parameter. A significant source of uncertainty is the adoption of most CN values from original datasets developed in the USA. A systematic verification of CN values for the Czech Republic has not been carried out.
Another limitation of the tool is the maximum area of the processed territory, which is 20 km². The CN method itself was developed for small catchments; therefore, its results may be misleading when applied to larger areas. Further constraints arise from the web services used to obtain input data. Soil data are also provided for a maximum area of 20 km², and WFS services of the Czech Office for Surveying, Mapping and Cadastre are limited to 1,000 features per request.
The open-source code and the separation of parameters influencing the calculations into configuration files enable the straightforward implementation of new findings and further improvements. The authors welcome any comments and extensions.
Acknowledgements
This article is based on the author’s Master’s thesis [14] and incorporates findings obtained within the projects (TA CR No. TJ02000234, GA MZe No. QJ1520265), as well as the currently ongoing TA CR project No. SS06010386, Adaptation of urbanised areas to flash floods and drought.
The Czech version of this article was peer-reviewed, the English version was translated from the Czech original by Environmental Translation Ltd.
