ABSTRACT
The paper presents an analysis of water quality data from the downstream part of the Czech Elbe and the Vltava for the period 1961–2020 and compares it with archive data (reference period 1880–1913). The transport of nitrogen and total phosphorus within the catchment was compared with the output from wastewater treatment plants (WWTPs). In general, water quality in the lower reaches of the Czech Elbe has significantly improved and remains stable since 1995–2020.
Compared to the reference data, concentrations of chloride, sulphate, and total phosphorus have generally increased. Ammonia nitrogen is currently at levels comparable to those around 1900, but it only dropped back down again after 1990. However, rivers now carry significant amounts of nitrate to the ocean – previously almost unknown. A substantial proportion of the nitrate originates from diffuse sources.
Phosphorus (determined as Ptotal) is still in excess in rivers, with municipal wastewater treatment plants (WWTPs) being its principal source. The high primary production of phytoplankton in reservoirs and lower river reaches is now regulated primarily by the seasonal cycle and hydromorphological conditions for phytoplankton growth.
New pollutants have emerged, such as pesticides and pharmaceuticals. The input of pharmaceuticals occurs year-round, and the prospects for their complete removal in wastewater treatment plants remain limited.
With progressing climatic change, the following changes are to be expected: longer periods of higher water temperatures and of low flow values, and a change in precipitation regime leading to higher frequencies of sewerage system overflows. Legislation is not prepared to control it, and we should rely on implementation of the new EU Directive 2024/3019 (EU). With ongoing climate change, we expect longer periods of elevated water temperatures and low flow values, as well as a higher frequency of sewer overflows due to changes in precipitation patterns. This will significantly increase the impacts on river ecosystems and also reduce the effectiveness of current monitoring systems. Legislation is not prepared to control it, and we should rely on implementation of the new EU Directive 2024/3019 (EU).
INTRODUCTION
We now have data on water quality in Czech rivers spanning more than 50 years, and we can state that water quality in Bohemian and Moravian rivers has improved significantly over the past 30 years. Although the process had begun earlier, it was driven primarily by the “end of socialism”, which in practice meant the extinction closure of many polluting companies, as well as the adoption of an international approach to large river basins (the International Commissions for the Protection of the Elbe, Danube, and Oder – ICPER, ICPDR, ICPO), European support to the construction and upgrading of wastewater treatment plants, and so on. Another key factor is implementation of the EU Water Framework Directive (2000/60/EC), which brought a fundamental shift in the assessment of water status: it regards water bodies primarily as a heritage to be protected and evaluates rivers and stagnant waters (classified as water bodies) in a comprehensive manner – that is, not only in terms of water quality but also in terms of habitat quality, e.g. as the extent to which hydromorphological characteristics deviate from their natural state. Today we can see that around the year 2005, water quality in rivers improved significantly at the vast majority of regularly monitored sites and according to standard indicators, and it has remained relatively stable ever since. However, this also means that it is no longer improving significantly. We can therefore ask whether water quality has truly stabilised or whether improvement has merely stagnated, and we may conclude that the traditional approach to assessing water quality – based on the notion of “continuous improvement” – needs to be reconsidered, with greater attention paid to sources of pollution and the mechanisms behind anthropogenic changes in water quality. Following the already mentioned resolution of the WWTP issue, two “new aspects” have emerged in particular: (1) new pollutants – some genuinely new, others merely “discovered” thanks to advances in analytical techniques; and (2) significant changes in the rainfall-runoff regime, related to climate change. In the following section, we will focus on the Czech section of the Elbe catchment downstream from its confluence with the Vltava, represented by the monitoring sites at Obříství, Zelčín, and Hřensko.
Water quality and how it is assessed
Water quality is the sum of the physical, chemical, and biological properties of a specific water, always assessed against some standard. This standard is either its suitability for use (e.g. drinking, industrial, etc.) or its deviation from natural conditions. The natural state is primarily shaped by the region’s geology and precipitation patterns, while deviations are generally anthropogenic, i.e., pollution. Assessing water quality involves a series of interconnected activities – including sampling and field measurements, laboratory analyses, and subsequent evaluation of results – collectively known as monitoring. The outcome of this process is a set of data tables corresponding to each monitored site, stored in primary databases. It is only at this point that the actual assessment begins, which can be conducted using various approaches.
The next step is to present the results, which may be:
- general – the processing of measured values,
- “limit-based” – assessed against commonly recognised threshold values,
- classification into categories (such as quality classes, ecological status categories, etc.).
In the first case, we obtain data series and statistically processed values (e.g. averages) expressed in absolute SI units (such as concentrations in mg/l, substance flux through a profile in g/s or t/day). In the second case, the outcome is merely a statement that values are “within the limit”, a limit we may not even know and which can be changed or “updated” at any time. In the third case, we receive only a “class” that represents a complex combined assessment of multiple factors (and the definition of the class may also be “updated” over time). All three basic types have their advantages and disadvantages. The first case is the “only correct” approach because its published results are and will remain usable and comparable over long time series and can be further processed. However, it is problematic for simple assessment, as a lay user does not know “what is correct.” The second case provides information in the context of the present, because as long as the (currently accepted) limit is not exceeded, there is no qualified reason to take any measures. The third case – categorisation into classes – has a long history. Currently, two types are in use in our country. We have a unique national standard, ČSN 75 7221 Water Quality – Classification of Surface Waters according to selected physical, chemical and biological quality indicators. Waters are then classified into five classes ranging from “Unpolluted” to “Heavily Polluted.” For the basic indicators (BOD-5, COD-Cr, N-NH4, N-NO3, Ptotal, and the saprobic index of macrozoobenthos), the class is determined by the most adverse classification among the individual indicators, according to the threshold values in the class table. Additionally, a range of “other” indicators can be used as needed, in accordance with prescribed procedures. At the end of the classification process, the relevant sections of watercourses are marked on a map with the corresponding colour (ranging from light blue to the worst – red). Based on these, changes in the coloured sections on the map can be compared over two-year periods to assess “improvement”. For a lay user or for summary information, this is almost perfect; for an objective professional, less so. The first issue lies in setting fixed class limits along a continuum of results, which is, however, a problem inherent to any categorisation. The second issue is more serious: the standard has been updated several times – namely in 1989, 1998, and 2017. This, of course, always changed the classification of the same river sections without anything actually happening on them – so, generally, it can lead to misunderstandings or even misinformation: for laypeople, suggesting “things are improving,” and for some professionals, fostering an undue optimism that “we are improving because we are treating well.” A different approach to classification is part of the assessment of water body quality for the purposes of the Water Framework Directive. For this, water quality is only one part of the ecological status assessment of water bodies, which are defined as parts of catchments, not just sections of watercourses. The levels of basic physico-chemical indicators and nutrients (nitrogen, phosphorus, etc.) are assessed as factors supporting the biological elements of the ecosystem (which includes macrozoobenthos, phytoplankton, and fish). At the start, there are basic tables of measured data; however, the evaluation focuses on deviation from an established reference condition for individual types of water bodies – which, among other things, means that water quality is never compared between a spring and the lower course of a river. The philosophy of the Water Framework Directive generally also accounts for shifts in reference conditions. The chemical status of water bodies is assessed separately, based on the presence of priority substances listed in progressively updated annexes. Across Europe, the chemical status remains unsatisfactory even today; by 2021, only 21 % of European water bodies had achieved a good chemical status [17]. This is partly result of advances in analytical methods, as priority substances and various hazardous or risky compounds are gradually being detected in more water bodies, so “simple improvement” cannot yet be expected here. However, water bodies are assessed in six-year cycles as part of the River Basin Management Plans. This differs from regular water quality monitoring, conducted at a basic frequency of 12 times per year by watercourse managers (River Basin Authorities), whose data we use here.
We will further use only the first type of data processing – that is, results from regular monitoring conducted 12 times a year, presented as annual averages or annual cycles – and we will “assess” only changes and their possible causes and correlations. We thank the Vltava and Elbe River Basin Authorities for the data.
DATA SOURCES AND METHODOLOGICAL APPROACH
Even Cosmas knew (and wrote at the very beginning of his chronicle [1]) that Bohemia is drained by a single river, called the Elbe. He mentions the Vltava a few lines later and describes how people stopped by it (in what was reportedly a deserted landscape) and named it after their chieftain. Although northern Bohemia is drained by the Nisa and Smědá into the Oder, we shall remain within the Elbe catchment. It can be divided into three parts: (1) the Vltava catchment, (2) the Elbe catchment upstream of its confluence with the Vltava, and (3) the “common section” from the confluence (Mělník) to the border profile at Hřensko. In this text, we work only with data taken from yearbooks, databases, and the cited literature. For comparison, we have excellent historical data from F. Ullik [2], who published daily measurements of basic water quality parameters in Děčín for 1877, and from F. Schulz [3], who processed annual measurements taken at monthly intervals upstream and downstream of Prague in 1913. Their analytical methods are reliable, and the data have only been recalculated to match today’s standard for expressing results. In the 1960s, regular monthly monitoring of water quality in Czech (Czechoslovak) rivers gradually began, and the results have been stored by the Czech Hydrometeorological Institute (CHMI). They were first published in printed yearbooks and later, up until 2009, were publicly accessible on the CHMI website; this is described in more detail in [4]. In 2010, the International Commission for the Protection of the Elbe also issued the final “Value Tables” [5], covering profiles from Němčice and Zelčín all the way to the sea; data from the German profiles are still freely available online. More recent data are accessible only upon request and agreement with their providers – the Povodí Labe and Povodí Vltavy, state enterprises, to whom we would once again like to express our thanks for making the data available. For the key indicators of water quality, we now have monthly data (concentrations, discharges, etc.) covering 50 years or more, and we can retrospectively confirm that these are reliable data, verified by European analytical standards and quality management systems. For calculating transport, we used published daily discharge values for the dates on which samples were taken; for each year, we therefore have 12 “situations” that serve as the basis for calculating annual transport and the contributions from individual sub-catchments. The analytical methods used throughout the entire period are comparable. In addition to gradual modernisation – the introduction of instrumental laboratory methods – it is important to note a methodological change around 1999 concerning the determination of ammonia and nitrate nitrogen, phosphorus (total and P-PO₄), and chlorophyll. This involved the introduction of more selective methods and also the unification of procedures across the whole of the Czech Republic, which was particularly significant for phosphorus and chlorophyll. What is essential is that the change did not affect the time series of nitrogen concentrations, and since then, the concentration values for total and phosphate phosphorus as well as chlorophyll have been entirely reliable. Tab. 1 presents three key monitored profiles representing the aforementioned three river sections or catchments. The Obříství and Zelčín profiles were introduced in 1993 to replace the previously used Na Štěpáně and Vepřek profiles – this was only a slight downstream shift, and the time series were seamlessly continued.
Tab. 1. Monitored profiles and their basins
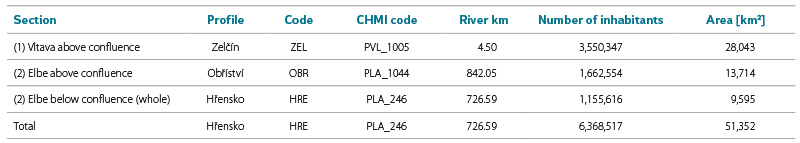
Changes in water quality and the controlling factors in the Vltava upstream of the Slapy Reservoir have been thoroughly analysed by the teams of L. Procházková and J. Kopáček [6–8]. We have already attempted to process data from the lower section down to the confluence (excluding reservoirs), which is significantly influenced by Prague, and to generalise the trends in water quality in the major Czech rivers [4, 9, 10]. We now present, for the first time, overviews of the entire temporal development up to 2020.
For comparing transport and “sources”, we used data on discharges from point sources – WWTPs – for the key indicators of water quality. There are several databases available; here, we used publicly accessible data from the Public Administration Information System (Informační system veřejné správy, ISVS) for 2022, focusing on municipal WWTPs serving more than 1,000 inhabitants. In summary, this represents approximately 75 % of the population calculated according to population registers (as shown in Tab. 1), or over 90 % of the population connected to public sewerage systems and WWTPs.
The Vltava differs significantly from the Elbe as a river, and not only because upstream of their confluence it has twice the catchment area despite having the same average discharge. The Elbe rises in higher mountains, flows through flat terrain, and, although it has numerous weirs, it has no major reservoirs. From the confluence, it continues all the way to the sea, passing through a short gorge between Děčín and Pirna. The Vltava flows from Lipno Reservoir through a deeply incised valley that opens out in the České Budějovice Basin and broadens slightly near Prague. Number of significant hydraulic structures are built on the river – deep reservoirs with long average retention times and probably considerable sedimentation. During dry periods, the lower Vltava is supplemented by releases from the Orlík Reservoir, which influences the flow regime as far downstream as Hřensko, or rather at the Děčín gauging profile.
RESULTS
Development of water quality at the Hřensko border profile
The development of key water quality characteristics at the Hřensko profile largely reflects overall trends in the Czech Basin, both in terms of pollution from point sources (municipal and industrial) and changes in agriculture and land management, meaning pollution from diffuse sources. The contribution from point sources can be quantified based on data from pollution producers, although with a certain degree of uncertainty; however, the overall uncertainty for diffuse sources is much higher, especially for the lower reaches of large rivers. Furthermore, diffuse sources “respond” to current weather conditions (precipitation, drought, etc.), whereas when balancing point sources, we have so far been unable to fully address the issue of sewer system overflows.
A typical example of the historical development of water quality is the monthly variation of BOD-5 and COD-Cr values at the Hřensko profile from 1961 to 2020, presented in Fig. 1 (COD measurements only began in 1971). It is clear how organic carbon load in the watercourse gradually decreased (with a turning point around 1995) and has since remained relatively stable. The graph shows seasonal fluctuations, and upon closer analysis (Fig. 2), it becomes apparent that the seasonal pattern of BOD-5 in recent years correlates significantly with chlorophyll-a concentration, that is, it is controlled by the current production of phytoplankton. This correlation is even stronger in the Vltava at the Zelčín profile and lower at the Obříství profile. Fig. 2 presents correlations for the most recent decade, 2011–2020 (n = 120), covering markedly different years. In all profiles, phosphorus concentration (Ptotal) remains in surplus throughout the year, so the varying phytoplankton production (besides the seasonal cycle) is probably determined by differences in the watercourse morphology.
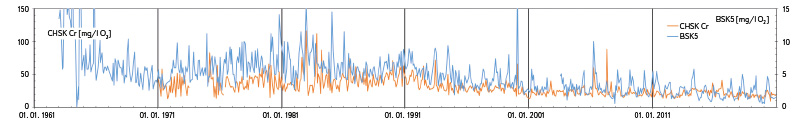
Fig. 1. Trends in BOD- and COD values 1961–2020
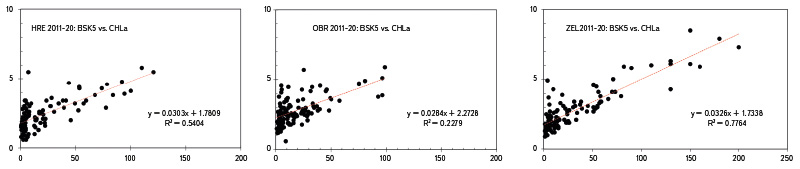
Fig. 2. Correlations of BOD-5 values and chlorophyll-a concentrations 2011–2020
Significant changes are observed in the concentrations of ammonia nitrogen (N-NH4) and nitrate nitrogen (N-NO3, measured only since 1967). Ammonia nitrogen practically disappeared between 1990 and 1995, and measurable concentrations in the monitored profiles today occur only sporadically, mainly in winter. A comparison with the Podolí profile (Vltava above Prague) shows that in the Obříství, Hřensko, and partly Zelčín profiles, N-NH4 originated from point sources, particularly municipal but also non-municipal sources on the Elbe. The theoretical oxygen demand for N-NH4 nitrification was comparable to the BOD-5 values at that time. Currently, nitrogen in the rivers is present almost exclusively as nitrate. WWTPs now mostly discharge nitrogen in the form of nitrate, and wastewater discharge balances indicate that a significant source of nitrate today is the “landscape,” meaning input from diffuse sources. This, however, is a general problem because nitrate is stable and can only be removed from watercourses through denitrification, that is, bacterial reduction to atmospheric nitrogen (with a certain proportion of the greenhouse gas nitrous oxide). Given today’s minimal discharge of organic carbon (Fig. 1), oxygen conditions in large watercourses remain stable, and nitrate flows into the ocean, where it positively influences primary production and contributes to global climate change. Nitrate concentrations and their transport by rivers now show significant seasonal variations (generally peaking in January/February), corresponding to runoff from the landscape linked to precipitation and flow regimes, as well as biological processes dependent on temperature cycles. This should not reduce the obligation of WWTPs to remove nitrogen from wastewater; however, the era of massive N-NH4 concentrations is behind us. Phosphorus (unlike nitrogen, which can be “returned to the atmosphere”) does not disappear once it enters the river and is transported to the ocean. During the growing season, the persistent excess of phosphorus supports primary production of phytoplankton, especially in reservoirs and the lower reaches of rivers.
In recent years, chloride concentrations in the Elbe have remained fairly stable, whereas sulphate concentrations have steadily declined, reflecting the abatement of the acid rain period documented for the upper Vltava by Kopáček et al. [8], including decreased fertiliser use in the upper Vltava catchment since 1990. The situation in the German section of the Elbe is comparable today – published data from the Magdeburg profile are similar to those from Hřensko and Schmilka; however, chloride and sulphate levels there are influenced by the relatively mineral-rich Saale River.
Input from the Upper Elbe and the Vltava
For comparison of inputs, it is necessary to convert concentrations and discharges into transport, which can be quantified in units of [g/s] or [tons/yr]. Calculating the value of concentration and daily discharge yields 12 “situations” per year at regular intervals, which can be used to compute the annual total transport. It must be emphasised, however, that a substantial portion of the calculated variation in transport is attributable to fluctuations in discharge. Fig. 5 presents annual transport values in tonnes/year for 2011–2020. Total transport at the confluence of the Elbe and the Vltava has been added to the data from the gauging profiles. Given the size of the river, there is no relatively large pollution source between the confluence and the Hřensko profile (in terms of the ratio of discharged wastewater volume to river flow), and the difference between the summed values reflects the effects of biological processes along the stretch from the confluence to Hřensko: the gradual nitrification of ammonia nitrogen to nitrate, and a decline in residual BOD with an annual cycle corresponding to phytoplankton production. Temporal changes also show the impact of the 2013 flood, which significantly increased transport (except at the Obříství profile, as its catchment was not affected). For most of the monitored conservative indicators, the input from the Vltava at the confluence is generally slightly higher than from the Elbe; however, simple comparisons are problematic, as the Vltava regularly has higher summer flows due to releases from Orlík Reservoir. As seen in Figs. 1, 3, and 4, the past decade also shows a decline in total phosphorus and sulphate loads; chloride input has remained fairly constant.
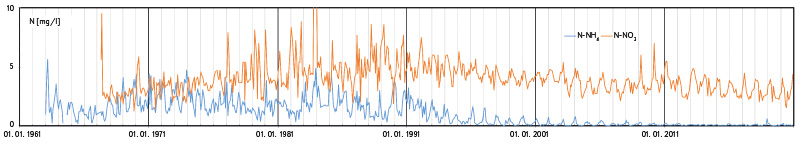
Fig. 3. Trends in ammonia and nitrate nitrogen concentrations 1961–2020
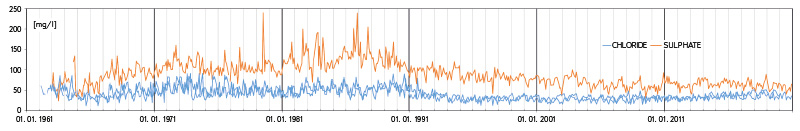
Fig. 4. Trends in chloride and sulphate concentrations 1961–2020
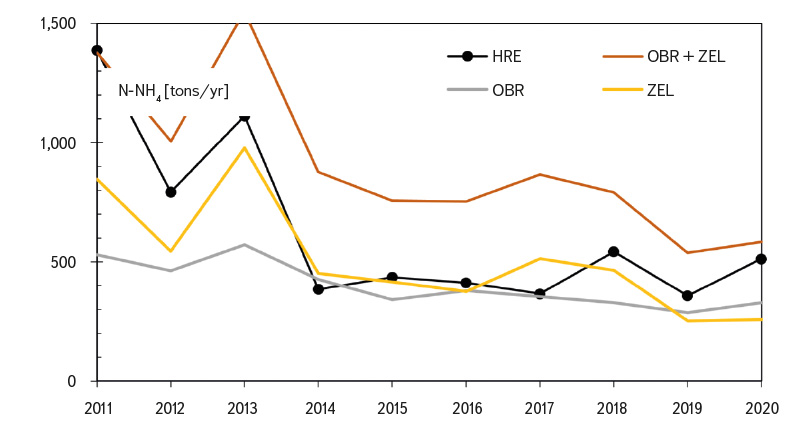
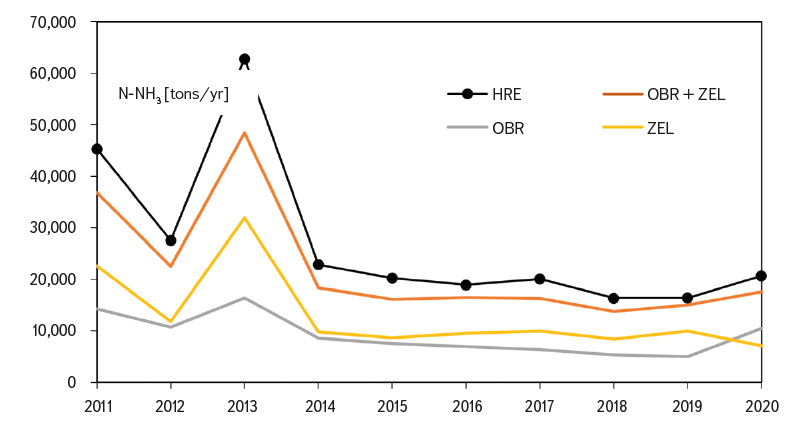
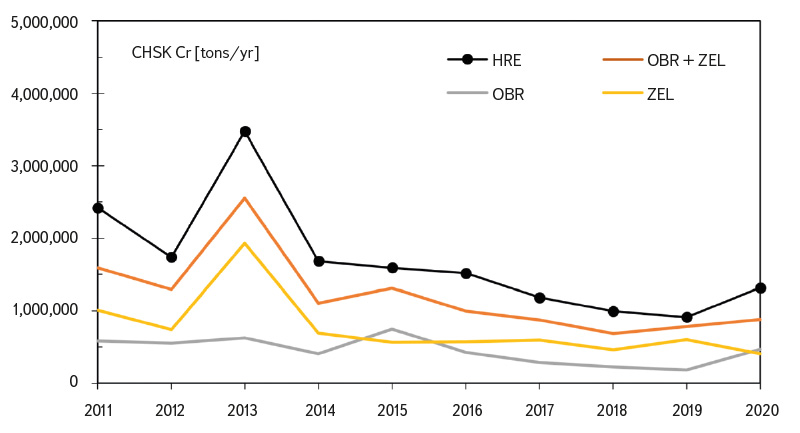
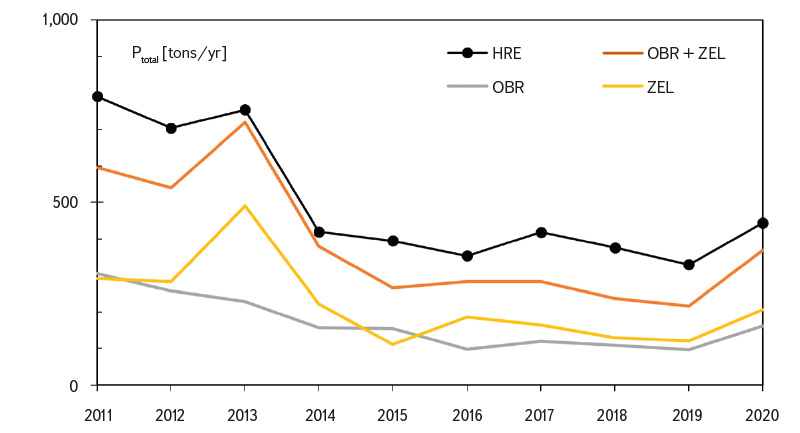
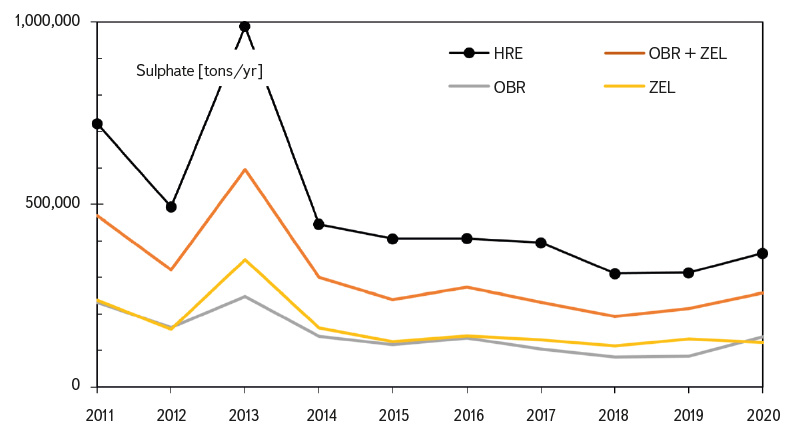
Fig. 5. Transport [tons/yr] through Hřensko, Obříství and Zelčín profiles 2011–2020; OBR+ZEL means the sum of entries at the Vltava/Elbe confluence
A civilisational issue – pharmaceuticals
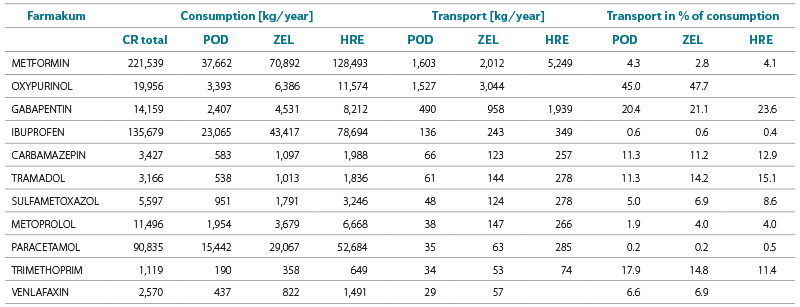
In the previous two chapters, we have shown that pollution in the Czech part of the Elbe catchment is entering a stationary phase, with only the remaining persistent and still unresolved issue of nitrate and phosphorus – in other words, eutrophication. However, this applies only to the “standard indicators”; with progress and greater comfort come new pollutants of all kinds. Some are genuinely “new”, while others are “old” substances that we are now identifying thanks to new analytical methods and a broader interest in environmental quality. One important group consists of pesticides used in agriculture; another is the so-called PPCPs – “pharmaceuticals and personal care products” – such as dietary supplements, cosmetics, and similar substances. Pesticides enter water bodies from diffuse sources, while pharmaceuticals and PPCPs reach aquatic ecosystems exclusively after use, via sewer systems and municipal WWTPs – that is, from point sources. These are organic compounds that can be identified as individual chemicals or narrow groups, and are subject to various environmental protection standards, including requirements to determine their environmental toxicity. With pharmaceuticals in particular, the challenge lies in the fact that different types of toxicity only manifest at concentrations significantly higher than those typically found in nature, specifically in rivers. These “residual” concentrations do not act as toxic substances but as biologically active compounds that influence the behaviour of aquatic communities in general, for example, their reproductive cycles or responses to predators. Moreover, these substances act jointly and cumulatively and also pose a significant risk to water use. Pharmaceuticals cannot be banned, and their consumption is generally increasing worldwide. According to public reports (State Institute for Drug Control, SÚKL), the average resident of the Czech Republic (and Europe) now consumes roughly 650 DDDs (Defined Daily Doses) of pharmaceuticals per year; moreover, these reports do not include dermatological applications, such as the relatively toxic diclofenac. Fifteen years ago, the figure was only around 500 DDDs [4], although reporting practices may also have changed. For the most commonly used pharmaceuticals, transport via the Vltava through Prague and to Hřensko for 2017–2020 (n = 48) is presented in Fig. 6, adapted from publication [11]. Tab. 2 is important, as it presents theoretical consumption figures within the catchments of the gauging profiles, calculated based on total pharmaceutical consumption in the Czech Republic and the population of the respective sub-catchments. Seasonal variations in transport can be demonstrated only in certain cases (e.g. medicines for upper respiratory tract infections). The scope of this article does not allow for an analysis of pharmacological studies on excretion rates of the monitored pharmaceuticals by users themselves. Therefore, based on the transport data, only the percentage of pharmaceutical consumption that ends up in rivers was calculated. The highest percentage is observed for Allopurinol/Oxypurinol, followed by the psychopharmaceuticals Carbamazepine, Gabapentin, Tramadol, and the antibiotic Trimethoprim. As shown in Fig. 6, resistant pharmaceuticals are already entering Prague (as a major source area from the Vltava catchment) even after passing through the Orlík and Slapy reservoirs, which together have an average retention time of over 100 days. Both the graph and the table refer to the “parent compounds,” not to pharmaceutical metabolites, whether excreted directly by patients, transformed in WWTPs, or further transformed in the watercourse itself. Some metabolites are known and monitored (e.g. ibuprofen metabolites); however, in most cases such analyses are rare for various reasons.
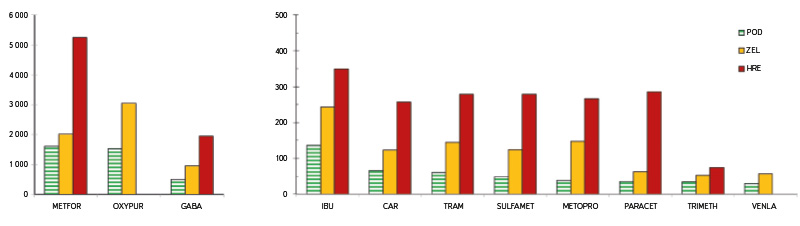
Fig. 6. Transport of pharmaceuticals through profile Hrensko; sequence on the X-axis corresponds to that in Tab. 2
Tab. 2. Transport and consumption of pharmaceuticals in the whole basin
Further analysis can be conducted using WHO data on the excretion of consumed pharmaceuticals, although this inevitably increases the degree of uncertainty and speculation. For example, Metformin and Gabapentin are reported to be excreted 100 % as the parent compound, as is the active metabolite Oxypurinol for Allopurinol. A fundamental problem remains that effective technological processes for the removal of all pharmaceuticals in WWTPs are not yet available. Although the increasingly implemented advanced treatment of drinking water sourced from surface waters offers protection to consumers, this does not address the core issue at its source. Once again, we must rely on the new Directive 2024/3019 [12], which aims to gradually tackle this problem. The further fate of pharmaceuticals along the stretch from Hřensko to the sea can only be speculated upon, based on the limited data available from the FGG Elbe servers [18]. Currently, only data from the year 2023 are available for comparison. In general, concentrations correspond to those observed in the Czech Republic; however, the difference is that on the 315 km-long section from Schmilka (the border) to Magdeburg, there are no relatively large sources (the ratio of WWTP output to river flow is low). Metformin concentrations decrease along this stretch, while concentrations of Carbamazepine, on the other hand, increase. Pharmaceutical consumption and the level of WWTP treatment are certainly comparable.
DISCUSSION
In the previous chapter, based on the results we demonstrated that pollution in the lower reaches of the Czech sections of the Elbe and Vltava rivers continues to decrease; however, the problems of eutrophication persist, and new pollutants are emerging. This implies further development in water quality monitoring, both in terms of analyses and in the evaluation of their results. Besides the search for and monitoring of additional pollutants, it is essential to improve the sensitivity of methods for detecting “standard” pollutants, because they have not disappeared; rather, their concentrations have fallen below the detection limits of current methods. This is especially critical for pharmaceuticals, but it also applies, for example, to mercury and ammonia nitrogen.
An analysis of these issues and general guidelines for addressing them (including ways to establish limits) are provided, for instance, in the European standard ČSN ISO EN 5667-20 [13]; nevertheless, the issue of overall assessment remains, as described in the introduction to this article.
There are two types of pollution sources, which differ significantly both in the nature of the substances they produce and in their characteristics. Diffuse sources are fundamentally dependent on the annual cycle (including agricultural activities) and precipitation. Point sources represent a steady (or predictable) input in terms of the content and “production” of substances; however, they typically discharge treated wastewater into variable rivers or recipients. The amount of pollution in watercourses further depends on in situ transformation processes, which are influenced by temperature as well as flow (dilution and longitudinal transport). The temperature cycle fundamentally influences the transformations of nitrogen (nitrification, possibly denitrification and losses to the atmosphere), organic carbon (BOD-5 and COD), and phytoplankton production (chlorophyll-a concentration), since phosphorus, as a key component of eutrophication, is generally in surplus in large rivers. In contrast, conservative constituents such as chloride and sulphate remain unchanged in the watercourse. When calculating transport (concentration × flow), it generally holds that concentrations are relatively conservative components, and the main cause of variability is fluctuation of flow values. Regarding the development of concentrations of “standard water quality indicators”: ammonia nitrogen concentrations have decreased since their peak around 1985 to levels reported in the Elbe by Ullik in 1887, and also “below Prague” in 1913 [2, 3]. However, current concentrations remain stable at around 4 mg/l of nitrate nitrogen, which was a relatively unknown anion in their time. Currently, we must acknowledge the “nitrogen paradox” [14], which essentially states that the cleaner a (large) river is, the higher its nitrate nitrogen concentrations tend to be. Given the significant contribution from diffuse sources, the possibility of reduction is nowhere near. As opposed to phosphorus in inland waters, nitrogen is the key problem for the sea, and the risk of ocean eutrophication is already manifesting in coastal seas [15]. We also currently observe significantly higher concentrations of chloride and sulphate, as well as phosphorus, although the issue of eutrophication in the entire river network is only about 50 years old.
Phosphorus, as opposed to carbon and nitrogen, cannot leave the river and return to the atmosphere, and is gradually transported downstream to the sea. Its transport can therefore be compared with the balance of inputs into the catchment. Several reports of annual performance by municipal WWTPs are available, with the most comprehensive and accessible being the ISVS. According to ISVS (2022), annual phosphorus discharges from WWTPs within the Hřensko profile catchment ranged between 450 and 540 tonnes per year in 2018, 2020, and 2022. Transport through the Hřensko profile showed considerably greater variability (due to differences in flow), ranging from 580 to 1,070 tonnes per year. Phosphorus removal efficiency in WWTPs was approximately 87 %, which, among other things, is the efficiency required by the new UWWTD directive [12] only by 2039. Overall, the proportion of phosphorus transport through the Hřensko profile in individual years corresponds to 50–77 % of the discharge reported by municipal WWTPs in the catchment. Only WWTPs serving more than 1,000 population equivalents were included in the calculation. However, from the perspective of the overall phosphorus balance, the reported WWTP discharges represent a significant underestimate, as they do not account for combined sewer overflows. Assuming that just 10 % of untreated wastewater enters recipients through overflows during the year, and given the current phosphorus removal efficiency of 85 %, the total load from WWTPs and sewer overflows would already exceed the reported discharges by more than 50 %. Combined sewer overflows are currently the subject of intensive research, so the estimates presented here will surely be refined in the near future. However, discharge data are only available for total phosphorus, not for phosphate phosphorus, which strongly correlates with chlorophyll-a concentration – the key indicator of phytoplankton biomass. The debate on how low phosphorus concentrations must be (and must be kept) continues and is likely to continue for some time. Nevertheless, the balance suggests that undesirable phytoplankton production can indeed be limited by significantly reducing phosphorus discharges from municipal sources. This reduction must involve not only improved removal technologies at WWTPs but also better functioning of sewer systems. This aligns with the gradually introduced requirements of the new European Urban Wastewater Treatment Directive (2024/3019 EU) [12].
As already mentioned, technically feasible methods for the systematic removal of pharmaceuticals (and other PPCPs) in municipal WWTPs are not yet available. Pharmaceuticals are a group of highly diverse organic compounds that, apart from nonspecific pollution, do not constitute a significant substrate (i.e. carbon source) for microbial communities in WWTPs, and therefore do not trigger the selection of specific metabolic pathways. Their degradation thus proceeds primarily through cometabolism with the standard sewage load, mediated by rather nonspecific bacterial oxidases, and occurs gradually, often producing unknown intermediate products or metabolites. Therefore, progress in this area is expected to be slow and must begin with support for systematic monitoring of pharmaceuticals in WWTPs and watercourses.
CONCLUSION
We have analysed archival data on water quality in the lower reaches of the Czech sections of the Elbe and Vltava rivers – border profile Hřensko and profiles Obříství and Zelčín at the confluence of the Elbe and Vltava.
Water quality in the lower Elbe has improved significantly and has remained stable since 1995–2020.
Ammonia nitrogen, after peaking in the 1980s, has almost disappeared; however, it has been replaced by persistently high concentrations of nitrate nitrogen, which is transported downstream to the ocean. The nitrogen balance in river systems is complicated by exchanges with the atmosphere, particularly through denitrification processes that produce nitrous oxide. At present, a substantial proportion of nitrate nitrogen originates from diffuse sources.
Phosphorus (determined as Ptotal) remains in excess in the rivers, with municipal WWTPs representing a major source; total phosphorus loads discharged within the catchment correspond to well over 50 % of transport measured at the gauging profiles. Eutrophication remains generally high, and the elevated primary production of phytoplankton in reservoirs and lower river reaches is influenced mainly by seasonal dynamics and the hydromorphology of the watercourses. As opposed to the past, the annual cycle of BOD-5 values at the monitored profiles is now significantly influenced by phytoplankton production. New pollutants such as pesticides and pharmaceuticals have also emerged. The input of pharmaceuticals occurs year-round, and the prospects for their complete removal at wastewater treatment plants remain limited.
It is necessary to take into account the impact of climate change on watercourses. In general, it leads to an increase in maximum summer water temperatures (resulting in higher respiratory activity and lower oxygen solubility), prolonged drought periods (with very low flows), and intense torrential rainfall events (which typically trigger sewer overflows). Current regulations governing wastewater discharges do not yet adequately reflect these conditions. Requirements for monitoring sewer overflows and for considering the “recipient characteristics” – specifically, the proportion of discharged wastewater in the river flow at the discharge point (monitored over five years) – are only now being introduced in the newly adopted UWWTD [12]. In the Czech Republic, there are nearly 1,000 municipal WWTPs (according to ISVS) serving more than 1,000 inhabitants, and at least 60 of them discharge more than 50 % of the recipient’s flow during dry weather conditions [16]. The working database (WWTP performance vs. flows at discharge points) is still being refined.
Since 2000, Czech legislation has failed to even meet the letter of Section 36 of the Water Act, which concerns the minimum residual flow and its determination. This provision underpins the requirements for the “environmental flow” included in the UWWTD and other European documents. If progress in pharmaceutical degradation is slow due to real technical challenges, could legislative progress be even slower?
Acknowledgements
Preparation of the text was possible thanks to projects supported by the Technology Agency of the Czech Republic, no. SS02030018 “Centre for Landscape and Biodiversity, WP C3 (DivLand)” and no. SS02030008 “Centre for Environmental Research, WP 2A” (CEVOOH). The possibility to calculate pharmaceutical transport, which has already been published in outline [14], is the result of collaboration with colleagues from the state enterprises Povodí Vltavy and Povodí Labe.
The Czech version of this article was peer-reviewed, the English version was translated from the Czech original by Environmental Translation Ltd.
