ABSTRACT
Monitoring of substances such as halogenated and other hazardous organic pollutants or heavy metals provides valuable information about environmental pollution. These persistent substances accumulate in both biotic and abiotic compartments, as well as in food chains, and many of them act as human carcinogens and endocrine disruptors. The Czech Hydrometeorological Institute’s annual monitoring results show long-term contamination of surface water ecosystem in the Czech Republic by these substances. Mercury contamination was documented practically in all evaluated samples with consistently elevated concentrations exceeding environmental quality standard (EQS) in adult fish. Perfluorooctane sulfonate (PFOS) was identified at above EQS concentrations in 50 % of monitored profiles in juvenile fish. Concentrations of dichlorodiphenyltrichloroethane (DDT) and polychlorinated biphenyls (PCB) show a slightly declining trend in some cases. For selected contaminants, their distribution in biotic (benthic organisms, fish, biofilm) and abiotic (sediments, sedimentable solids, suspended solids) matrices was evaluated. In addition, results from passive samplers and surface water were also included.
INTRODUCTION
Persistent substances arise as a result of various industrial and other anthropogenic activities. Some of them have been produced deliberately (pesticides, brominated flame retardants, polychlorinated biphenyls (PCBs), per- and polyfluoroalkyl substances (PFAS)), while others arise as unintended by-products (polycyclic aromatic hydrocarbons (PAHs), dioxin compounds). These substances may also be released from various consumer products, which serve as their source (flame retardants used in furniture, household appliances or textiles, nanomaterials, chemicals used to create non-stick surfaces, plasticisers, phthalates, etc.). From their point of origin, contaminants can be transported through the atmosphere and subsequently distributed globally into other environmental components. Important pathways for their entry into the environment is through wastewater, contaminated soils, and waste landfills [1]. The high chemical stability and lipophilic nature of these substances lead to their sorption onto solid particles, accumulation in organisms, and subsequent transfer through food chains. Due to their ability to be transported over long distances from the source of pollution, some persistent organic pollutants (POPs) tend to contaminate even remote ecosystems and negatively affect the health of organisms on a global scale. For example, in polar bears, they can disrupt hormonal processes [2].
In aquatic ecosystems, contaminants are distributed among different matrices. Depending on their physicochemical properties, some substances have a higher affinity for organic carbon and therefore primarily accumulate in sediments or suspended solids, while others tend to accumulate in the fatty tissues of organisms or bind to proteins – e.g., PFAS [3]. In water, most POPs are found only in minimal concentrations due to their very low solubility. For this reason, to assess the pollution status of an aquatic ecosystem by certain contaminants (such as mercury, phthalates, DDT, or PCBs), it is more appropriate to monitor solid matrices. Passive samplers also play a significant role here, as they concentrate dissolved substances directly from the water column, allowing their effective detection even at very low concentrations [4, 5].
In addition to well-characterised environmental contaminants (DDT, PCBs, PAHs), a number of relatively new, so-called emerging pollutants are also entering the environment, whose toxic effects have not yet been fully explored. This group includes a wide range of chemical substances, such as pharmaceuticals, personal care products, pesticides, and their metabolites. Many of these substances are characterised by high mobility in the environment due to their solubility in water, which can result in their presence even in drinking water [6]. It is also important to consider degradation products or synergistic interactions between different pollutants, which can induce toxic effects even at concentrations individually considered safe [7].
As part of the regular annual monitoring of solid matrices, the Czech Hydrometeorological Institute (CHMI) tracks the content of more than 90 substances that have the potential to accumulate in both biotic and abiotic components of aquatic ecosystems. The main aim of this article is a comprehensive assessment of water pollution by hazardous substances from various perspectives, focusing on differences between individual matrices, including long-term trends and the influence of specific profiles.
METHODOLOGY
A total of 43 profiles of the main rivers in the Czech Republic were selected for the assessment, where all monitored matrices are sampled in the long term (Fig. 1). In the case of biotic matrices, these profiles are divided into two sets, which alternate every three years. The list of monitored matrices, the number of samples per year, and the corresponding units are provided in Tab. 1.

Fig. 1. Map of monitored profiles
Tab. 1. Evaluated matrices
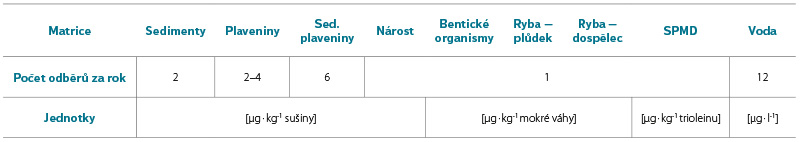
For benthic organism analyses, the main samples are leeches (Erpobdella spp.), caddisflies (Hydropsyche spp.), and amphipods (Gammarus spp.) For adult fish, the species is the common chub (Squalius cephalus). Semipermeable Membrane Device (SPMD) passive samplers, used for monitoring non-polar organic micropollutants, are filled with triolein fat and exposed to water for three weeks. Sedimentable solids are sampled for four to eight weeks, depending on the specific location, using sediment trap boxes, and the suspended solids are actively collected with a mobile centrifuge.
The substances selected for analysis of aquatic ecosystems contamination include: benzo(a)pyrene (B(a)P) and fluoranthene (FLU) as representatives of polycyclic aromatic hydrocarbons (PAHs), di(2-ethylhexyl) phthalate (DEHP), polybrominated diphenyl ethers (PBDEs), PCBs, DDT and its metabolites, perfluorooctane sulfonate (PFOS), and mercury (Hg). Of the selected contaminants, only PAHs are analysed in the biofilm. In the case of abiotic matrices, concentrations are not normalised to organic carbon content. Chemical analyses are conducted in external laboratories depending on the matrix and the group of substances monitored. For the determination of metals and PFAS in adult fish, muscle tissue samples were used, while other organic substances were analysed in muscle tissue with skin.
Boxplots were used to interpret the data, incorporating results from 2006–2023 depending on the type of matrix and the substance monitored. Selected substances have a limit concentration, known as the environmental quality standard (EQS) for biota, established by Government Regulation No. 401/2015 Coll., against which the measured concentrations are compared.
RESULTS AND DISCUSSION
Occurrence of selected contaminants in monitored matrices
The distribution of substances differs between the various biotic and abiotic matrices (Fig. 2). Specific differences in the distribution of contaminants across matrices reflect their differing physicochemical properties and interactions with the environment. Analytical method parameters, such as the limit of quantification (LOQ), may also play an important role.
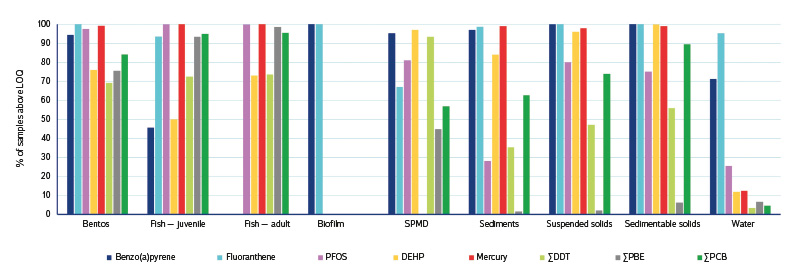
Fig. 2. Occurrence of selected substances above LOQ [%] in individual matrices for the period 2006–2023 (according to specific matrix and substance)
PAHs were found above the LOQ in 100 % of biofilm, suspended solids, and sedimentable solids samples. Currently, PAH analyses are not conducted in adult fish, as these substances can undergo significant metabolism within the fish organism [8]. This also partly affects the occurrence of PAHs in juvenile fish, where, for example, B(a)P was detected in less than half of the samples. PBDEs were found in more than 75 % of biota samples, in contrast to abiotic matrices and water, where they were rarely detected above the LOQ. PFOS was present in nearly 100 % of biota samples, with slightly lower occurrence in abiotic matrices, except for sediments, where – similarly to water – it was detected in only 25 % of samples. Mercury was detected in nearly 100 % of solid matrices, while in water it was recorded in only 10 % of cases.
Distribution of substances in solid matrices of surface waters
Benzo(a)pyrene (B(a)P) and fluoranthene were assessed as representatives of PAHs, with concentrations in biota ranging two to three orders of magnitude lower than in abiotic matrices (Fig. 3). An exception is biofilm, which, unlike most animals, lacks a metabolic transformation mechanism for PAHs, so their concentrations are comparable to those in abiotic matrices. However, biofilm may also contain a certain amount of inseparable abiotic fraction, which can influence the resulting concentrations. In juvenile fish, PAH concentrations are orders of magnitude lower than in benthos, which can be attributed not only to differences in metabolic capacity but also to the fact that benthic organisms are exposed to significantly higher PAH levels from sediments than fish. Although both benthic organisms and juvenile fish metabolise PAHs through similar mechanisms involving cytochrome P450 enzyme systems, this capacity is considerably limited in some benthic species [9]. However, the lower measured concentrations of parent PAHs in organisms may be due to their rapid transformation into potentially more toxic metabolites, whose concentrations can be higher compared to the original substances [9]. In abiotic matrices, the concentrations of B(a)P and FLU were comparable in magnitude, with FLU detected at higher concentrations in all matrices. This difference can be explained by the greater amount of FLU released during combustion processes and its higher environmental stability [10].
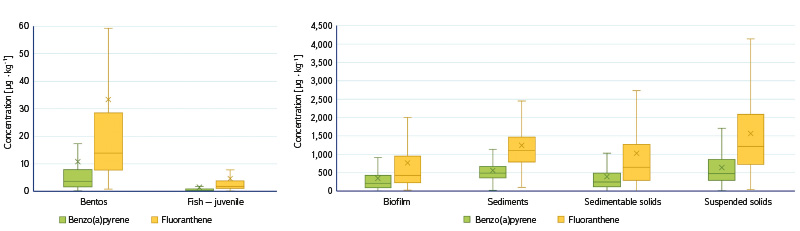
Fig. 3. Long-term concentration of selected PAHs: a) Biotic matrices without biofilm; b) Abiotic matrices, biofilm. Individual boxes include data from all monitored profiles for selected years (benthos: 2012–2023, others: 2006–2023). Medians (–), means (×), quartiles (box boundaries), and „maximum/minimum“ (line endpoints) are indicated, excluding outliers
Another substance evaluated was DEHP, which accumulates most in benthic organisms among the biota (Fig. 4). It is also the substance found in the highest amount in benthos of all the contaminants monitored. In abiotic matrices, DEHP concentrations are highest in suspended solids and lowest in sediments, directly proportional to the total organic carbon content. According to Huang et al. [11], a positive correlation was demonstrated between certain water parameters, such as chemical oxygen demand and ammonium nitrogen concentration, and DEHP concentration in sediments; however, no effect of water temperature was observed. In contrast to our results, the mentioned study measured higher DEHP concentrations in fish than in benthic organisms, although the fish were predatory species (the chub is omnivorous).
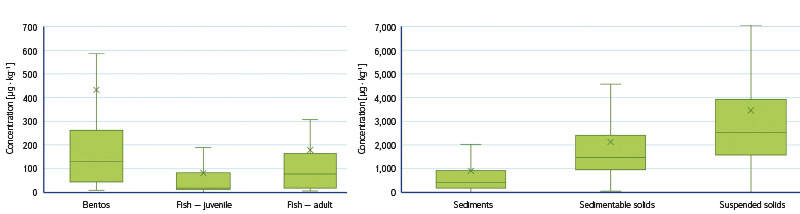
Fig. 4. Long-term concentration of DEHP: a) Biotic matrices; b) Abiotic matrices. Individual boxes include data from all monitored profiles for selected years (adult fish: 2012–2023, others: 2010–2023). Medians (–), means (×), quartiles (box boundaries), and „maximum/minimum“ (line endpoints) are indicated, excluding outliers
Mercury concentrations (Fig. 5) show a different distribution across matrices compared to DEHP. In fish, mercury occurs at significantly higher concentrations over the long term than in other biotic matrices. In adult fish, the majority (up to 95 %) of total mercury may be present in the form of neurotoxic methylmercury (MeHg), which primarily binds strongly to muscle tissue, where it accumulates in the long term. In contrast, inorganic mercury Hg(II) tends to accumulate in the digestive system and liver, from where it is more easily eliminated [12]. An important property of MeHg is biomagnification, where its concentration increases with the trophic level of the organism; therefore, MeHg accumulates at demonstrably lower concentrations in benthic organisms, which occupy a lower level in the food chain, compared to predatory fish species. Unlike in biota, most mercury in abiotic matrices is present in inorganic form (MeHg represents at most a few percent of total mercury [13]), which may explain the negative correlation with organic carbon content confirmed by our results.
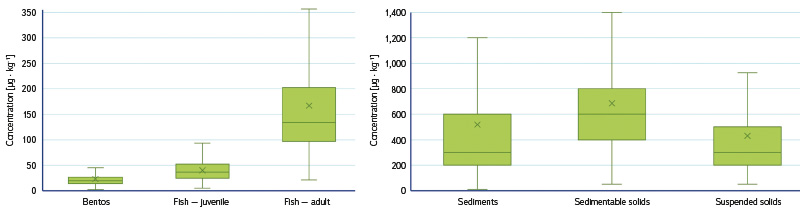
Fig. 5. Long-term concentration of mercury: a) Biotic matrices; b) Abiotic matrices. Individual boxes include data from all monitored profiles for selected years (2006–2023). Medians (–), means (×), quartiles (box boundaries), and „maximum/minimum“ (line endpoints) are indicated, excluding outliers
From a long-term perspective, concentrations of DDT, PCB, and PFOS occur in all matrices within a similar order of magnitude (Fig. 6). Slight differences were measured for PCB, which are found at the highest concentrations in sedimentable solids, and for DDT, where the highest accumulation was recorded in SPMD passive samplers. In SPMDs, concentrations are expressed only relative to fat content, which confirms the high affinity of DDT for lipids. The highest concentrations of PFOS in biotic matrices are regularly found in juvenile fish. This may be because, unlike the substances mentioned above, PFOS has an amphiphilic character and, besides fatty tissue and muscle, it is also present in high concentrations in blood, where it binds primarily to plasma proteins [3].
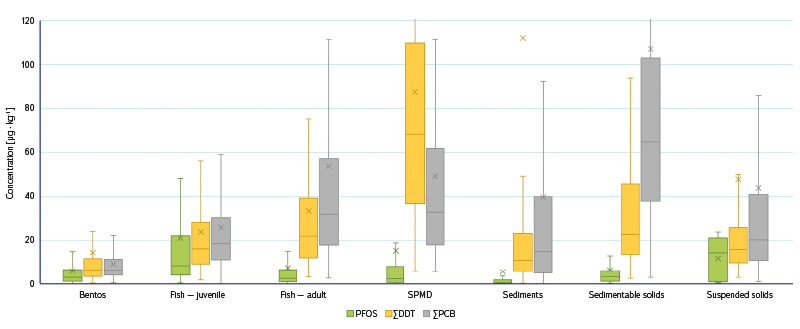
Fig. 6. Long-term concentration of selected POPs. Individual boxes include data from all monitored profiles for selected years (PCB, DDT: 2006–2023, PFOS biota: 2010–2023). Medians (–), means (×), quartiles (box boundaries), and „maximum/minimum“ (line endpoints) are indicated, excluding outliers
Contamination of individual profiles
In the long term, specific trends in the concentrations of hazardous substances are evident in the monitored profiles. The load on individual profiles is influenced not only by current industry but also by legacy environmental burdens, which include river sediments, where excavation can lead to remobilisation of contaminants. Tab. 2 summarises the profiles most heavily burdened over the long term by selected substances. PAHs were regularly found at elevated concentrations in profiles from the Moravian-Silesian Region, particularly in the area of the Ostrava-Karviná coal basin. DDT and PCB exhibited the highest concentrations in the downstream profiles of the Elbe, specifically in the Děčín area, which may indicate cumulative transport of these POPs from the upper parts of the basin. In the Ústí Region, in the profiles of the Bílina and Ohře rivers, PFOS was found in the highest concentrations. Compared to other locations, the highest concentrations of DDT were measured in the Bílina – Ústí nad Labem profile in samples of not only biota but also other matrices (Fig. 7).
Tab. 2. Profiles exhibiting maximal contamination by target substances in environmental matrices
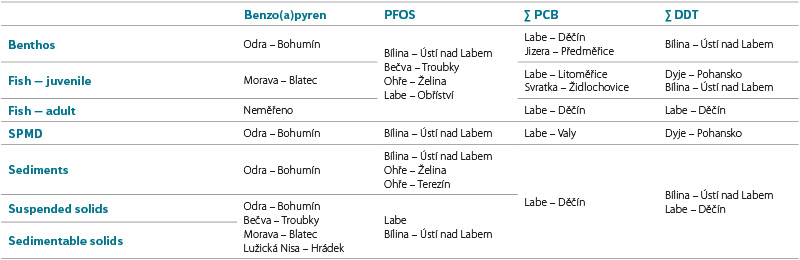
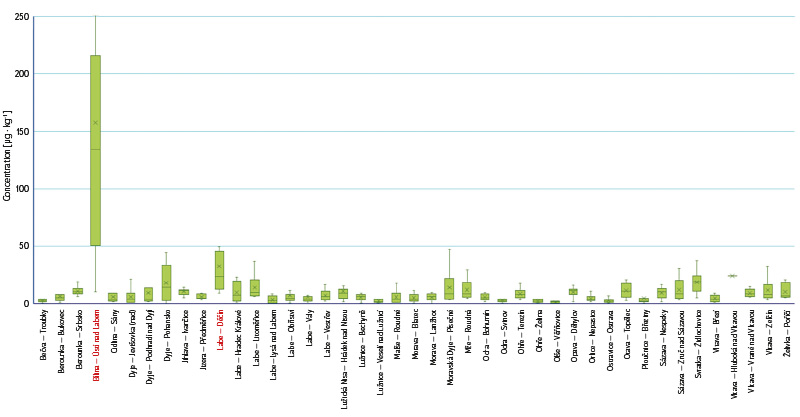
Fig. 7. DDT Concentrations in benthic organisms across monitored profiles for the period 2006–2023; profiles with the highest measured concentrations are marked in red
For a more detailed assessment, bioaccumulation of PFOS in juvenile fish was analysed, where concentrations regularly exceeded the EQS limit of 9.1 μg ∙ kg-1 (Fig. 8). Among the biotic matrices evaluated, the highest frequency of this value exceedance was recorded in juvenile fish samples, with more than 50 % of analysed samples exceeding the EQS. In contrast, exceedance of the EQS was recorded in only 20 % of benthic organism and adult fish samples during the monitored period.
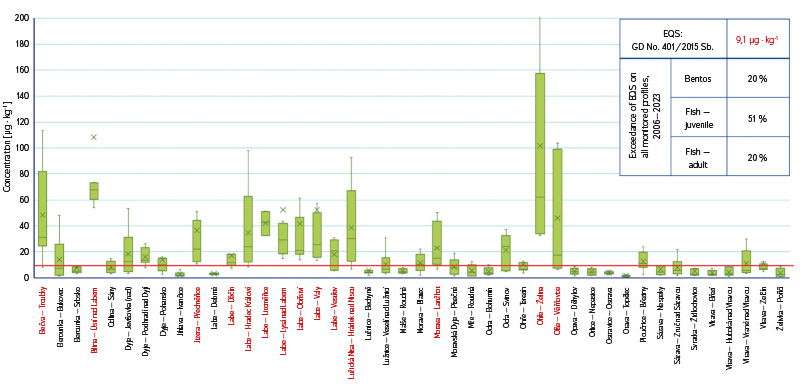
Fig. 8. PFOS concentrations in juvenile fish across monitored profiles for the period 2010–2023; profiles marked in red indicate locations where the Environmental Quality Standard (EQS) limit (red line) was exceeded in almost all samples (the table presents the percentage of profiles exceeding the EQS during the monitored period in biotic matrices)
An overview of mercury loads in fish at individual profiles, along with a comparison to the EQS value for all biotic matrices, is summarised in Fig. 9. The EQS for mercury, set at 20 μg ∙ kg-1, was exceeded in 100 % of adult fish samples. However, within the framework of the European assessment of surface waters in the Czech Republic (similarly to many other countries), due to non-standardised evaluation procedures, most profiles show good chemical status in terms of mercury contamination, although this status was calculated from mercury concentrations in water, not in fish. In contrast, in Sweden, which uses mercury concentrations obtained from biota to assess chemical status, all measured profiles indicate poor status, even though mercury concentrations in fish there may be lower than ours [14, 15].
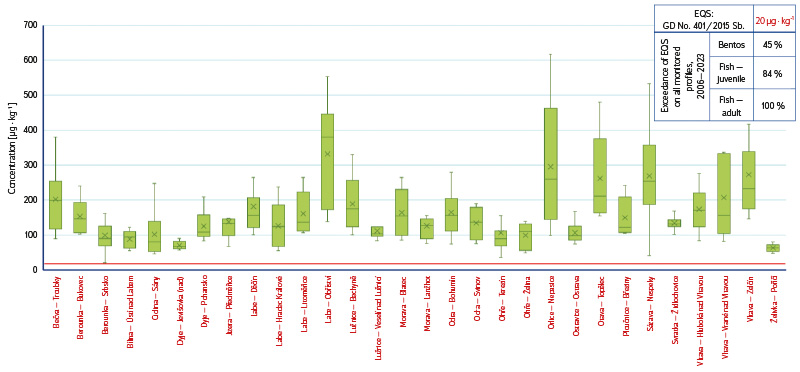
Fig. 9. Hg concentrations in adult fish across monitored profiles for the period 2006–2023; profiles marked in red indicate locations where the Environmental Quality Standard (EQS) limit (red line) was exceeded in almost all samples (the table presents the percentage of profiles exceeding the EQS during the monitored period in biotic matrices)
Long-term trend
The long-term development of concentrations was also assessed over the monitored period. Trends do not differ among individual representatives of biotic and abiotic matrices; however, a difference between these two groups was observed for certain substances. In some profiles, a decreasing trend was identified for biotic matrices only in the case of DDT and PBDE. Mercury concentrations in all matrices, as well as B(a)P in abiotic matrices, have remained broadly stable over the years. In contrast, B(a)P in biota and PFOS in abiotic matrices show a more fluctuating development of concentrations without any clear systematic pattern. For example, no decreasing trend has been observed in PFOS concentrations in juvenile fish, despite its inclusion in the Stockholm Convention in 2009, which significantly restricted its production [16] (Fig. 10). The historically highest concentration of PFOS (409 μg ∙ kg-1) was recorded in juvenile fish at the Bílina – Ústí nad Labem profile in 2016.
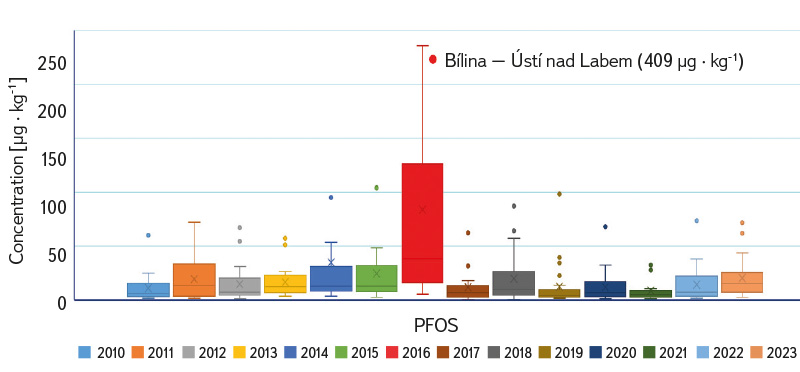
Fig. 10. Long-term trend of PFOS in juvenile fish with indicated maximum concentration
CONCLUSIONS
For a comprehensive assessment of aquatic ecosystem contamination, systematic monitoring of all matrices is necessary due to the uneven distribution of contaminants among them. Among the biotic matrices, the highest concentrations of mercury were measured in adult fish, with accumulation directly proportional to the trophic level within the food chain. In contrast, PAHs and DEHP were detected at the highest concentrations in benthic organisms, which are unable to metabolise these substances effectively. PFOS predominated in juvenile fish, where it accumulates significantly not only in fat and muscle tissue, but also in blood. In abiotic matrices, elevated concentrations of substances were detected in suspended solids (DEHP, PFOS) and in sedimentable solids (DDT, PCBs). In sediments, the concentrations of these POPs are lower, which may be related to the lower organic carbon content in this matrix.
The continuous development of analytical methods enables monitoring of an ever-wider range of xenobiotic substances which, combined with promising technologies for the elimination of toxic substances, green manufacturing processes, and ongoing updates to environmental legislation, can lead to the gradual minimisation of anthropogenic pollution. However, evaluating current results remains challenging because limits ensuring a good status of aquatic ecosystems are set for biota for only a limited number of substances, and not at all for abiotic solid matrices (despite the large number of measured indicators).
Acknowledgements
This article was created with the support of the project of the National Agency for Agricultural Research (NAZV) No. QL24010384 “Medium-term trend in the behaviour of micropollutants originating from wastewater or sludge from wastewater treatment plants in the soil environment” and as part of the Long-term Concept for the Development of a Research Organisation (DKRVO) of the Czech Hydrometeorological Institute (CHMI) for the period 2023–2027, funded by the Ministry of the Environment of the Czech Republic (MoE CR).
The Czech version of this article was peer-reviewed, the English version was translated from the Czech original by Environmental Translation Ltd.
