ABSTRACT
Eutrophication of watercourses and reservoirs, specifically the enormous phosphorus load on water, has been the biggest problem for water management in the Czech Republic for several decades. Budget models are effective support for rational solution; apart from resources, they must include the river network characterization, i.e. the retention of phosphorus in streams. A direct method for measuring phosphorus retention in watercourses under well-defined conditions, i.e. a method providing generalizable retention parameters, is fundamentally lacking and it could significantly increase the accuracy of the current models. It seems that TASCC method (Tracer Additions for Spiraling Curve Characterization) has such potential. In this article, we describe its first application in the Czech Republic, namely in the experimental basin of the Lhotsk stream (Beneov district). On October 10, 2021, we selected a 200 m long channelized section, into which we applied a mixture of NaCl and NH4H2PO4 solutions. Using conductivity probes, we monitored the advancing wave at a flow rate of 2.3 l/s. In total, 20 samples were analysed for chlorides and phosphorus, and helped us to characterize three parameters of the nutrient spiralling. According to TASCC method (Covino et al. [16]), we calculated the uptake length (SW amb = 70.8 [m]); areal uptake (Uamb = 0.000000178 [mg/m2.s]; and uptake velocity (vf amb = 0.00936 [mm/min]). The resulting values are suspiciously low compared to the literature and the causes of the deviations are considered in the article. One of the most probable circumstances is the vague definition of the “saturation concentration” that needs to be achieved with the dose. Undoubtedly the main advantages of TASCC method are simplicity, safety, and environmental friendliness. The aim of the paper is to evaluate the applicability of the promising TASCC method for water management in the Czech Republic.
INTRODUCTION
The eutrophication of aquatic ecosystems (i.e. rivers, lakes and seas) is still one of the most serious means of degradation; moreover, its intensity continues to deepen, both around the world and in the Czech Republic. We can use various examples to support this statement, whether it is the increasing extent of dead zones in the seas [1], including those where our rivers flow [2], the most comprehensive report on the state of water bodies for the whole country, or the most serious examples of ecological disasters in Dyje [3] below Nové Mlny (41.6 tons of fish of 26 species from 10 to 250 cm died in the summer of 2022 due to the “export” of decades of unresolved eutrophication of the reservoir) or on the Oder [4] in Poland and Germany (officially 360 tons of fish, while expert estimates speak of 1,650 tons, not including millions of bivalves and gastropods; A. Szlauer-Lukaszewska, pers. comm.).
From the limnology point of view, the situation has been quite clear for more than half a century [5]. Despite the long-term warnings of expert authorities [6] and recent warnings of legal authorities [7], the so-called “top” officials and the so-called “responsible” agents of interest organizations have managed to eliminate effective efforts to limit the entry of phosphorus into waters. Unfortunately, the elimination of phosphorus itself from wastewater still does not take place to the desired extent, so this key biogenic element from the point of view of the evolution of life on the planet accumulates more and more in the sediments and, through mass blooms of cyanobacteria and algae, causes significant long-term damage to water reservoirs, bathing waters, and breeding ponds.
In a rationally functioning society, the basin budget model would constitute, in addition to general laws whose basic feature is enforceability, an optimal professional tool used by water management to achieve statutory goals. Such a model should compile a prioritized list of point resources requesting investment in such order and amount that costs are spent efficiently. And, of course, any model is only as good as its input data.
After many years of sampling representative sets and systematic surveys of entire basins, when, for reasons of efficiency, we concentrated on the most accurate measurement of the resources themselves (i.e. the inputs to the budget models), we gradually reached a stage where the biggest weakness of these models are the processes, namely retention. By the general term retention, we mean the sum of physical, chemical and biological processes, which are naturally different for stagnant and flowing water. And it is understandable that individual events experienced different depths of knowledge. While the retention of phosphorus in reservoirs is robustly generalized thanks to the many decades of efforts by limnologists [8], the retention of phosphorus in streams, however significant it may be (Fig. 1), is due to little knowledge of systematic values often only arbitrarily calculated, or in better cases parameterized only very homogeneously for large areas or hydrological extent.
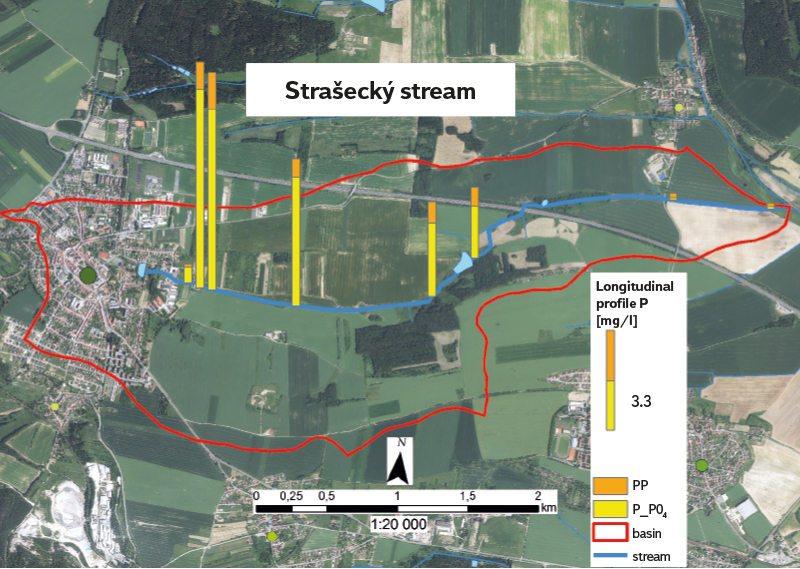
Fig. 1. An example of a significant change in phosphorus concentrations in the longitudinal profile downstream from Nové Straecí (5,500 inhab.) on November 10, 2015, when 95 % of the flow in the Straeck stream (5.0 km) consisted of WWTP discharge. Total phosphorus concentration decreased slightly from 7.4 mg/l in the WWTP outlet to 3.1 mg/l and 2.3 mg/l above and below Konopas pond, respectively, which was drained completely at the time. In the lower part of the stream, retention was significant and the concentration dropped to 0.210 mg/l at the confluence with Lodnice river. Particulate phosphorus (PP) is the difference between total and dissolved reactive phosphorus (PO4-P)
At the same time, it is true that the cycle of phosphorus in lake and reservoir ecosystems has been studied since the beginning of limnology with regard to the then prevailing sources, i.e. “ensuring” chronic supply. On the other hand, the impact of phosphorus from occasional, albeit significant episodes without distinction (if it is an episode of erosion or sewer overflow during the rains) is much less studied, or quantification of episodes is much more difficult [9], let alone generalization. In river ecosystems, the dichotomy is similar, but the total amount of directly measured data is incomparably smaller. It can therefore be summarized at the outset that the weakest point of our budget models is currently the directly measured retention of phosphorus in streams, and episodic retention has received the least attention.
Since phosphorus (due to the absence of a gaseous state) is not “lost” anywhere in the river network, nor does it accumulate in the long term (unfortunately, from a functional point of view, we separated the floodplain meadows from the rivers); on the other hand, to start with, it is not a big mistake if its retention is “annulled” in the long run. However, we must not forget this assumption at the moment when in the model we confront, for example, annual data from operational monitoring with real relationships from the basin, or by in-situ measured concentrations. While sampling usually covers the proverbial 12 seconds per year and we hope for their problem-free extrapolation to 365 days, in the interim there are apparently multiple to orders of magnitude changes in temporal retention [10]. And while in stream models there is usually nothing real to remind us of this error in assumption, in backwaters (where significant phosphorus accumulation from such episodes eventually occurs) it is the cyanobacterial blooms that give clear feedback to our theoretical models. After all, the results of each model must be properly interpreted, which cannot be done other than through a responsible author who knows the real environment.
The above-mentioned state of knowledge of phosphorus retention in aquatic ecosystems is given, among other things, by historically available methods. Methods based on radionuclide tracers are very limited outside the laboratory due to health risks. The differential measurement of concentrations “at the beginning” and “at the end” of the examined part of the ecosystem therefore have dominated the methods for a long time. Only the formulation and development of the “River Continuum Concept “ [11] and the “Nutrient Spiralling concept” [12] derived from it enabled the development of new methods based on observing the induced response of the entire ecosystem. At the beginning, radionuclides were still used [13], but before long, more sensitive procedures using non-conservative markers in addition to simple nutrients were developed. Regardless of the chemical nature of the substances, however, the first wave of new methods consisted of reaching plateau values, steady-state equilibrium, in the monitored section, and that for a non-negligible long time. Such an experiment provided only one unique value for a given section. A comparison of the results from different locations revealed a large range of the three determined spiraling metrics: uptake length (SW), areal uptake (U), and uptake velocity (vf). Therefore, a methodological refinement followed; during one measurement, the plateau concentration was gradually increased in several consecutive steps [14]. From this differentiated series of measurements, the parameters of the nutrient spiraling were extrapolated towards unaffected conditions with much higher accuracy. However, with such a procedure, the examined river section was exposed to such a high load in total that some authors doubted the reliability of the data obtained in this way for common ranges of background measurements [15].
In methodology, the latest innovation is thus TASCC method (Tracer Additions for Spiraling Curve Characterization) [16], where the response on a known section of the watercourse is induced only by a one-time addition (slug injection) of a mixture of enriching nutrients and a conservative marker. Unlike the previous methods, each sub-sample taken from the resulting wave is used to calculate one particular value, i.e. the derivation of three spiraling metrics (SW, U a vf); it does not only take place by interpolating two or three points (corresponding to two or three steady-state concentrations), but by calculating a regression line over a large set of points. Such a procedure not only leads to higher statistical reliability, but mainly to higher factual accuracy of the calculated spiraling parameters characterizing nutrient retention (in our case phosphorus retention).
In their work [16], Covino et al. consistently distinguish three groups of spiraling metrics, or three sub-levels of nutrient uptake (U), which are gradually calculated and derived using the given procedure (SW a vf): ambient uptake (Uamb) is the desired target quantity characterizing the river’s own spiral in unaffected conditions, towards which all methods should aim; added nutrient uptake (Uadd) is an artificially increased part of the uptake caused by the experimental addition of nutrients, i.e. an increase in uptake due to the induction itself; and finally, total uptake (Utot) is the sum of both mentioned sub-components and the only value directly obtained by chemical analysis of samples taken. Unlike total uptake, the two partial values can only be derived mathematically.
Like any method, TASCC has its limitations; however, the main advantages include health safety (compared to isotopes) and significantly less burden on the studied ecosystem (compared to steady-state methods). Most of the few works in which it has been used so far [17–26] deal with nitrogen retention but show its applicability both on a wider range of watercourse sizes and on a larger geographical distribution.
In the Czech Republic, TASCC method has not yet been used, despite the fact that it offers considerable potential in refining budget models. The goal of our study is, therefore, the implementation of the method and assessment of its suitability for direct measurement of phosphorus retention in watercourses depending on predictable parameters. In the ideal case, we hope that the method will help us to achieve a good ecological status more effectively, or economically suppress the manifestations of eutrophication in our degraded water ecosystems through more reliable modelling of processes (i.e. retention in the hydrographic network).
METHODS AND LOCATION
The Lhotsk stream (second order according to Strahler), originating 8 km east of Beneov, is a right-hand tributary of the Petroupimsk stream, whose waters flow through the Beneovsk stream near erany into the Sázava river. The highest point of the catchment (2.6 km2) is Kochánov hill (499 m above sea level), while the mouth (360 m above sea level) is only 1.46 km away. The predominant soil type is modal cambisol on a bedrock of heavily weathered granites. The catchment (Fig. 2) is dominated by arable land (82 %), with the minority occupied by forest (8 %) and permanent grassland (4 %). Due to the steepness of the land, the skeletal nature of the soils, ploughing, systematic drainage (29 %), and farming methods, the basin is regularly and long-term affected by severe erosion. The Lhotsk stream (2.2 km) flows completely outside human settlements; therefore, the transported phosphorus (P) comes exclusively from non-point sources, and agricultural land has the decisive share of the P transfer.
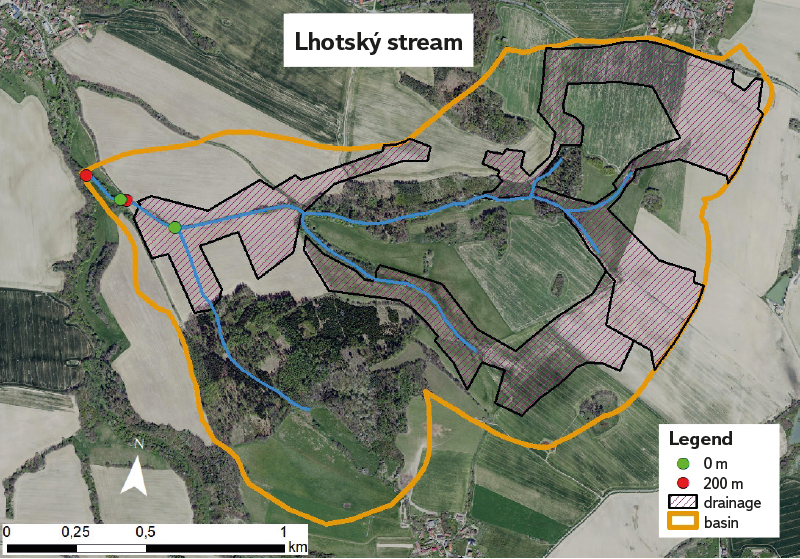
Fig. 2. Map of Lhotsk stream showing both studied sections (200 m), where phosphorus retention was also measured by TASCC method (upper straightened section “canal”), or only arrival time and morphology of the riverbed (lower natural section “meanders”)
In the closing part of the basin (GPS 49° 48’13.192’’N; 14° 45’38.902’’E), the stream flows through two morphologically different sections, which we used for research. In the upper section (hereafter called the canal), the stream is completely straightened, deepened with a bottom paved with solid concrete tiles. Apart from a solitary group of willow bushes, the steep banks are only covered with herbaceous ruderal vegetation (5–15 m), strongly overgrown with reeds at the lower end. On the other hand, in the lower section (hereafter called meanders) the stream meanders through an almost natural bed in a wider floodplain and is lined on both banks by a continuous strip of densely stratified tree and shrub vegetation (10–20 m). The riverbed is made up of different material, from boulders to coarse sand, depending on the prevailing velocities of the current. In both morphologically different parts of the riverbed, we defined two 200 m long experimental sections, which are separated only by a road culvert and about 20 m apart. Although we only used the channelized section for the initial measurement of P retention using TASCC method, we also monitored the same wave of water enriched with tracer mixture on the natural section of the meanders, albeit only through conductivity electrodes. From the measured conductivity curves, we derived the advance velocities on both sections. For the future comparison of the retention of two different types of bed, we therefore assume that the two sections do not differ either hydrologically or hydro-chemically, and the most significant difference in the investigated retention will be due to morphological differences.
Based on the long-term monitoring of this site and for future comparison of the two sections, it is worth noting that, unlike the channelized section, the unpaved bed of the natural section is intensively reshaped cyclically by abundant episodes of high flows. During longer hydrological calm periods, fine sediments also settle in the riverbed, which, if accumulating for a longer period of time, form loamy to clayey benches. Due to the abundant supply of leaf litter and fallen branches that get caught in meanders and on boulders, a characteristic layer of sapropel is formed, gradually covered with a fine biofilm, in numerous stream pools on the surface of fine sediments. These structures are washed away with flush run-off, together with benthos. In contrast, due to high sun exposure, the thin biofilm in the upper section is formed by a characteristically solid coating of epilithic algae which, in addition to hydrological changes (scouring), is also subject to seasonal dynamics. As a result, in the meandering part of the stream there is usually a much larger area of active surfaces where retention can take place (both biological and physico-chemical).
For the initial measurement of phosphorus retention according to TASCC method [16], we added a mixture of a conservative component (NaCl), which serves as a marker easily detectable by a conductivity electrode, and a non-conservative component (NH4H2PO4), whose retention is the subject of research, to the channelized section of the Lhotsk stream. According to the method, we chose the amount of added phosphorus so that the maximum concentration at the end of the measured section reached the recommended “saturation” level. The saturation concentration is formally derived from enzymatic kinetics according to Michaelis-Menten, and therefore corresponds to the concentration at which the given reaction rate reaches its maximum. However, during the practical calculation of spiraling metrics in an anthropogenically unaffected and slightly affected watercourse, it is indicated that the dynamic concentration must be increased two to five times, at most ten times above the background concentration level [16, 19, 26]. To calculate it, it was necessary to measure the background value of the P concentration, determined as the concentration of dissolved orthophosphates (PO4-P), and the flow rate (Q), but also the arrival time, i.e. the hydromorphological character of the watercourse. Since the last two characteristics essentially determine the course of the “flattening” of the concentration curve and depend mainly on the relative volume of the so-called dead zones (almost stagnant water in deep pools and hyporheal), which can be difficult to determine without prior measurement, we initially only roughly estimated both parameters.
In the autumn (October 21, 2021) we carried out an experimental measurement of phosphorus retention using TASCC method in the Lhotsk stream. In the 200 m long section, marked “canal”, water flowed only over the surface of the concrete tiles (average width of the surface 74.8 cm); therefore, phosphorus retention was almost entirely caused by sorption to this minimal area and, to a limited extent, also by uptake of nutrients by a small amount of attached organisms. The only deviation from the uniform shape of the riverbed was one larger and two smaller bank scours with a total length of about 15 m, where the riverbed left the canal.
We placed three conductivity probes (HACH HQ 40d or WTW Multi 3320) on the measured section of the stream, enabling automatic data storage. The first was below the point of thorough mixing (0 m), the second in the middle of the section (100 m), and the third in the section closing profile (200 m). Using online conductivity measurements on the closing profile, we took a sequence of samples (wide-mouthed HDPE sample containers 0.5 l) covering the ascending and descending part of the conductivity wave, or the passage of changing concentrations and ratios of monitored nutrients and tracer. We arbitrarily changed the time interval between individual samples according to the rate of the changing conductivity; as a result, it ranged from 5 minutes to 30 seconds. We stopped sampling after the induced conductance had stabilized to the background value.
Samples for the analysis of nutrients and chlorides (PO4-P, NH4-N, Cl-) and for basic chemical analysis (carried out within 24 hours in the accredited TGM WRI laboratory) were cooled with ice during transport. From the measured values, i.e. changes in the ratio of phosphorus and chloride loss, or biologically active nutrient to conservative tracer, all three spiraling metrics were calculated in several mathematical steps (see equations 8–10 in Covino et al. 2010) according to TASCC method [16]. According to “Nutrient Spiralling Concept” [13], these are uptake length (SW) [m], areal uptake (U) [g.m-2.s-1], and uptake velocity (vf) [m.s–1].
The uptake length (SW) is a basic parameter indicating the theoretical distance for which the average nutrient atom is transported by the watercourse between two points of the bottom from the output (or release from the bottom) to its uptake (or binding to the bottom). Since the SW is strongly influenced by the flow rate and velocity, or the water depth in the stream, outside of the retention process itself, it is appropriate (especially for the purpose of comparing different watercourses with each other or for comparing individual measurements carried out in the same watercourse, but under different hydrological conditions) to introduce a normalized quantity that converts these differences into a unit dimension. These quantities are areal uptake (U) and uptake velocity (vf). While the areal uptake (U) indicates the total amount of nutrient received per unit time per unit area of a riverbed, the uptake velocity (vf) corrects the uptake length to flow velocity and water depth (for details, see equations 8.6–8.10; interpretation and graphic manual in the methodological instructions [12]), thereby enabling mutual comparability of locations and periods of P retention measurement.
To calculate individual parameters of the spiral, we also measured the morphology of the flooded part of the canal (Fig. 3), i.e. the surface width (cross section every 10 m) and depth (every 10 cm on the given cross section) and calculated the wetted perimeter. All three parameters of the spiral, the so-called metric triad (see [12]) are mutually mathematically convertible quantities, and are thus in fact closely linked with each other. We derived the flow rate (the only quantity that unambiguously and reliably compares morphology of the channelized and natural stream section under current hydrological conditions) from the arrival time, i.e. from the interval between the maximum conductivity on the first (0 m) and the last profile (200 m). The flow rate (Q) was measured by the direct method on the gauging weir according to Cipoletti, ex post installed in the culvert, i.e. between the two sections. We consider the differences on the upper and lower edges of the examined section to be marginal. We measured Q only after the wave had passed, so that the hydraulic shock caused by the installation of the weir would not change the retention “capacities”, i.e. the mechanical rearrangement of leaves, branches, and sediments.
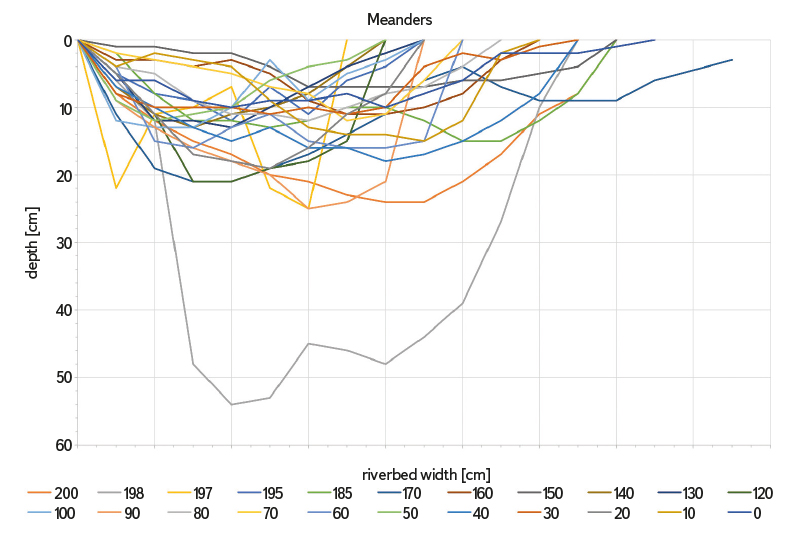
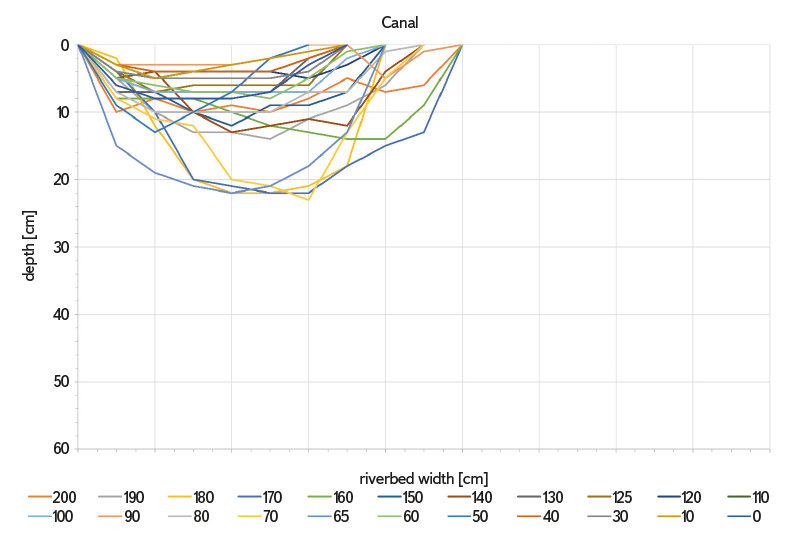
Fig. 3. Morphological differences of riverbed in the channelized (upper panel) and natural (lower panel) stretch of the Lhotsk stream; the horizontal profile of the water depth and width was measured every 10 m from the beginning (0 m) to the end (200 m) of the studied section, more often in the case of significant changes
RESULTS AND DISCUSSION
To measure the spiraling metrics, we used a mixture of NaCl solutions (conductivity = 25.0 mS/cm, 4 l) and NH4H2PO4 (PO4-P = 152 mg/l, 4 l). We poured the entire volume of the tracer solutions within five seconds onto a gravel chute just above the measured section to ensure thorough mixing while not stirring the sediment. We determined the loading according to the concentrations of NH4-N and PO4-P in the reference sample (0.019 and 0.024 mg/l) and the flow rate (2.4 l/s) determined the day before. Just before measurement, we took three control samples, namely at the beginning and end of the straightened section and at the end of the meander section. For the calculations of spiraling metrics, a sample from the upper edge of the experimental section (0.010 and 0.041 mg/l) was used as the background value of NH4-N and PO4-P; this is because the middle sample was contaminated by disturbed creatures moving in the riverbed. The phosphorus concentration of the sample taken in the third, lowest profile differed from the first by up to 5 %. From the values found during the wave passage (Fig. 4), it is clear that during the experiment there was an optimal increase in concentrations by the required two to five times stated in the literature [16, 19, 26].
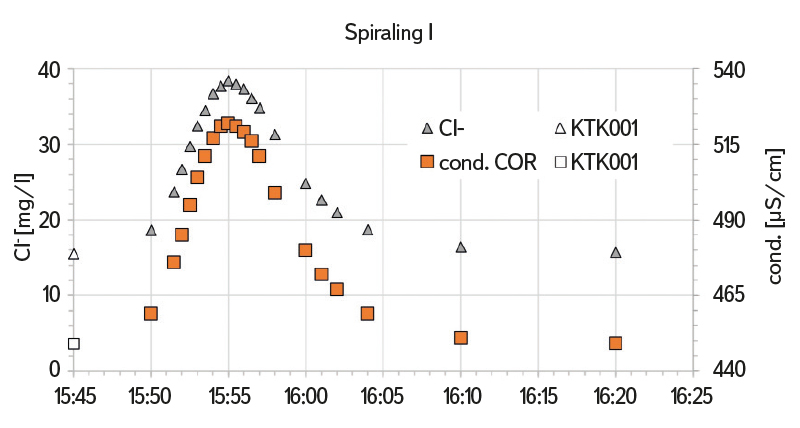
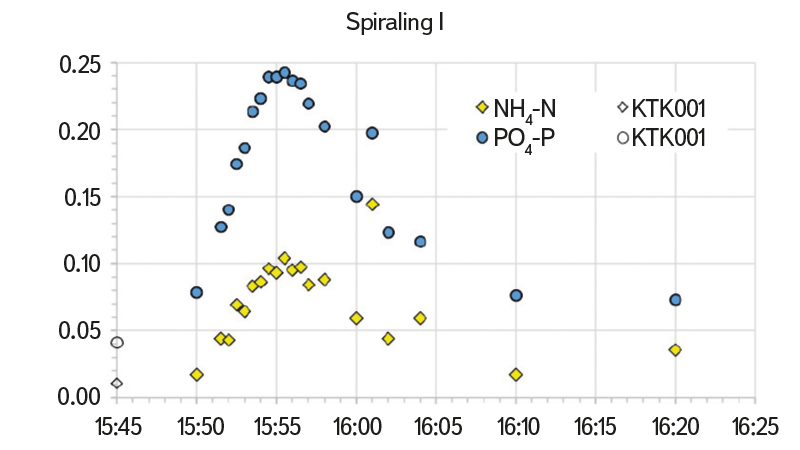
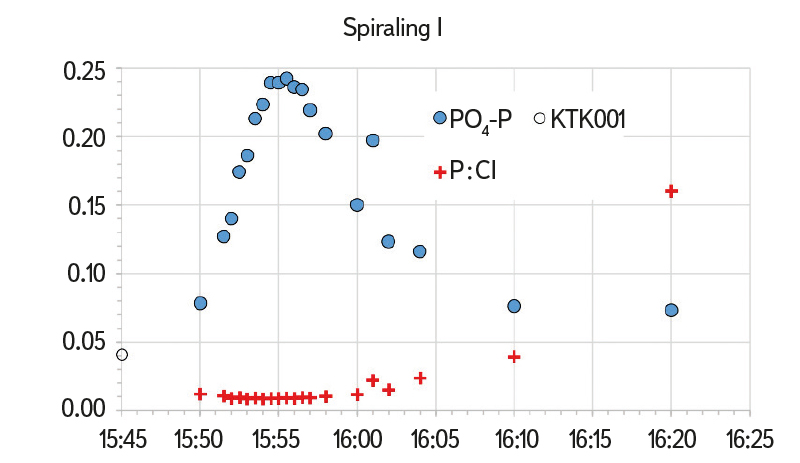
Fig. 4. Concentration of substances and conductivity on the closing profile of the straightened section (200 m) recorded in the passing wave (pouring of the mixture at 15:20) and compared to background values (KTK001)
At the current flow rate (2.3 l/s) and at a logging interval of 10–30 s, a flow velocity of 5.76 m/min (0.096 m/s) was measured. The resulting very fast wave passage (35 min from pouring, or from the wave passage through the 0 m profile to the collection of the last sample on the 200 m profile), we captured a total of 20 samples with the shortest interval of 30 s around maximum conductivity (Fig. 4). By synchronous measurement of conductivity in the lower section marked “meanders”, we found a significantly lower flow velocity (3.60 m/min) given by the natural character of the riverbed and proving the preliminarily decisive influence of the watercourse hydromorphological status (Fig. 3) on the retention of P in the stream; this is because differences in the slope of the riverbed are minimal.
By integrating the concentration curve using the trapezoidal method, we found that the wave passage in the straightened section (200 m) resulted in retention of 353 mg of added phosphorus (38.8 %) and only 3.0 % of added chlorides. Subsequently, the total areal uptake is U = 0.714 [mg/m2.s], whereby at the geometric mean of the background-corrected concentration (0.114 mg/l) we obtain the total uptake velocity vf = 0.376 [mm/min]. Using the original methodology [16], by extrapolation for ambient condition we obtain the following spiraling metrics values: SW amb = 70.8 [m]; Uamb = 0.000000178 [mg/m2.s] and vf amb = 0.00936 [mm/min], which are very low and practically zero for the last two quantities.
If we consider the coefficients of variance of the three calculated spiraling metrics (R2 for SW = 0.92, for U = 0.97, and for vf = 0.13), it is also clear that the dependence of total absorption rate on concentration is insignificant while, in contrast, it is very high for the uptake length and the total areal uptake (Fig. 5). Although we did not observe any changes in flowing water during measurement (neither turbidity nor a change in the level), we were convinced by a random error of the extreme sensitivity of the correlation of partial uptake lengths (SW) to the phosphorus concentration, or to small inaccuracies caused by sampling. When a sub-sample was taken at 4:01 p.m., fine sediment was probably stirred up because the measured concentrations deviate significantly from the otherwise smooth course. By subsequently omitting this outlier, the correlation coefficient improved dramatically (from the original value of R2 = 0.73 to R2 = 0.92).
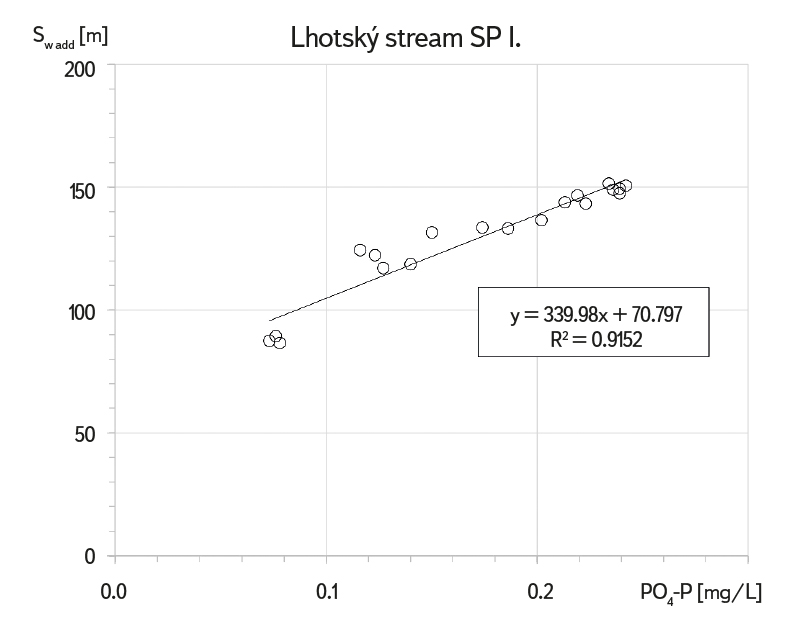
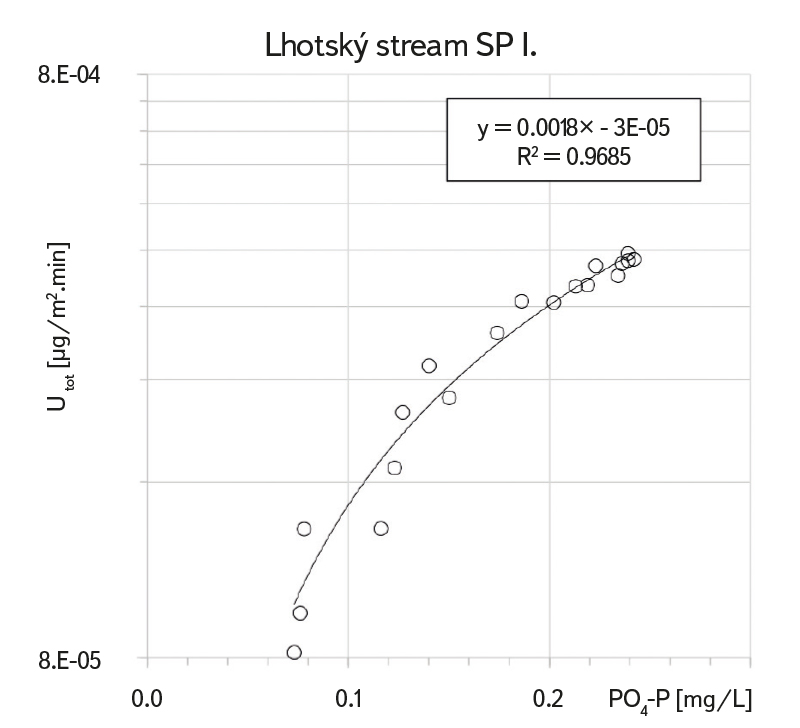
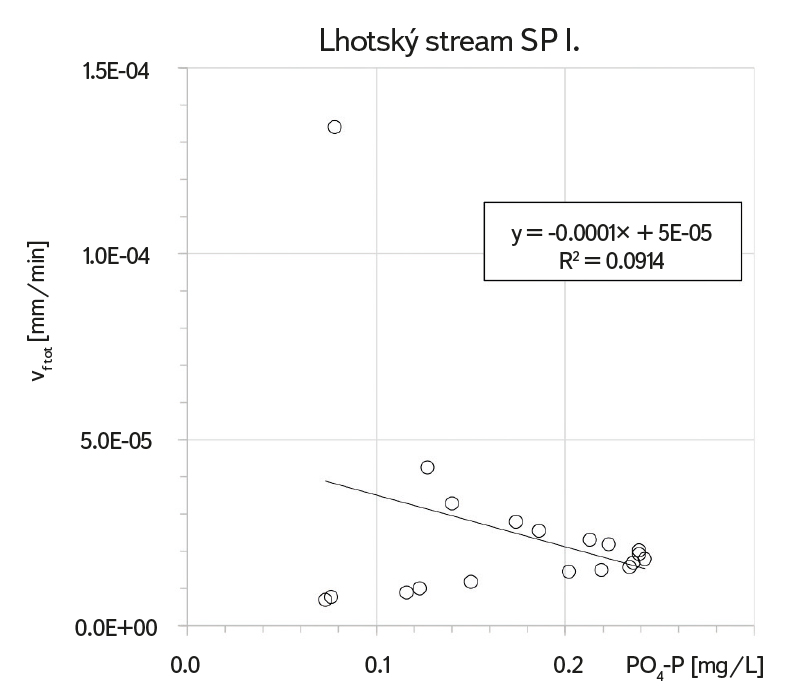
Fig. 5. Dynamic uptake length (SW -add), total areal uptake (Utot), and total uptake velocity (vf-tot) of phosphorus values obtained by TASCC method in the channelized stretch of Lhotsk stream
A comparison with other works also shows that the most robust value – uptake length – is at the lower limit of observations at lightly polluted locations [26]; in other words, it is very short. Since the uptake length value (SW) is strongly dependent on the actual flow (or current velocity and depth), the normalized values of areal uptake (U) and total uptake velocity (vf) are used to compare the sites. However, the authors (who, as in our case, were faced with their atypical courses or values) make the fundamental assumption to explain the discrepancies, that the whole theory behind the calculation of the spiraling metrics is valid only in the range of conditions under saturation [25, 27], i.e. the addition of nutrients must significantly induce its uptake. In our case, this would mean (providing that we want to avoid the application of extreme doses) that the background values are too high in themselves. Such a claim, however, logically contradicts the detected short SW. Therefore, in our opinion, another explanation is also possible, namely that the limited surface of the artificially channelized stream no longer has any additional capacity for P retention, and therefore the induction is not accompanied by the expected increase in retention. The last speculative cause of atypical values may be the apparent discrepancy in the ratio between phosphorus and chlorides in the so-called tailing of the concentration wave (Fig. 4 below), when the ratio P : Cl at the times of the last two samples (16:10 and 16:20) significantly increases. This increase apparently corresponds to a much slower stabilization of phosphorus concentration compared to the rapid return of chloride concentrations to background values. We call this possibility speculative because we have not yet gained enough experience with TASCC method to consider it reliably adopted.
Measurement of P retention by TASCC method only simulates conditions of balanced and low flow, which in our case is a range of up to about 10 l/s. Therefore, its results do not say anything about mutual relations at high flow rates or extreme loads. During torrents, one can theoretically consider a negligible proportion of the adhesion of erosion particles in the biofilm. However, this will be very limited by the spatially thin biofilm because the section is not saturated with nutrients from municipal pollution, and also by the short duration of the peaks. Moreover, scouring of the biofilm rather than its growth is likely to occur during these short episodes. A much higher retention capacity can be assumed in the lower, natural section of the Lhotsk stream. Not only longer contact time between flowing water and the bed, but mainly the more developed hyporheal will probably multiply the resulting retention. We therefore believe that only further measurements comparing both sections and carried out in different seasons will provide a more comprehensive picture of the of the spiralling metrics, i.e. the phosphorus retention in an exclusively agricultural stream.
CONCLUSIONS
We consider made-up ground of the applied dose to be a critical feature of the not very widespread TASCC method; without prior measurement it is difficult to estimate the desired saturation concentration. On the other hand, even a simple inorganic salt in a small amount is pollution, and this results in the size and number limit of the measured flows. In any case, compared to methods using radionuclides, TASCC method is completely safe and, unlike methods using concentration plateaus, the total consumption of chemical substances is fractional (although it is definitely not negligible if the method is eventually expanded). Simplicity, safety, and environment friendliness are therefore the main advantages of this method. Only after resolving the ambiguities of the increase in the made-up ground can we proceed to comparison of sections in different hydromorphological conditions, and it will be possible to definitively expand its wider application in the conditions of the Czech Republic. We believe that TASCC method will bring a more precise and, above all, directly measured characterization of phosphorus retention in streams for the entire country, starting with average conditions, or balanced flows. Retention values determined in this way can significantly refine our budget models and therefore increase their credibility when discussing corrective measures.
Acknowledgements
This article was written with the financial support of the Technological Agency of the Czech Republic project SS02030027 “Water systems and water management in the Czech Republic under conditions of climate change”. We would like to thank Ing. Ondej Taufer for valuable advice in the interpretation of the results of chemical analyses and processing of the mathematical apparatus. We also thank the staff of our laboratories led by Ing. Lenka Smetanová for their personal commitment, as well as two anonymous reviewers who made a significant contribution to the quality and clarity of the article with their critical comments.
The Czech version of this article was peer-reviewed, the English version was translated from the Czech original by Environmental Translation Ltd.
