Abstract
Evaporation from water surface significantly affects the overall hydrological balance of a river basin. Direct measurement of evaporation is complicated and not as common as the measurement of other quantities (e.g. precipitation or air temperature). Therefore, evaporation is often determined using formulas requiring available meteorological quantities as input data.
This paper describes data from floating and tank evaporimeters operated by TGM WRI. Measured values of evaporation and meteorological quantities are compared among the individual sites. Additionally, the derived formulas for the calculation of evaporation from the Hlasivo evaporimeter station and their application to selected sites are provided. The evaluation of the formulas is performed based on the lowest value of the mean relative error (MRE).
The results indicate that the formulas derived from the Hlasivo station are suitable for the calculation of evaporation on the other sites as well. The calculated evaporation corresponds to the measured daily course of evaporation. However, to calculate the evaporation with a lower calculation error, it is suitable to use the average monthly data and calculate the evaporation over a longer period.
Introduction
Evaporation from the water surface is an important member of the hydrological balance of water reservoirs, especially in times of drought. In recent years, the importance of evaporation has been exacerbated by the effects of climate change, in particular by the increasing average air temperature resulting in an increase in regional evaporation, including evaporation from water bodies. However, the increased loss of water by evaporation is not compensated by precipitation. In addition, no significant changes in average annual precipitation totals are expected in the long run [1].
Direct monitoring of evaporation from water surface is not common and evaporimeter stations are difficult to maintain and operate. Therefore, evaporation is often determined from mathematical formulas into which other measurable quantities are entered [2]. The dependence of evaporation on meteorological quantities has been described by many authors [3–5]. However, formulas for the calculation of evaporation often contain input quantities that are not normally measured at basic meteorological stations and must be further derived, such as saturated water vapor pressure or latent heat flow [6, 7]. For this purpose, new formulas for the calculation of evaporation have been derived at the TGM Water Research Institute including quantities that are commonly measurable at meteorological stations (e.g. air temperature, relative humidity, wind speed, etc.) [8]. These formulas were further refined in the research of TGM WRI [9].
The TGM Water Research Institute is in administration of two floating evaporimeters with weather stations. One is located on the Zaječice retention reservoir near Jirkov and the other on the Vavřinecký pond in the Central Bohemian Region. Furthermore, TGM WRI is the operator of two evaporimeter stations, in Hlasivo near Tábor and in Prague in Podbaba (Fig. 1).
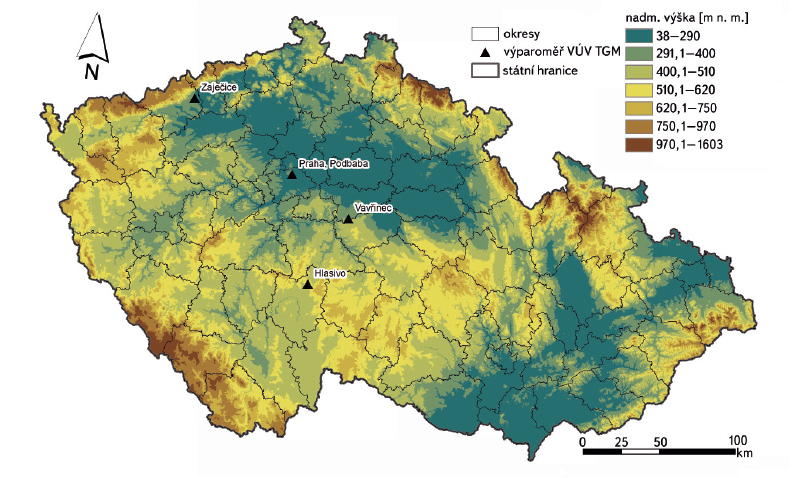
Fig. 1. Location map of evaporimeter stations administered by TGM WRI
The objective of the research is to compare the individual sites in terms of measured meteorological quantities and evaporation. The other objective is to calculate the evaporation on the sites of interest on the basis of formulas derived from the data from the Hlasivo evaporimeter station. Due to their robustness, these formulas are assumed to be suitable for evaporation calculation for other sites as well.
Evaporimeter station Hlasivo
The evaporimeter station in Hlasivo near Tábor (N 49° 29.88738‘, E 14 °45.36117‘) lies at an altitude of 537 m above sea level and has been in operation already since the year 1957. Owing to this continuous operation, we have available a 63-year data series. This represents not only the values of evaporation from the free water surface, but also other meteorological elements that the station records.
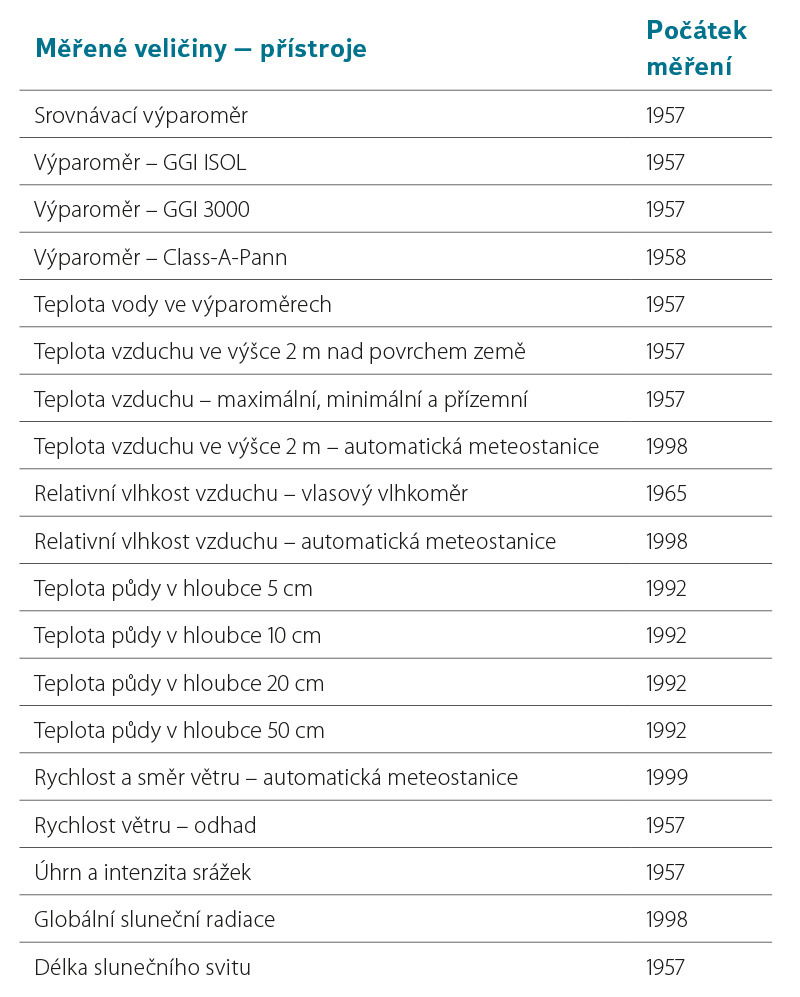
The equipment of the station has undergone many changes. Since 1998, many quantities have been recorded automatically. The quantities measured so far are provided in Table 1.
Table 1. List of instruments and measured quantities at the Hlasivo station
The evaporation metering season usually lasts from April to October, when the water table in the evaporimeter is usually not frozen. Thanks to the many years of experience in measuring of evaporation in Hlasivo, the measuring period has been adapted to the meteorological conditions on this site and the evaporation measuring period has been limited to the months of May to October.
The special feature of this evaporation metering station is not only the length of its operation, but also the comparative evaporation metering tank, which has an area of almost 20 m2 (see Fig. 2). Owing to such a large area, the measured evaporation can be considered as real evaporation from the water surface.
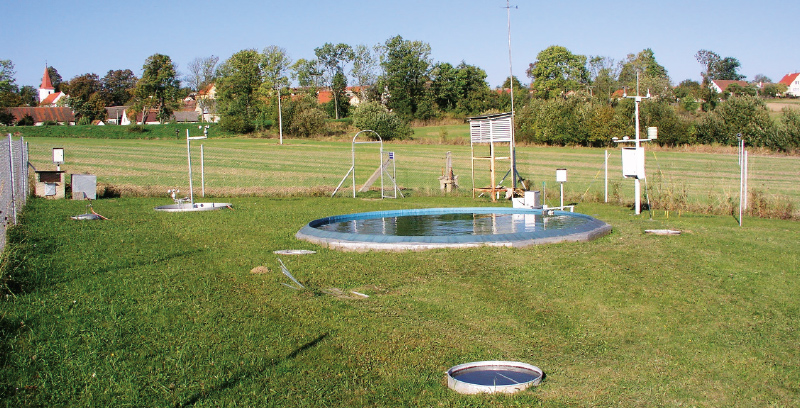
Fig. 2. Evaporimeter station Hlasivo
Evaporimeter station Podbaba
A meteorological and evaporimeter station (N 50° 7.08770‘, E 14° 23.55303‘) was built on the site of the TGM WRI Prague branch, see Fig. 3. Since 2018, there have been 3 evaporating tanks in operation with a diameter of 2 m, at an altitude of 191 m above sea level. Since May 11, 2018, a classic seasonal measurement of evaporation from the water surface is implemented here. Later, the seasonal measurement of evaporation from the water surface with a different albedo (water naturally colored by chlorophyll) was also initiated. Furthermore, the evaporation from an evaporimeter, in which salt constitutes an antifreeze admixture, is measured here during the entire year.
The station also measures air temperature, humidity, global solar radiation, wind direction and speed, precipitation, water temperature in evaporimeters and soil temperature.
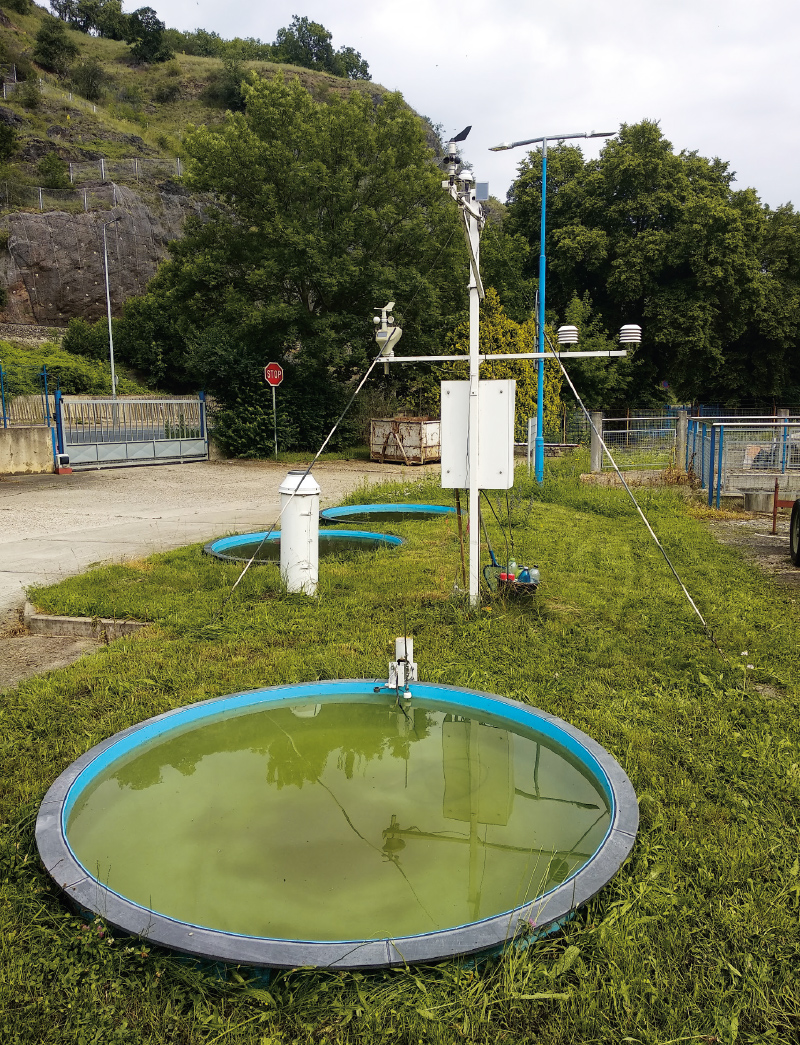
Fig. 3. Evaporimeter station – Prague, Podbaba
Evaporation from Vavřinecký pond
At the beginning of July 2019, a floating evaporimeter from the Fiedler company was installed on the Vavřinecký pond (N 49°54.87885‘, E 15°2.39373‘) (see Fig. 4). The Vavřinecký pond lies at an altitude of 375 m above sea level. From July 4, 2019, ten-minute records of direct evaporation measurement from the pond surface are available. The evaporimeter includes sensors for measuring the temperature at water table level and water temperature at the depths of 0.5 m, 1 m, 1.5 m, 2 m, and 2.5 m. The evaporimeter vessel is of the same dimensions as the EWM and GGI evaporimeters (3,000 cm2).
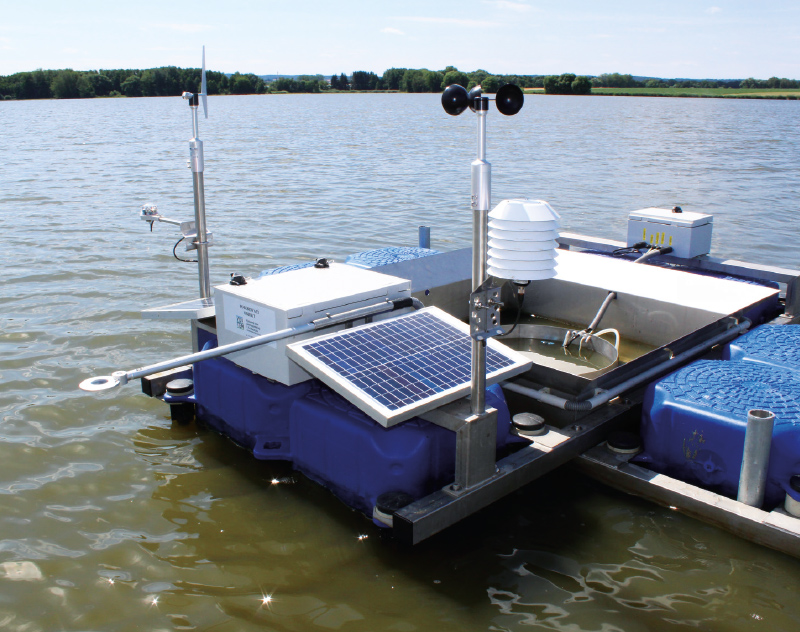
Fig. 4. Floating evaporimeter of the Fiedler brand
The floating instrument assembly also includes a weather station recording air temperature, relative humidity, dew point, total precipitation, radiation, wind speed and direction. Regarding radiation, this is the difference between global solar radiation and radiation reflected from the water surface. The evaporating measurement period ended at the beginning of October 2019. A data series of 3 months is therefore available. In 2020, measurements have been taking place since March.
Evaporation from the Zaječice retention reservoir
An identical floating evaporimeter with a weather station (see Fig. 4) was installed on the Zaječice reservoir in August 2019 and was in operation until November 2019. The Zaječice retention reservoir (N 50° 9.53530‘, E13° 28.82097‘) is located near the village of Jirkov, in the Ústí nad Labem Region, at an altitude of 290 m above sea level. The measured quantities are the same as for the floating evaporimeter on the Vavřinec pond.
Values of monitored quantities
Due to the fact that each evaporimeter station measures over a different time, the comparison of the measured quantities is very limited. The individual sites were therefore compared with the Hlasivo evaporimeter station, which has the longest observation history. The evaporation values are shown graphically on Fig. 5. The average monthly air temperature is shown in Fig. 6. Figure 7 shows the average monthly water temperature in the evaporimeters. The relative humidity is shown on Fig. 8 and 9 represents the average monthly wind speed.
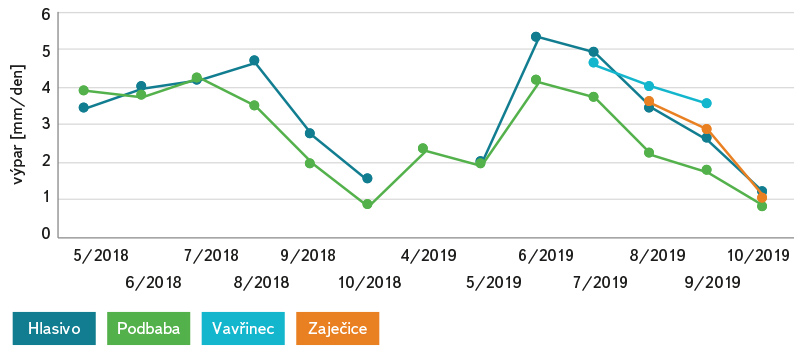
Fig. 5. Evaporation at Hlasivo, Podbaba, Vavřinec and Zaječice stations
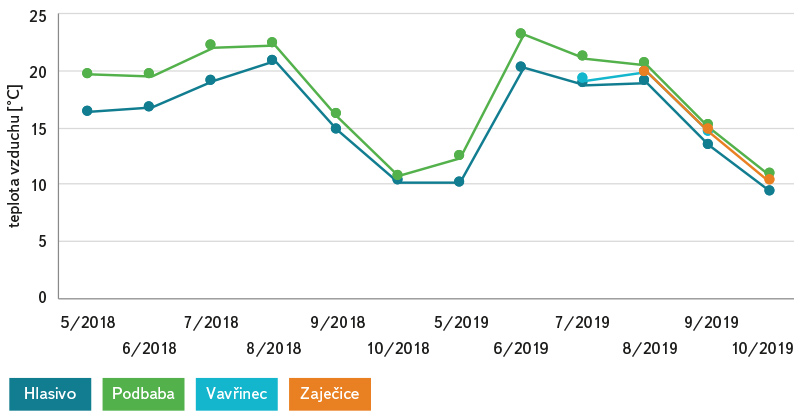
Fig. 6. Air temperature at Hlasivo, Podbaba, Vavřinec and Zaječice stations
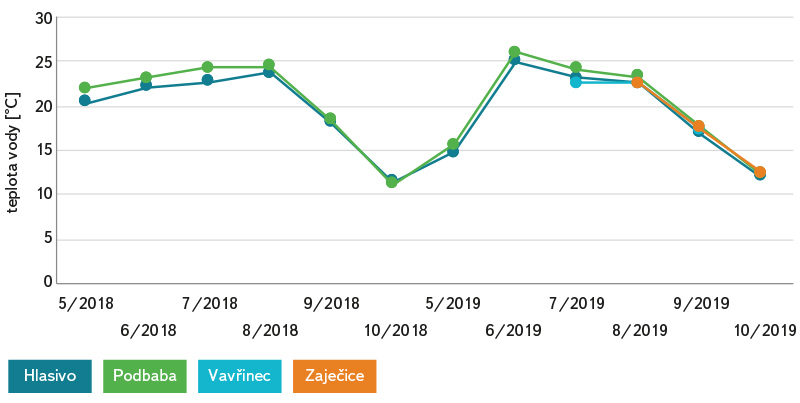
Fig. 7. Water temperature at water table level at Hlasivo, Podbaba, Vavřinec and Zaječice stations
Evaporation
Evaporation at Podbaba station is lower (E = 2.59 mm/day) for the periods June–October 2018 and May–October 2019 than at the Hlasivo station (E = 3.32 mm/day), although there was higher air temperature and water temperature in the evaporimeter (Ta = 17.6°C; Tw = 20°C; H = 69.8%) than at the Hlasivo station (Ta = 15.69°C; Tw = 19.32°C; H = 68.4%). The total amount of evaporation for the observation period 2018 was 436.8 mm at the Podbaba station and 522.6 mm at the Hlasivo station. During the 2019 season, the evaporation at the Podbaba station was 443.6 mm and at the Hlasivo station 593.6 mm. The reason for the different evaporation is the significantly lower average wind speed (V = 0.63 m/s) compared to the Hlasivo station (V = 1.34 m/s).
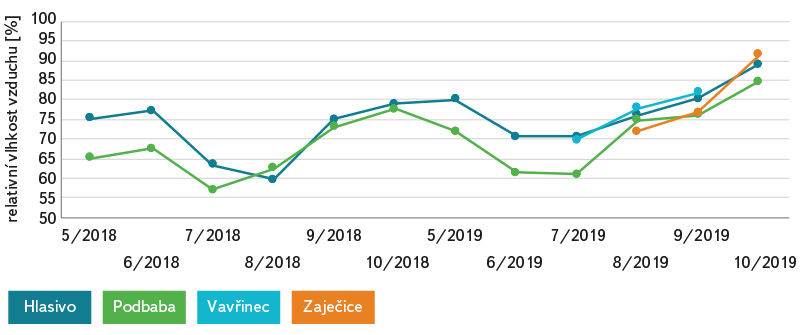
Fig. 8. Relative humidity at Hlasivo, Podbaba, Vavřinec and Zaječice stations
The average daily evaporation from Vavřinecký pond for the entire observation period (July–September 2019) is 4.06 mm/day, which is 373.4 mm per observed season. For the same period, the evaporation at the Hlasivo station is 3.65 mm/day, i.e. 336.4 mm. Air temperature, water temperature and relative humidity are very similar over the selected sites. For Vavřinecký pond, the average values for the period July–September are: Ta = 17.9°C; Tw = 20.9°C; H = 76.5%. For the same period, the values in the Hlasivo station are: Ta = 17.1°C; Tw = 21.7°C; H = 75.7%. The reason for the different evaporation is probably the higher average wind speed at the Vavřinec station (V = 1.9 m/s) compared to Hlasivo (V = 1.3 m/s). The biggest difference in the measured evaporation and at the same time in the wind speed is in the month of September.
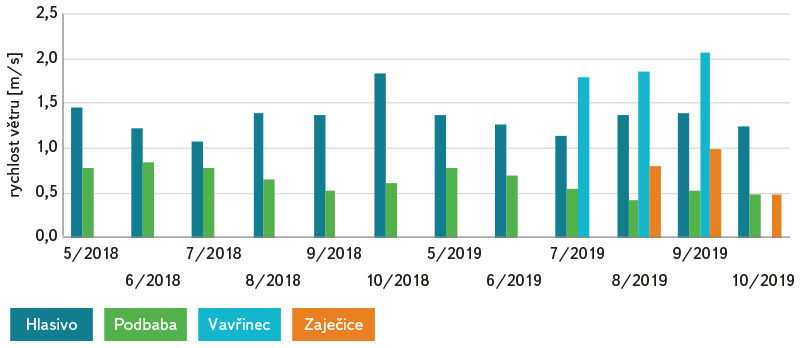
Fig. 9. Wind speed at Hlasivo, Podbaba, Vavřinec and Zaječice stations
The evaporation from the Zaječice reservoir is very similar to the evaporation at the Hlasivo station. For the period August–October 2019, the average daily evaporation is 2.49 mm/day, i.e. 229 mm for the observed 3 months. In the Hlasivo station, the average daily evaporation for the same period is 2.4 mm/day, which corresponds to 221 mm. The other measured quantities on these two sites are similar. The average air temperature in the Hlasivo station is 13.9°C and at the Zaječice site 14.9°C. The average temperature of the water at water table level in the evaporimeter at Hlasivo is 17.2°C. For the Zaječice reservoir, the average temperature of water at water table level is 17.5°C. The average relative humidity was 82% at Hlasivo station and 80% at Zaječice. The wind speed is higher at the Hlasivo station at 1.34 m/s, compared to Zaječice, where the average wind speed is only 0.77 m/s. However, from the analysis of the daily course of evaporation and wind speed at the Zaječice reservoir, it is clear that in the observed period there were windy days (up to 4.5 m/s), which significantly affected the intensity of evaporation. However, in a monthly step, these fluctuations in wind speed are not obvious.
Precipitation
On Fig. 10 it is possible to observe the monthly total precipitation and sum of evaporation at the individual stations. A total of 579.4 mm of precipitation fell at the Hlasivo station during the observed seasons of 2018 and 2019. In contrast, the evaporation was 1,116.2 mm, which is almost double of what it rained. A total of 530.6 mm of precipitation fell at the Podbaba station during the observed seasons. The evaporation again exceeded the precipitation by a total of 880.4 mm. In the period July–September 2019, 171.5 mm rained on Vavřinecký pond, but the evaporation was 373.4 mm, which is more than double the total precipitation. The total precipitation at the Zaječice water reservoir for the months of August–November 2019 was 145.1 mm and the evaporation was 244 mm.
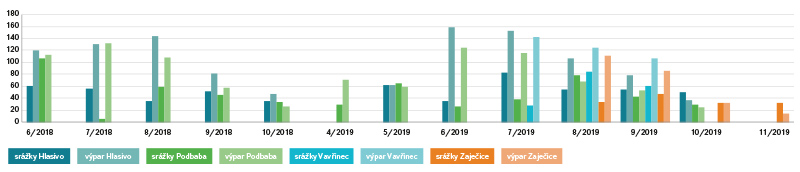
Fig. 10. Precipitation totals in Hlasivo, Podbaba, Vavřinec and Zaječice stations
Figure 11 shows the difference between total precipitation and evaporation in the individual months. The positive columns indicate the predominance of evaporation over precipitation, the negative columns indicate the opposite. It is clear from the chart that in the summer months, evaporation usually predominates over precipitation. In some months, the evaporation even exceeded the precipitation by more than 100 mm. In contrast, in the months when precipitation exceeded evaporation, the difference is less than 20 mm.
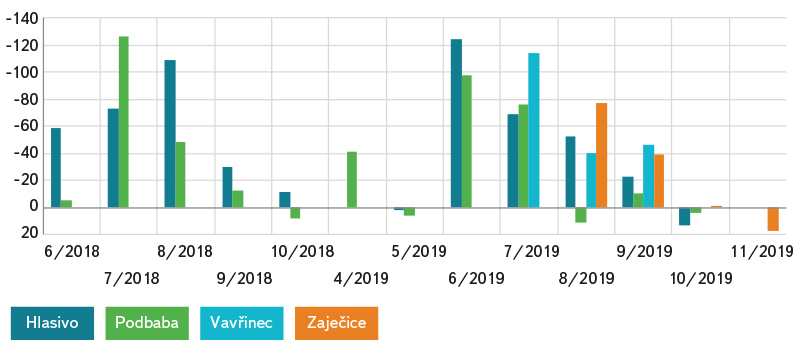
Fig. 11. Monthly balance of precipitation and evaporation at Hlasivo, Podbaba, Vavřinec and Zaječice stations
Evaporation calculation based on formulas
Due to the 63-year time series of meteorological quantities and evaporation values, the Hlasivo evaporimeter station is suitable for deriving formulas for evaporation calculation. Within the project TAČR TJ01000196: Development of software for the calculation of evaporation from water surface in the conditions of the Czech Republic [9] a universal set of formulas suitable for calculation of evaporation for other sites in the Czech Republic was developed.
The formulas were established on the basis of linear and nonlinear regression of evaporation with meteorological quantities. In the first step, the dependences of the average daily evaporation from the water surface (in a monthly step) were determined in pairs with the quantities: air temperature, water temperature in the evaporimeter and global solar radiation. Using the regression equation between the pair of selected quantity and evaporation, the evaporation was calculated. Subsequently, the residues of the calculated evaporation from the observed one were calculated. In the next step, the dependence of the calculated residues on another quantity (Ta, Tw, H, R or V) was expressed. A new formula was derived by combining the two regression relations. This formula was then extended by another quantity, in the same way.
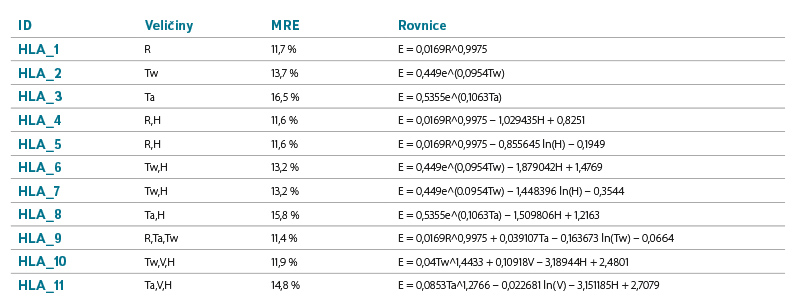
Using the procedure described above, a set of formulas was created, based on a linear, power, exponential or logarithmic model or on their combinations. Evaporation calculations from derived formulas were compared with the measured evaporation and evaluated on the basis of the highest value of the KGE coefficient [10] and the lowest value of MRE. Using these two parameters, a narrower selection of formulas was selected, see Table 2.
Table 2. Formulas for calculation of evaporation at Hlasivo station
These formulas were used to calculate evaporation at the of Prague-Podbaba, Vavřinecký pond and Zaječice reservoir sites. The results of the calculated evaporation were then compared with the measured evaporation from evaporimeters at the selected sites.
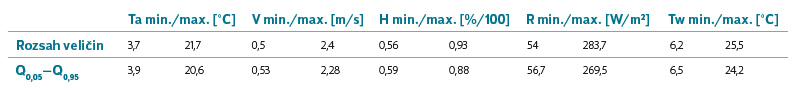
When applying the formulas, it is necessary to take into account the limitation on the range of input quantities, which determines the validity of the individual formulas. The range of validity of quantities (variables) entering the formulas is given by Q0.05–Q0.95 of measured values in the Hlasivo station, see Table 3.
Table 3. Intervals of quantities determining the validity of individual formulas
Application of formulas to daily data
Figure 12, 13, and 14 show the daily course of the observed evaporation together with evaporation modeled on the basis of empirical formulas from Table 2. It is clear from the results that the formulas reflect the values of the observed evaporation.
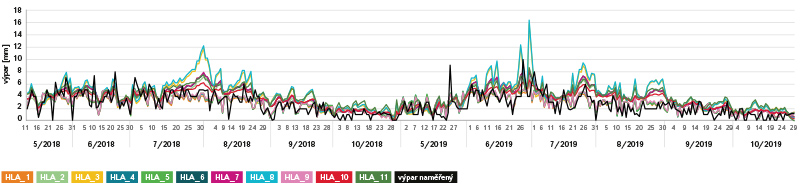
Fig. 12. Measured and calculated evaporation – Prague-Podbaba, daily course
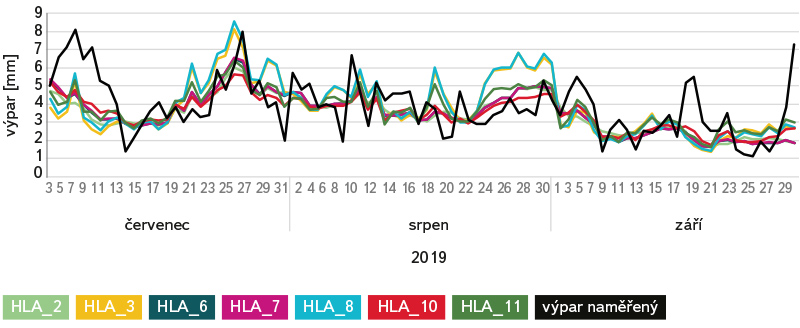
Fig. 13. Measured and calculated evaporation – Vavřinecký pond, daily course
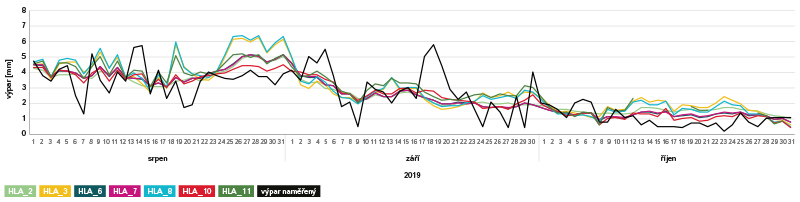
Fig. 14. Measured and calculated evaporation – Zaječice, daily course
The most significant differences between the calculated and measured evaporation at the Podbaba station occurred at the turn of July and August 2018, in June and September 2019. Formulas based on air temperature (HLA_3 and HLA_8) significantly overestimate the actual evaporation. For example, on June 30, 2019, this represents a difference of up to 12 mm (HLA_8), which is more than four times the measured evaporation. The errors in the calculation are caused by the fact that in these periods the air temperature was significantly higher (up to 31.8°C) than the range of validity of the formulas for this quantity.
Significant differences over several days between measured and calculated evaporation at the Vavřinecký pond can be observed at the beginning of July 2019. In this period, the formulas tend to underestimate the evaporation. For example, on July 8, 2019, all calculations are 3–4.5 mm lower, which is approximately twice less than the measured evaporation. A detailed analysis of the ten-minute evaporation step in relation to the course of the other meteorological quantities revealed that a very dry warm wind was blowing at the beginning of July. In the afternoon, when the evaporation was highest, the air temperature climbed over 26°C (on July 6, 2019 over 29°C) and at the same time the relative humidity of the air dropped below 30%. In the evening and morning, however, the air temperature values were around 10°C and the relative humidity climbed to more than 80%. For this reason, the daily averages of the individual quantities are very distorted and the formulas for calculating the evaporation do not reflect the actual evaporation.
Other significant deviations of the measured evaporation from the calculated one can be observed on September 17–18, 2019. In this period, the measured evaporation exceeded 5 mm/day, in contrast, the calculated evaporation was in the range of 1.7–2.8 mm/day. In these days, the average wind speed was over 3 m/s, which is outside the validity range of HLA_10 and HLA_11 formulas. The same reason applies to the day of September 30, 2019, when the average wind speed was even higher than 6 m/s. On this day, evaporation of 7.3 mm was measured, while the calculated evaporation ranges from 1.8 to 3 mm. Such significant differences between the measured and calculated evaporation are due to the fact that all formulas are based primarily on air temperature or water temperature (or global solar radiation). These quantities have the greatest weight on the result of the calculated evaporation. The wind speed enters the formulas only secondarily or the formulas do not reflect it at all. In the fall, however, the average air temperature and water temperature are very low, and therefore the calculated evaporation is significantly underestimated.
The largest deviations of the measured and calculated evaporation at the Zaječice reservoir can be observed in the period of September 3–5, 2019, when, similarly to Vavřinecký pond, a very dry warm wind blew in the afternoon. On the contrary, morning and evening air temperatures are relatively low, relative humidity is high and wind speed drops to zero. For this reason, the daily averages of the values are affected and the calculations from the formulas do not correspond to the real evaporation, thus underestimating the actual evaporation by almost half.
Another significant difference is evident in the days of September 17–19, 2019, when there was again a relatively low air temperature (which is primarily reflected in the formulas), but a very high wind speed. The difference between the measured (5.8 mm) and calculated evaporation (1.8 mm) on September 18, 2019 is up to three times for the formula HLA_3.
Application of formulas to monthly data
The calculation of evaporation in a daily step is burdened with a high relative and absolute error. A more accurate result is achieved when calculating the monthly evaporation, where the deviations of the calculation from the measured evaporation are not so significant. Firstly, the random measurement error is suppressed, which is more pronounced for daily evaporation values [11]. Secondly, the values of meteorological quantities entering the formulas are usually within the range of validity of the individual formulas.
To calculate the evaporation based on the average monthly values of the measured quantities, the formulas from Table 2 were again used. The average relative calculation error for the Podbaba station ranges between 22–55%, see Fig. 15. The black line indicates the measured evaporation. Points above this curve indicate calculations that overestimate the result. The points below this line indicate underestimated result values. The high relative error is caused mainly by the fall values when the measured evaporation is so low that an absolute error of 0.4 mm can represent a relative error higher than 50%.
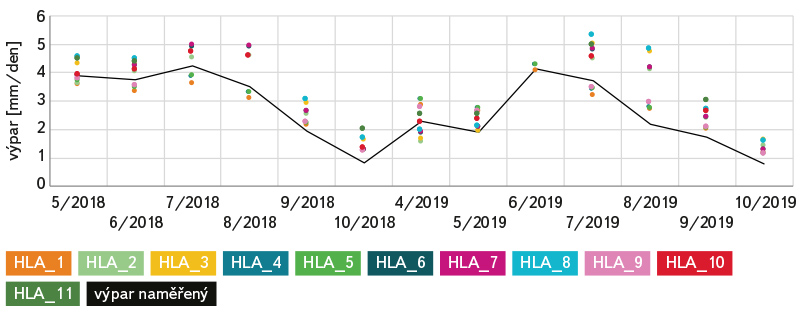
Fig. 15. Calculated evaporation for the Podbaba station based on formulas from the Hlasivo station
The best performance is achieved for formulas where global solar radiation is entered – yellow dots (MRE = 21.6–24.4%). The formulas based on air temperature are the lower performing – blue dots (MRE = 46.9–55.1%). Values that are outside the range of measured values in the Hlasivo station were omitted from the calculation.
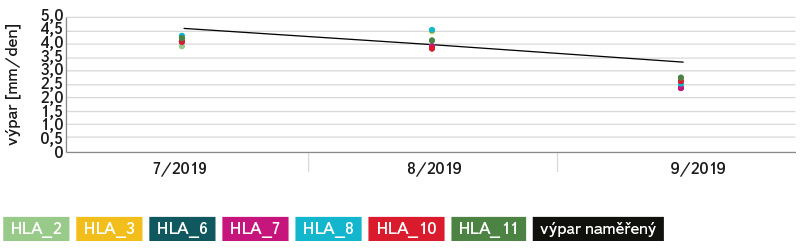
Fig. 16. Calculated evaporation for the Vavřinec station based on formulas from the Hlasivo station
Formulas for calculating the evaporation from the Hlasivo station were further applied to the data from the floating evaporimeter at Vavřinecký pond (see Fig. 16) and at the Zaječice retention reservoir (see Fig. 17). The formulas global solar radiation is entered could not be used because the floating weather stations record radiation as the difference between global solar radiation and radiation reflected from the water surface. For the Vavřinecký pond, the average relative calculation error ranges between 11% (formula HLA_11) to 14% (formula HLA_3).
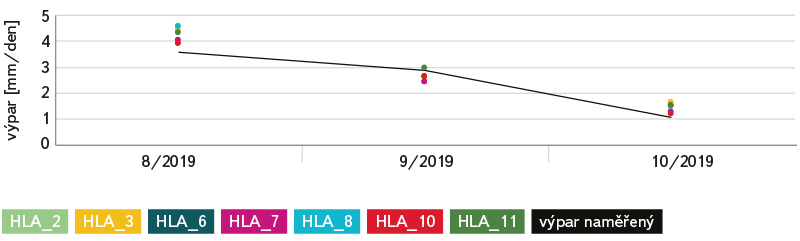
Fig. 17. Calculated evaporation for the Zaječice station based on formulas from the Hlasivo station
On the Zaječice reservoir, evaporation was measured from August to November 2019. In November, however, the quantities are outside the scope of the formulas from the Hlasivo station. The evaporation is therefore modeled only for the months August–October. The average relative error of the calculations ranges between 8.8% (formula HLA_10) to 29.3% (formula HLA_3).
Conclusion
This paper describes four evaporation stations managed by TGM WRI and compares the measured data of individual meteorological quantities and evaporation. The results show that all sites suffer from a precipitation deficit during the evaporation measurements season. The evaporation significantly exceeds precipitation, especially in the summer months. Unfortunately, the balance between evaporation and precipitation cannot be quantified beyond the evaporation season, which is usually from April to October. The solution could be a year-round evaporimeter, which is being tested at the Podbaba station. Salt is added to this evaporation tank to prevent the surface from freezing.
The formulas for calculating evaporation, based on data from the Hlasivo station, were applied to the other evaporimeter stations. The results show that the formulas can be applied both to daily data, where it is necessary to take into account the higher relative and absolute error, and to monthly data, which are more suitable for the calculation of evaporation. This confirmed the hypothesis that the formulas derived from the data from the Hlasivo station are suitable for the calculation of evaporation for the other sites as well. When applying the formulas, however, it is necessary to take into account the limited range of validity of individual quantities entering as variables into the individual formulas.
The results of the comparison between the individual sites also show that the wind speed probably plays a more important role in more accurate determination of evaporation than the current formulas from the Hlasivo station reflect. Future innovation of formulas could involve not only extending the time series, but also the development of new formulas that reflect more the wind speed and also formulas focusing on specific seasons of the year.
Acknowledgments
The paper was written as part of the projects Creation of software for calculation of water surface evaporation for the conditions of the Czech Republic (TJ01000196) financed by the Technology Agency of the Czech Republic and Analysis of adaptation measures to mitigate the impacts of climate change and urbanization on the water regime in the outer Prague area (CZ.07.1.02/0.0/0.0/16_040/0000380) financed from the Operational Programme Prague – Growth Pole of the Czech Republic.
