ABSTRACT
The 1903 flood was undoubtedly one of the most significant floods of the 20th century in Moravia and Silesia. Although systematic observations of water levels had already begun at many gauging sites during this period, it is difficult to convert historical water levels recorded at limnigraph stations into present-day equivalents due to historical territorial changes in terms of politics (Prussia versus the present-day Czech Republic), landscape structure (forest cover in the historical and present-day landscape), morphology (terrain and urban development in the affected areas), and water management conditions (the course of the Opava river channel and the condition of water flumes in 1903 and today). Useful (though not always entirely reliable) sources include historical flood marks, photographic documentation, historical maps and plans, reports in the contemporary press, family chronicles, and the recollections of millers, sawyers, and other craftsmen using water power. These sources form a rather heterogeneous body of evidence, and it is therefore necessary to find ways to verify and combine them. One possible approach is to use these data in GIS-based spatial analyses and subsequently as inputs for rainfall–runoff and hydraulic modelling. Since the team of the Czech Hydrometeorological Institute (CHMI), together with its partners, had already conducted similar analyses (e.g. during the reconstruction of the 1872 historical flood on Blšanka), they also attempted to apply this approach to the 1903 flood on the Opava river. The results, including a partial uncertainty analysis, are presented in this article.
INTRODUCTION
Reconstructions of historical floods are invariably associated with considerable uncertainty in the available data and, frequently, with the absence of discharge measurements or water-level records. If data on peak water levels can be identified in historical sources or in the field (e.g. flood marks), they represent a valuable – and often the only – source of information. Nevertheless, direct comparisons between peak water levels during historical floods and those recorded in recent decades remain subject to considerable uncertainty. In many cases, urban development and the morphology of floodplain areas have changed to such an extent that these water-level comparisons can only be regarded as approximate. On the other hand, the data and, in particular, the technologies currently available make it possible to reconstruct the course of historical floods. Using GIS-based spatial analyses and hydrological models (rainfall–runoff and hydrodynamic), the Czech Hydrometeorological Institute (CHMI) has already reconstructed the catastrophic historical flood on Blšanka in 1872. For this analysis of the historical flood, available archival materials were used, flood marks were resurveyed (some of which had been incorrectly identified as flood marks), and the possible course of the flood was subsequently reconstructed using rainfall–runoff and hydrodynamic models. One of the important factors is also the consideration of the historical runoff coefficient in the individual sub-catchments, because forest cover and land use in the landscape in 1872 undoubtedly differed from those of today, which also applies to the 1903 flood and others. On the other hand, during extreme rainfall events, the retention capacity of soils and the landscape becomes saturated, the proportion of surface runoff increases, and the influence of land use on runoff magnitude gradually decreases.
These factors were also taken into account in the reconstruction of the 1903 flood in the Opava River basin, with the main focus on the town of Opava. The 1903 flood ranks among the most significant flood events ever to affect the town, including in comparison with the extreme floods of 1997 and 2024. In addition to the Opava basin, floods and the associated damage were documented in virtually all catchments of the Jeseníky Mountains (Bělá, Vidnávka, Desná, etc.), as well as in the Beskydy part of the Odra basin (Ostravice and the right-bank tributaries of the Odra); see, for example, Brázdil, Kirchner et al. (2007) and Brosch (2005). In these analyses, the main objective was to reconstruct as accurately as possible the morphology of the built-up area of Opava and the river channel itself, together with the historical millraces, of which only remnants have survived to the present day. As part of the evaluation of the September 2024 flood, this extreme runoff event was also compared with previous floods. Following this assessment, greater attention was devoted to the 1903 flood as well, since it was among the events that initiated contemporary discussions and plans for Nové Heřminovy water reservoir. Another interesting aspect involved changes in the course of the Opava channel itself and the gradual disappearance of millraces within the built-up area of the town.
Objectives of the study, research questions, and hypotheses
The aim of this study is to quantitatively reconstruct the course of the July 1903 flood in the Opava River basin using a combination of historical sources, GIS-based spatial analyses, and hydrological and hydrodynamic modelling. The study focuses primarily on refining the estimate of the peak discharge of this event, which in the available literature is subject to considerable uncertainty and shows a substantial range of values depending on the methodology used.
A further objective is to verify the applicability of an integrated GIS–hydrological approach for the reconstruction of historical floods under conditions of limited availability of direct hydrological measurements. This approach consists in combining heterogeneous data sources (historical maps, flood marks, archival documents) and using them as inputs for rainfall–runoff and hydrodynamic models.
Another objective is to place the reconstructed event in the context of modern extreme floods in the Opava River basin, particularly the floods of 1997 and 2024, and to assess its relative extremity in terms of peak discharges, flood extent, and impacts on the built-up areas of settlements.
Based on the above objectives, the following research questions are formulated:
- What was the realistic range of the peak discharge of the 1903 flood at the Opava profile?
- To what extent is it possible to reconstruct the course of a historical flood with a sufficient degree of reliability by combining historical data with modern modelling tools?
- To what extent are the modelling results consistent with preserved flood marks and qualitative descriptions of flood extent in historical sources?
- How does the 1903 flood compare in magnitude and character with the floods of 1997 and 2024?
- What influence do uncertainties in the input parameters (e.g. land use, infiltration characteristics, channel morphology, and floodplain morphology) have on the reconstruction results?
Based on existing knowledge and available source materials, the following initial hypotheses are formulated and subsequently tested within the study:
- The peak discharge of the 1903 flood at the Opava profile was significantly higher than values derived using simpler historical calculation methods and lay approximately within the range corresponding to extreme discharges (hundreds of m³ · s-1).
- The combination of GIS-based spatial analyses, rainfall–runoff modelling, and hydrodynamic modelling (1D/2D) enables a more accurate and physically consistent reconstruction of historical floods than approaches based solely on empirical relationships or simplified hydraulic calculations.
- The results of the hydrological and hydraulic modelling are broadly consistent with preserved flood marks and the documented extent of flooding and may therefore be regarded as a realistic approximation of the course of the flood.
- The 1903 flood represented an extreme hydrological event comparable to – or locally even more severe than – the floods of 1997 and 2024 and exceeded commonly considered design discharges.
- During extreme rainfall episodes and under conditions of high antecedent catchment saturation, meteorological forcing and the morphometric characteristics of the catchment play a dominant role, whereas the influence of differences in land use gradually decreases.
- Uncertainties associated with the lack of input data can be quantified using stochastic approaches (e.g. Monte Carlo simulations), and these uncertainties significantly influence the resulting range of estimated peak discharges.
The formulated objectives, research questions, and hypotheses provide the framework for the subsequent application of modelling tools and the interpretation of the results of the reconstruction of the 1903 flood.
METEOROLOGICAL SITUATION
The high level of catchment saturation was an important factor in the development of the July 1903 flood. June 1903 had already been very wet in the Odra basin. For example, more than 60 mm of precipitation fell on average during the period from 11 to 16 June alone. As a result, catchment saturation was already considerable by 6 July. Between 6 and 8 July, a wavy cold front extended across Silesia and Moravia further southwards, separating cold air over western Europe from warm air over eastern Europe. In the Jeseníky region, a further approximately 35 mm of precipitation fell during these days, so that by the morning of 9 July the saturation of the local catchments was almost twice the normal level for that time of year.
A cyclone formed along this frontal boundary over northern Italy as early as 7 July and subsequently moved north-eastwards along the so-called Vb track in the following days. On 9 July 1903, it was situated over south-eastern Europe; along its eastern and northern margins, warm and humid air from the eastern Mediterranean flowed over Moravia and Silesia (Fig. 1). A northerly wind prevailed in the lower atmospheric layers and was intensified by the strong horizontal pressure gradient between the cyclone and an anticyclone centred over the British Isles. As a result, pronounced orographic enhancement of precipitation occurred, with the precipitation maximum located along the northern edge of Hrubý Jeseník; most of the area where totals exceeded 100 mm is drained into the Odra basin (particularly the Opava, Bělá, and Vidnávka catchments) within present-day Czech and Polish territory. A second anticyclone extending over eastern Europe also played a role by preventing the displacement of the precipitation-producing cyclone.
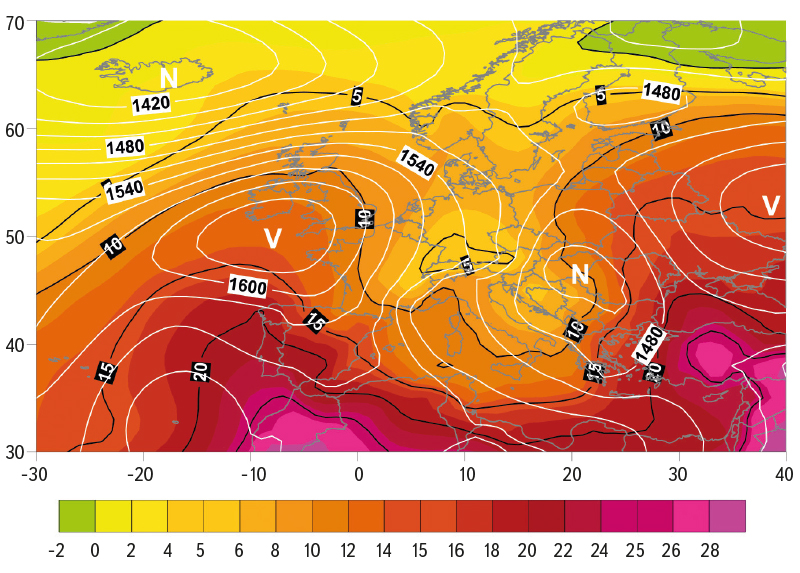
Fig. 1. Synoptic situation on 9 July 1903, expressed by the height of the isobaric level of 850 hPa in gpm (white isohypses) and the air temperature [°C] at this level (colour scale); the letters indicate the cyclone (N) and the anticyclone (V) (source: Wetterzentrale.de)
During this event, 240.2 mm of precipitation – i.e. 240.2 litres per m² – was measured at Nová Červená Voda station on 9 July, a total that was not exceeded during the 20th century until July 1997 at Studniční hora in Krkonoše. Until the flood of September 2024, this remained the daily precipitation record for Moravia, Bohemian Silesia, and Jeseníky. This exceptionally high daily precipitation total is remarkable given the low elevation of the station (310 m a.s.l.), which is nevertheless situated in the northern foreland of a mountain ridge whose highest peak, Studniční vrch, reaches 992 m a.s.l. In addition, precipitation totals of 200 mm or more were recorded that day at three other stations: 221.0 mm at Starý Rejvíz (757 m a.s.l.), 217.7 mm at the Šumný potok station (559 m a.s.l.), and 200 mm at Lázně Jeseník (625 m a.s.l.).
The extraordinary flooding was exceptionally destructive, particularly in Jeseníky, where the damage caused was regarded as the greatest in history until 1997. This may be illustrated by two contemporary reactions. “My heart bled at the sight of such a disaster,” said the provincial governor, Count Heinrich Larisch-Mönnich, in an emotional opening address to that year’s session of the Silesian parliament in Opava. A “view from below” was, among others, captured by the Silesian prose writer Ludmila Hořká (1892–1966) in her short story Velká voda [The Great Flood], which depicts the coexistence of villagers with the river: “And Františka still remembers the great flood of 1903, when boats passed through our village (near Kravaře) as if it were Venice, when water flowed into cottages through the windows, and when two of them collapsed as though made of gingerbread. At that time even the authorities made an effort, sending soldiers to help, and firefighters also arrived from somewhere – but that is useful when there is a fire, and since there was no fire anywhere, they at least extinguished their thirst.”
The 1903 flood from a hydrological perspective in historical and other sources
The flood of 10–11 July 1903 in the Odra basin, which until the July 1997 flood had been the most destructive modern flood event in the region, represented a major natural disaster for this area. It was caused by extremely high two-day precipitation totals. On 9 July, the centre of the precipitation was located in the Hrubý Jeseník region, before shifting to Moravian-Silesian Beskydy on the following day.
Already in the same year, several authors described the situation in Jeseníky in detail, for example Neu verbesserte Auflage der Hochwasser-Katastrophe am 10. und 11. Juli 1903 in politischen Bezirk Freiwaldau (1903) [3], possibly [4] or Landesanstalt für Gewässerkunde (1904) [5]. The event was subsequently revisited by other authors, including Zeman (1961) [6], Polách and Gába (1998) [7], Štekl et al. (2001) [8], and Řezáčová et al. (2003) [9]. The 120th anniversary of the flood in Jeseníky was commemorated by Halásová (2023) [10].
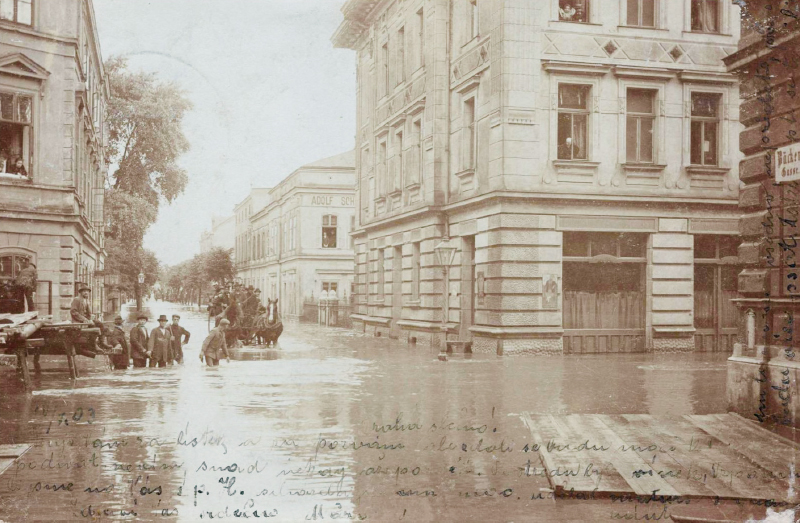
Fig. 2. Photo from the 1903 flood in the area of Pekařská street (source: Provincial Archives of Opava, archival number cz227205010//1062//1/2/1/1/2//23+43)
In the Bělá basin and in the catchments of streams flowing into Kłodzko Nysa, flood marks comparable to those in Opava are not available. An exception is the statue of St Florian in Vidnava, on which flood marks from 1903, 1997, and 2024 can be found. The statue is on the right bank approximately 70 m from the watercourse and about 300 m from Vidnava hydrological station (Vidnávka), which is on the left bank further downstream. It is known that Vidnávka reached peak water levels of 370 cm on 7 July 1997 and 453 cm on 15 September 2024. The flood mark from 1903 is situated between them, indicating that Vidnávka most probably exceeded 400 cm. At that time, however, the river had not yet undergone significant channel regulation, which introduces additional uncertainty into the estimates. The situation is even more complicated on the Bělá, where flood marks documenting individual events are absent. According to the measured data, the Bělá at Mikulovice reached a peak water level of 475 cm on 15 September 2024 and 407 cm on 7 July 1997. For 1903, no measured data are available and it is therefore necessary to rely solely on descriptions of the event in historical sources. Zeman (1961) [6] states that a water level of 598 cm was recorded in Česká Ves at the toll bridge. Other sources refer to a level of just under 6 metres. The present-day hydrological station and the bridge are 8 km apart in a straight line and approximately 11 km apart along the river channel. The water level measured at the bridge may have been influenced by the bridge itself – specifically by its blockage and the resulting backwater effect. Furthermore, it is an indisputable fact that one of the narrowest sections of the Bělá river is located approximately 700 m upstream, which could have significantly affected the water level at the bridge. It is also documented that a breach occurred in the regulation embankment at Staříč, i.e. upstream of the bridge. In view of the above findings and the enormous material damage, it may be assumed that the Bělá river in Mikulovice most probably reached a peak water level exceeding 400 cm in 1903. Whether the level was even higher would require further and more detailed analysis.
If attention is focused on the town of Opava itself, the study by Kříž, Sochorec, and Kříž (1963) [11] probably provides the most detailed analysis of the 1903 flood. The authors focused primarily on hydrological and hydraulic evaluation based on the preserved data available at the time. Given the period in which the study was conducted, it is evident that GIS, mathematical models, and digital data could not yet be used.
Systematic observations of water levels on the Opava began in 1895. Until regulation of the Opava channel and the profile in 1912–1913, the water level on 11 July 1903 remained the highest on record, reaching 525 cm. Using the rating curve valid at the time for the surveyed Pilšťský Bridge profile, the Hydrological Department in Opava calculated a discharge of 454.5 m³ ∙ s-1.The authors of study [11], however, questioned this value and, using a formula for mean cross-sectional velocity with values of 1.7–1.8 m ∙ s-1 and a flow area of 138 m², proposed a revised peak discharge of 235–248 m³ ∙ s-1. The authors themselves nevertheless emphasised that, at the time of the evaluation, they did not have data on flow areas and velocities for the left and right floodplains, which are essential parameters for the assessment of an extreme flood event. Likewise, in their subsequent calculations, the authors revised the value of the mean cross-sectional velocity during the flood peak from 1.8 m ∙ s-1 and, using Manning’s equation, proposed revised values in the range
of 2.32–3.11 m ∙ s-1. Using these values, they proposed a peak discharge in the range of 283–404 m³ ∙ s-1. The mean value of 343.5 m³ ∙ s-1 more or less corresponds to the peak discharge value of 360 m³ ∙ s-1 reported by Brosch [2]. For the 1903 flood, Brosch [2] reports peak discharges of 750 m³ ∙ s-1 for Ostravice / Moravská Ostrava profile, 400 m³ ∙ s-1 for Odra / Svinov profile, and 1,500 m³ ∙ s-1 for Odra / Bohumín profile, where sources describe the event as the greatest flood disaster in the history of the town [4]. In discussing the missing data, the authors also point out the absence of information on water-surface slope within the channel and floodplain areas, which can nowadays be successfully addressed using 1D and 2D hydraulic modelling. Study [8] also employed an approach based on the antecedent precipitation index (API), in which the maximum possible peak discharge derived using this method was estimated at 290 m³ ∙ s-1; however, from the perspective of simulations of this episode using rainfall–runoff models with an adequate API, this value appears to be substantially underestimated. Likewise, it does not correspond to the differences in water levels indicated by the preserved flood marks in Opava. To illustrate the wide range of estimated values, reference may also be made to the conclusions of the team led by Brázdil and Kirchner (2007) [1], as well as the earlier monograph by Brázdil et al. [12], in which the authors interpret the flood peak as corresponding approximately to a Q50 event. Such a return period, however, would not have caused the catastrophic damage reported in contemporary sources for the area between Opava and Děhylov.
The overall situation in the town of Opava is further illustrated by reports in the contemporary regional press, for example the newspaper Grenzbote des nordwestlichen Mährens [13] (translated from German): “The situation in Opava was also extremely dangerous. First, Kateřinky (Katharein) was flooded, after which the local fire brigade and volunteer firefighters from Opava intervened. An hour later, the floodwaters also inundated Ratiboř suburb (Ratiborer Vorstadt). A company of the territorial defence force was called in and, together with firefighters, began evacuating residents from houses situated in lower-lying areas by the light of torches and lanterns. On Friday night (10 July), the water level in the Opava had already risen to the bridge, and it was expected at any moment that the river would overflow its banks. At that moment, two additional companies of imperial infantry arrived at the bridge. A third company was dispatched to the sugar refinery in Kateřinky, where the situation had become critical. Water had entered many houses and in some places even covered the ground-floor windows, making the rapid evacuation of endangered residents essential. Many refused to leave their homes and had to be evacuated by force.” The newspaper Deutsches Volksblatt für Mähren und Schlesien (15 July 1903, No. 56, Vol. 27, p. 4) reported: “The news from Opava is distressing. It was reported from there on the 12th of this month: Although the water has receded considerably, Ratiboř suburb and the neighbouring municipality of Kateřinky still resemble one vast lake, from which half-collapsed houses, tree trunks, and pieces of furniture protrude. With the assistance of an engineer company that had arrived late the previous evening from Kraków, it proved possible at dawn today to reach those parts of Ratiboř suburb that had until then been completely cut off from the outside world. Among them was Schwarzgasse (Black street), which presented a terrifying scene of suffering. The day before yesterday, water had entered the ground-floor dwellings there with such speed that the inhabitants barely escaped with their lives. Meanwhile, the military authorities organised supply convoys which transported bread, rolls, and milk by pontoon to houses affected by the flood. The first convoy was led by the provincial president, Count Thun-Hohenstein, who also personally participated in the distribution of food, at times standing chest-deep in water. During the course of the day, thirteen houses collapsed in Ratiboř suburb after their foundation pillars had been undermined by water, and many more houses were on the verge of collapse. A man whose identity has not yet been established was killed beneath the ruins of one of the collapsed houses. The greatest disaster currently causing concern is the shortage of water resulting from the flood, which has affected Opava since this morning. As already reported, the waterworks was forced to suspend operations yesterday as a result of the flooding, because its water supplies had been contaminated by infiltrating groundwater. Thus, since this morning the town has effectively been without water. The municipal park and the military shooting range are flooded, the waterworks is under water, and operations had to be suspended. In Kateřinky and Ratiboř suburb, the flood caused extensive damage. Cesspits in the houses were undermined and lifted by the water. Nákladní street (Lastenstrasse) and all the surrounding houses and gardens are completely flooded, while in Pekařská street (Bäckergasse) the water reached as far as 400 paces from Horní náměstí (Oberring). In Parkstraße (the area of present-day Sadová street), one house collapsed. The inhabitants were rescued in time. Many shops and offices had to operate with a greatly reduced number of employees because staff were unable to reach the town. For this reason, and also because the printing works was under water, the newspaper Freie schles. Presse could not be published.” Lidové noviny then provided more general information (12 July 1903, No. 157, Vol. 11): “From Opava: Kateřinky was flooded yesterday. Two additional companies of troops were yesterday dispatched to Krnov, which is under water and completely cut off from all railway connections, in order to provide assistance… Yesterday at 4 p.m., railway traffic between Opava and Krnov had to be suspended because the continually rising water had severely damaged the line. At 5 p.m., an attempt was made to dispatch a relief train carrying three battalions of troops to Krnov, but the train was forced to stop at Úvalno station, from where the soldiers had to continue on foot to Krnov. The military command in Opava requested the immediate deployment of engineering corps units from Kraków to the endangered districts. According to incoming reports, the flood had reached dimensions such as had never before been experienced in Silesia. The damage is enormous… 14 July 1903, No. 158, Vol. 159 … All municipalities along the Northern Railway line from Opava to Svinov are flooded.”
Interesting sources of information are also provided by the recollections of eyewitnesses who were expelled to Germany after the Second World War. Two contributions dealing directly with the 1903 flood in Opava were published in Troppauer Heimat-Chronik in 1953 and 1963. According to Franz [14], the water level of the Opava river at the “large bridge” was approximately 1.7 m above normal level. This level was recorded at noon on Friday 10 July. The author lived directly at Ratibořská street No. 40 /Ratiborer Straße 40/ in Opava and, later that same afternoon /10 July/, the water had risen to the height of the shed roof. “The water, however, was filthy and smelled terrible because it was mixed with the contents of cesspits and manure heaps.” From the afternoon onwards, the family remained in the attic of the house. Crossing the bridge had already become impossible, since water was flowing across it like a wild river. Nevertheless, on the following morning /11 July/, firefighters were still working on the bridge, attempting to remove beams trapped in the bridge structure in order to clear the passage for the water. The water level inside the house reached a height of 167 cm /on the morning of 11 July/. “We spent the night before Sunday, 12 July 1903, in relative peace, because the rain had stopped and the water had begun to recede slowly. On Sunday, the municipal building authority and volunteers erected temporary footbridges in the streets. By Sunday evening, the water had receded sufficiently for our house to be free of flooding. Every room was covered in mud up to waist height.” Franz further notes that the horrors of the floods, which frequently occurred throughout the history of Opava, are still recalled by the unofficial name of Ratiboř suburb: “Nasses Viertel” (“Wet Quarter”). The second eyewitness, Otto Schreiber, lived nearby at Ratibořská No. 30 /Ratiborer Straße 30/. Schreiber [15] describes how the water level rose to just 5 cm below the windows of his room and how his family had to live for several days on the first floor of a neighbour’s house. He further notes that this flood, followed by the flood of September 1910, subsequently led to extensive regulation of the Opava river channel.
Historical plans, sketches, and maps constitute an important source of information, particularly regarding the topography of the study area. Fig. 3 shows a site plan of part of the town of Opava, focusing on Ratiboř suburb and Kateřinky, dating from 1826 (Provincial Archives in Opava). In comparison with the Imperial Imprints of the Stable Cadastre (Moravia and Silesia were surveyed between 1826 and 1836), differences are apparent in the representation of the built-up area of Kateřinky at that time, see Fig. 4. Differences in the depiction of buildings are also visible in the Second Military Survey (Moravia and Silesia were surveyed between 1836 and 1840). It is also necessary to take into account the fact that Opava was affected by one of the more significant historical floods precisely in 1826, after which one of the historical regulations of the Opava channel was conducted; further floods subsequently occurred in 1829, 1831, and 1838 [1, 2].
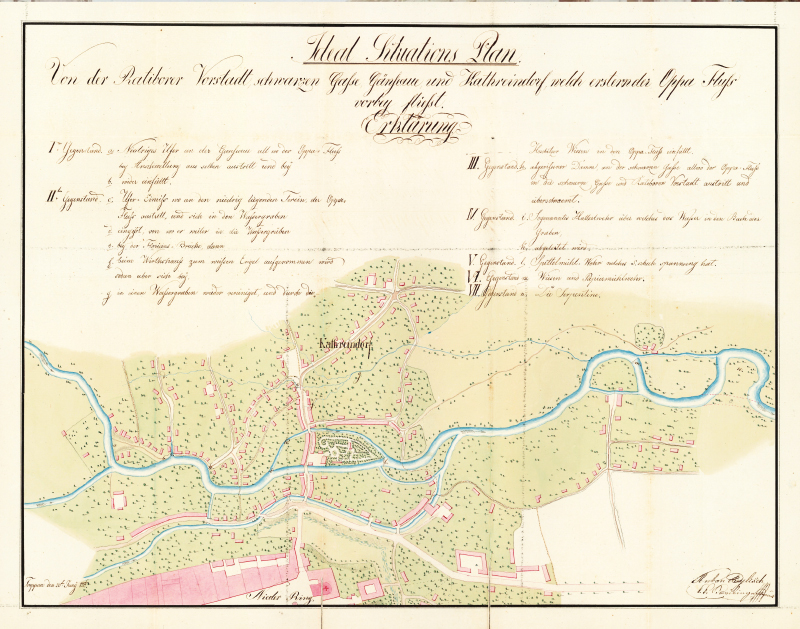
Fig. 3. Site plan of Kateřinky and Racibórz suburb from 1826 (source: Provincial Archives of Opava, archival number 688, inv. no. 50, signature 37/2)
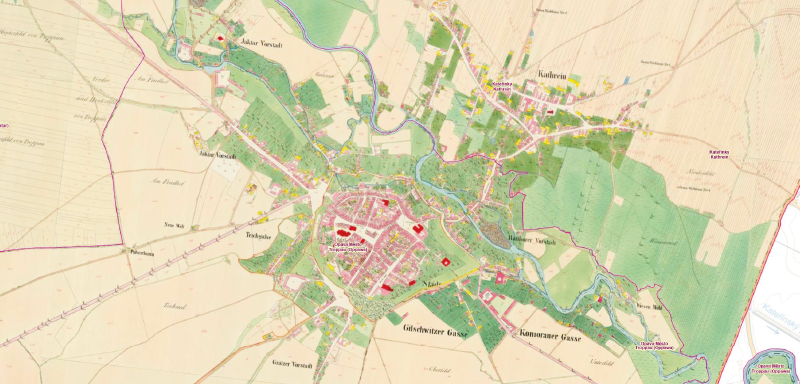
Fig. 4. Extract from the Imperial Imprint of the Stable Cadastre for Kateřinky and the Racibórz suburb (source: ČÚZK)
Data and methods for hydrological reconstruction
As already mentioned in the introduction, the main tools used for the reconstruction of the flood were GIS software (ESRI ArcMap, ArcHydro, SAGA GIS, GRASS GIS), rainfall–runoff models (HEC-HMS), and hydrodynamic models (HEC-RAS, MIKE 11/21c). The Imperial Imprints of the Stable Cadastre and the Second Military Survey were the principal sources of information on historical topography and, to some extent, elevation data. Among the most important historical cartographic materials provided by the Provincial Archives in Opava were the Site Plan of the Town of Opava from 1826, the Plan of the Drainage Situation of the Sugar Refinery in Opava from 1854, and in particular the Plan der Landeshauptstadt Troppau mit der neuen Wasserleitung und den Stadterweiterungsgründen by Eduard Labitzke from 1876. After transformation into the S-JTSK coordinate system using control points, these materials were used for the digitisation of the drainage network, specifically the Opava channel itself and the historical millraces. Following digitisation in GIS, these features were converted into the schematic formats required for the DHI MIKE and HEC-RAS hydrodynamic models. The digital terrain model was subsequently incised along the historical course of the Opava channel using the ArcHydro toolset for the ESRI platform and the r.carve module in GRASS GIS. The historical millraces were likewise incised into the terrain model; however, readily usable geodetic data describing the channel parameters and diversion structures of these features are not available (parameters of the channels can also be derived from historical water registers; however, this represents a highly demanding task in terms of both archival research and time, which is one of the reasons why this article emphasises the much more efficient possibilities offered by GIS tools). Nevertheless, during such an extreme flood event, the influence of these hydraulic structures on the extent of the inundated area was probably only marginal. Moreover, most of the millraces were situated in the right-bank zone, whereas the most severely affected area, Kateřinky, lies in the left-bank zone. The only exception was a millrace that approximately followed the route of the present-day streets Partyzánská, Holasická, and Na Potůčku.
Sensitivity analysis using the Markov Chain Monte Carlo method was conducted primarily within the HEC-HMS rainfall–runoff model, specifically for the possible ranges of infiltration values, Curve Number (CN) values, and concentration times, which depend both on catchment morphology and land use. In 1903, forest cover in the Opava basin was undoubtedly less extensive than today; therefore, CN values for the individual sub-catchments were set within the range from 65 (forest, HSG A) to 92 (arable land, HSG D), with 250 samples generated for the specified interval range. Because CN values are primarily derived for agricultural soils, values for forest soils in the upper parts of the catchment were derived using nomograms for forested areas; see, for example, Haan et al. [16] and Mishra and Singh [17]. The AMC (Antecedent Moisture Conditions) parameter was not modified because both precipitation totals and the antecedent precipitation index were known. At the same time, conversion equations between the SCS-CN method and the Green–Ampt method (see, for example, Mishra and Singh [17] and Bedient et al. [18]) were used to define the interval range for infiltration velocity.
The results of the HEC-HMS simulations with Markov Chain Monte Carlo sensitivity analysis are shown in Fig. 5. For the present-day Opava gauging profile, the peak discharge obtained using the SCS-CN method (and similarly for the Green–Ampt method) ranged from 389 m³ ∙ s-1 to 529 m³ ∙ s-1, with a mean peak discharge of 444 m³ ∙ s-1. This value corresponds relatively well to the peak discharge derived from the historical rating curve (454 m³ ∙ s-1).
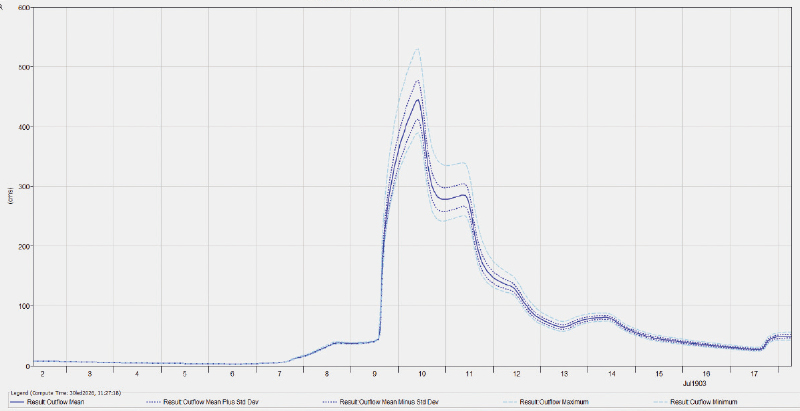
Fig. 5. Comparison of the simulated flood peak of the 1903 flood using the HEC-HMS model for the Opava profile with uncertainty analysis using the Markov chain Monte Carlo method
The simulations performed in the HEC-HMS rainfall–runoff model were subsequently followed by simulations in the MIKE and HEC-RAS hydraulic models in both 1D (reconstructed course and condition of the channel according to preserved historical sources and maps) and 2D (state of the floodplain areas based on preserved maps and plans). Flood-mark elevations (Ratibořská street and the industrial area on Sadová street) and the extent of inundated areas in comparison with the Q100 flood and the floods of 1997 and 2024 were used for verification (Fig. 6). In terms of the flood-mark elevation on Ratibořská street, the simulated water level corresponding to a discharge of 438 m³ ∙ s-1 provided the best agreement (Fig. 7). If historical sources describing the situation in Kravaře and other settlements further downstream are also taken into account, this value may be regarded as realistic, including in comparison with the evaluated peak discharge of 670 m³ ∙ s-1 for the September 2024 flood (the difference between the flood-mark elevation and the 09/2024 flood level is 23 cm).
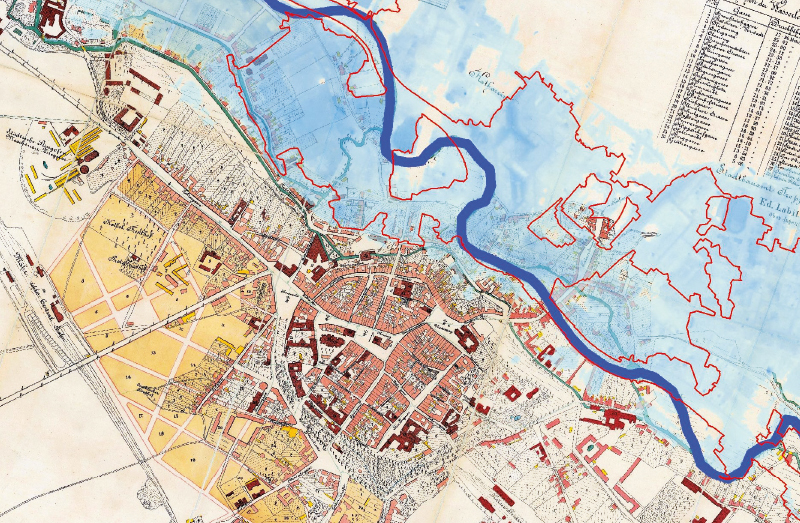
Fig. 6. Simulated water levels and flood extent in 1D and 2D hydraulic models (HEC-RAS and DHI MIKE) for the peak discharge of 438 m3 ∙ s-1. The red line is the Q100 boundary (388 m3 ∙ s-1) for the present-day riverbed and floodplain. The base map is Labitzky‘s 1876 plan of Opava
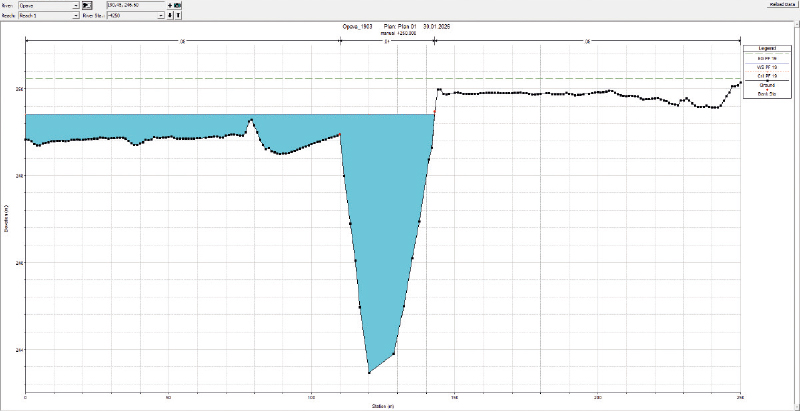
Fig. 7. Simulated water level in the HEC-RAS model for a peak discharge of 438 m3 ∙ s-1 in the area of Ratibořská street. The elevation of the flood mark on building no. 43 is 249.45 m above sea level (source: own geodetic measurements)
DISCUSSION
The reconstruction of the July 1903 flood in the Opava River basin is, naturally, subject to a range of uncertainties arising primarily from the limited availability of direct hydrological measurements, changes in the morphology of channels and floodplain areas, and substantial transformations in land use from the beginning of the 20th century to the present day. Nevertheless, based on the combination of historical sources, flood marks, contemporary testimonies, and later hydrological analyses, it may be concluded that this was an exceptionally extreme event whose impacts were comparable to – and in some profiles probably even more severe than – those of the floods of 1997 and 2024. The considerable variability in estimated peak discharges for the Opava river reported in the literature illustrates the limitations of traditional calculation approaches based on simplified hydraulic relationships and incomplete data. In particular, neglecting floodplain conveyance and uncertainties in the estimation of mean cross-sectional velocity and hydraulic water-surface slope may have led to underestimation of peak discharges in some studies. Estimates of flood peaks below the Q50 level (currently 312 m³ ∙ s-1) are inconsistent both with the documented extent of damage within the built-up area of Opava and in settlements further downstream as far as Děhylov profile, and with the preserved flood marks. Likewise, the peak discharge value of 290 m³ ∙ s-1 reported by Kříž et al. [11] as the minimum estimate within their range of values may also be regarded as underestimated. Modern hydrodynamic modelling tools, which make it possible to explicitly incorporate the morphological and hydraulic parameters of floodplain areas and the numerical solution of flow in 1D and 2D, represent a substantial advance in this respect and offer the possibility of refining historical estimates. Conversely, the combination of extreme precipitation totals, high antecedent catchment saturation, and the historical state of the river network indicates an event approaching extremes with a very low probability of occurrence.
An interesting aspect is the comparison of the 1903 flood with the floods of 1997 and 2024. Although the present-day landscape differs substantially from that of the Opava basin at the beginning of the 20th century – among other things in terms of forest cover, the higher proportion of built-up areas and technical river regulation works, and the presence of water reservoirs on Moravice – the influence of these historical differences gradually diminishes once the infiltration or retention capacity of the landscape is exceeded by extreme precipitation, and surface runoff becomes dominant. Under such conditions, it is more appropriate to focus on the fluvial component of flood dynamics and on the historical state of river channels, the influence of millraces and other historical hydraulic structures, and especially the morphology and transformation of built-up areas within floodplains, which may represent an interesting subject for further research. These factors also support the initial hypothesis that, during such extreme events, the dominant role is played primarily by meteorological forcing together with the morphometric and hydrological characteristics of the catchment.
The results of this discussion also underline the importance of historical floods for present-day water management planning. The 1903 flood played an important role in historical considerations of flood-protection measures, and its more detailed quantitative reconstruction may, among other things, contribute to a more objective assessment of the design parameters of water-management structures and measures, such as Nové Heřminovy reservoir, as well as to a better understanding of the actual flood risk in the Opava River basin.
CONCLUSION
The flood of July 1903 in the Odra and Opava basins undoubtedly represents an extreme hydrological event whose quantitative description is subject to considerable uncertainty arising from the absence of direct discharge measurements, incomplete information on hydraulic conditions, and substantial changes in the morphology of river channels and floodplain areas since the beginning of the 20th century. Nevertheless, the analysis of historical sources in combination with the results of rainfall–runoff and hydrodynamic modelling makes it possible to determine a realistic range of potential peak discharges and the course of the flood wave. The results of the rainfall–run-off simulations confirm the key role of extreme two-day precipitation totals and the degree of antecedent catchment saturation; under such conditions, the retention capacity of soils becomes rapidly saturated and the importance of differences in land use decreases. At the same time, the modelling results show that approaches based exclusively on simple antecedent precipitation indices or simplified empirical relationships frequently lead to errors in the estimation of peak discharges and flood-wave volumes. In this context, hydrodynamic modelling in 1D and 2D environments appears to be an essential tool for the reconstruction of historical floods, since it makes it possible to incorporate floodplain conveyance, the spatial variability of flow velocities, and the influence of local channel constrictions, bridge structures, and historical millraces. These factors may have had a crucial influence on water levels within the built-up areas of settlements during the 1903 flood (particularly in Opava and Kravaře) and help to explain the discrepancy between some earlier discharge estimates and the documented extent of inundation. The modelling scenarios also indicate that the 1903 flood probably exceeded the characteristics of commonly considered design events (e.g. Q₅₀) and approached extremes with a very low probability of occurrence (generally Q100 and above). These conclusions are consistent both with the preserved flood marks and with qualitative descriptions of the extent of damage contained in historical sources. Moreover, comparison with the floods of 1997 and 2024 shows that, during extreme precipitation events, catchments exhibit a typologically similar response regardless of differences in present-day land use (through the progressive increase in the proportion, ultimately leading to the complete dominance, of surface runoff within both direct and total catchment runoff), which represents another argument for the importance of hydrological modelling focused on extreme scenarios. In conclusion, it may be stated that the combination of historical data with GIS-based spatial analyses together with rainfall–runoff and hydrodynamic models represents an effective approach to improving the reconstruction of historical floods and to achieving a better understanding of their temporal and spatial characteristics. These findings are of direct relevance for present-day water management planning, particularly for the determination of design discharges, the calibration of extreme scenarios, and the professional assessment of the effectiveness of flood-protection measures in the Opava River basin.
Acknowledgements
The authors would like to acknowledge the support of the NAZV project No. QL24010054, Impacts of Climate Change on Small Forest Catchments and Possibilities for Their Mitigation through Forest Management and Water Management Measures, and the project Prediction, Assessment and Sensitivity Analysis of Selected Systems, the Effects of Drought and Climate Change in Czechia (PERUN) (No. SS02030040), without whose support the preparation of this article would have been considerably more time-consuming and complicated. The authors also wish to acknowledge the support of the Czech Hydrometeorological Institute’s DKRVO programme (Long-Term Concept for the Development of the Research Organisation for the Period 2023–2027), particularly research areas 6 and 12.
The Czech version of this article was peer-reviewed, the English version was translated from the Czech original by Environmental Translation Ltd.
