

ABSTRACT
Accurate and quick prediction of effluent Biochemical Oxygen Demand (BOD₅) is important for maintaining regulatory standards and improving the operation of wastewater treatment (WWT) plants. Traditional laboratory tests for BOD₅ take several days, causing delays in assessing water quality and adjusting plant performance. To overcome this issue, this study develops a machine learning model to estimate effluent BOD₅ using easily available plant data. A dataset from a large-scale wastewater treatment plant was used, comprising 12 variables from both influent and effluent data, such as pH, Chemical Oxygen Demand (COD), conductivity, Total Suspended Solids (TSS), BOD₅, and temperature, with effluent BOD₅ as the target variable. The data were cleaned and processed using the Interquartile Range (IQR) method to remove outliers, and new features were created to better reflect process behavior. Among several tested models, XGBoost showed the best performance, achieving an R² of 0.9695 and a Mean Squared Error (MSE) of 0.05, based on a time-based train/test split (80 % / 20 %). The study demonstrates that machine learning can serve as a powerful predictive tool for BOD₅ estimation, significantly reducing the five-day analytical lag of laboratory testing and supporting faster, data-driven decision-making in WWT management.
INTRODUCTION
The proper management and treatment of municipal and industrial wastewater are essential to preserve water resources and protect human and ecosystem health. Among the various parameters used to evaluate effluent quality, the Five-Day Biochemical Oxygen Demand (BOD₅) is one of the most widely adopted indicators. It reflects the amount of oxygen required by microorganisms to biologically decompose organic pollutants in water over a five-day period [1]. Because BOD₅ provides a direct measure of biodegradable organic load, it serves as a critical benchmark for assessing treatment efficiency and environmental impact. Consequently, regulatory authorities across the globe have established strict discharge limits to maintain acceptable BOD₅ levels in treated effluents [2].
Despite its importance, the conventional BOD₅ test has significant limitations. The standard method requires a five-day incubation period, delaying feedback on treatment performance and limiting the ability to make timely operational decisions [3]. Moreover, factors such as sample toxicity, nitrification effects, variability in microbial seeding, and preservation challenges can compromise measurement accuracy and reproducibility [4–7]. These drawbacks highlight the need for rapid, reliable, and continuous BOD₅ estimation methods.
Machine learning (ML) and soft-sensor modeling have emerged as effective tools for rapid BOD₅ estimation, enabling predictions from routinely measured operational parameters such as COD, pH, conductivity, temperature, and TSS [8, 9]. Unlike empirical or deterministic models [7, 8], which often fail under variable conditions due to the complex biochemical and hydrodynamic processes in full-scale wastewater treatment plants (WWTPs) [10, 11], ML approaches can capture nonlinear interactions and system dynamics, supporting proactive process control, early anomaly detection, and more sustainable plant operation.
Recent studies show that modern machine-learning methods can achieve very strong predictive performance for BOD₅ and other water-quality parameters. For example, Dantas et al. [12] demonstrated that artificial neural networks (ANN), which are computational models inspired by the way biological neurons process information, perform well when forecasting BOD₅ and COD in full-scale treatment plants. Zhang et al. [13] used a Random Forest model, an ensemble of many decision trees that collectively improve prediction accuracy, to estimate BOD5 in river water, achieving an R² of approximately 0.89. Jafar et al. (2022) [14] employed deep neural networks (DNN), a more complex form of neural-network architecture capable of capturing highly non-linear relationships and reported R² values between 0.89 and 0.93. Other studies have shown comparable results: XGBoost (short for Extreme Gradient Boosting) models, which use gradient-boosted decision trees, have reached R² values around 0.92 in ecological applications [15], while RVFL (Random Vector Functional Link) networks have achieved R² ≈ 0.924 in WWTP settings [16]. In contrast, simpler models often provide lower accuracy. For instance, Ali et al. [17] reported an R² of about 0.88 using CatBoost (Categorical Boosting), which efficiently handles categorical and numerical data with minimal preprocessing. It should be noted that linear regression models are not robust under varying wastewater treatment conditions, as they often fail to capture nonlinear interactions and complex system dynamics [18].
Accurate and timely estimation of the biochemical oxygen demand (BOD5) remains a persistent challenge in WWT, as traditional laboratory analyses require a five-day incubation period. This inherent delay limits the speed of process evaluation and prevents proactive operational control. To address this challenge, this study proposes a predictive framework leveraging the XGBoost algorithm, selected for its superior ability to handle high-dimensional data and non-linear relationships. By integrating a robust data-driven methodology with domain-informed feature engineering, the model seeks to accurately capture the complex dynamics of the treatment process under realistic operating conditions. The primary objective of this work is to provide a reliable alternative for rapidly assessing wastewater quality, thereby facilitating faster decision-making and enhancing wastewater management response. The following sections detail the methodology and model development process used to achieve these objectives.
METHODOLOGY AND MODEL DEVELOPMENT
Presentation site and data collection, area characteristics
The dataset used in this study was collected from the municipal wastewater treatment plant (WWTP) of Skikda Province, located in north-eastern Algeria (36.89°N, 7.01°E). The facility operates a medium-load activated sludge process designed to handle variable organic loads from domestic and municipal sources. The plant has a design capacity of 46,000 m³/day and serves approximately 279,700 population equivalents.
The treatment process includes preliminary screening, grit removal, primary sedimentation, biological oxidation in aeration tanks, secondary clarification, and final disinfection (see Fig. 2). The system is designed for an average influent BOD₅ load of about 280 mg/L, corresponding to 14,950 kg of BOD₅ per day, 34,383 kg of COD per day, and 17,250 kg of suspended solids (TSS) per day.
Treated effluent is discharged into the Oued Safsaf River, a sensitive water body that plays an important ecological role in the region. The produced excess sludge is dewatered and reused as an agricultural fertilizer, which highlights the need for reliable effluent quality control. Incomplete organic removal increases the amount of residual biodegradable matter, raising the moisture content and hindering drying, thereby reducing the quality of the final biosolid product.
Samples used in this study (2015–2024) were digitized from the WWTP’s historical archives. The dataset represents continuous monitoring of influent and effluent streams across all 12 months of each year. The monitored parameters included biochemical oxygen demand (BOD₅), chemical oxygen demand (COD), total suspended solids (TSS), pH, temperature, Electrical Conductivity, and dissolved oxygen (DO). All analyses were performed in accordance with the Standard Methods for the Examination of Water and Wastewater (APHA, 2017) [4].
Workflow and modeling strategy
This section delineates the development of a high-accuracy model for predicting effluent BOD5 in a WWTP. The approach uses real operational dataset we applied the XGBoost algorithm to optimize performance.
Domain-informed feature engineering was applied to enhance model accuracy, and a time-based train/test split (80 % / 20 %) ensured realistic evaluation. The pipeline includes data preprocessing (handling missing values and removing outliers), feature creation, model training, and evaluation using R2, MSE, and MAE. Fig. 1 illustrates the complete workflow, from raw data to final prediction, highlighting a data-driven framework for effluent BOD₅ estimation.

Fig. 1. Flowchart of the modeling pipeline for predicting effluent BOD5
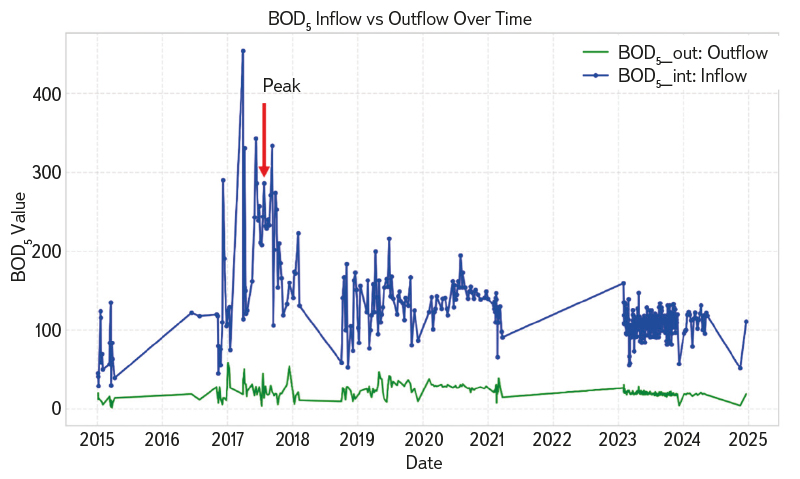
Fig. 2. Time series of BOD5 inflow and outflow showing consistent treatment performance despite significant fluctuations
Data collection, cleaning, and preprocessing
Data collection and initial screening
The dataset spans nine years (2015–2024) and includes 410 valid records, corresponding to an average of (3–4) measurements per month due to irregular sampling frequency. Each record contains 15 operational parameters measured at both the influent (inlet) and effluent (outlet) of the treatment process. These variables were selected based on their relevance to biological treatment performance and the availability of consistent data.
BOD5_out was selected as the target variable because it is the primary measure of wastewater quality. The standard 5-day test is considered too slow for active management; however, rapid estimation is facilitated by predictive modeling compared to conventional measurement methods. This allows problems to be caught early and the plant to be run more efficiently.
Fig. 2 illustrates the temporal trends for influent and effluent BOD₅ concentrations between 2015 and 2025. While influent levels (BOD5_int, blue) show significant volatility, peaking during 2017–2018 due to seasonal factors or hydraulic surges, the effluent levels (BOD5_out, green) remain stable and low from 2019 onward. This stability confirms consistent treatment efficacy despite variable influent loads. Data gaps in 2016, 2018, and 2022 resulting from sensor or logging issues were managed during the preprocessing phase.
Fig. 3 illustrates the relationship between influent and effluent BOD₅ values, highlighting the overall removal performance of the treatment system across a wide range of influent loads. A dense cluster of data points, where influent BOD₅ ranges from 80 to 180 mg/L and effluent concentrations remain between 10 and 47 mg/L, indicates consistent and effective organic load reduction across operational cycles. This corresponds to an estimated removal efficiency of approximately 74–88 %, as illustrated in Fig. 3 by the region bounded between the lines (y = 0,26x) and (y = 0,12x), which represent 74 % and 88 % removal, respectively. Notably, the majority of effluent BOD₅ values remain below the regulatory discharge limit of 35 mg/L, in accordance with the discharge limits established by Algerian environmental regulations [19]. The observed non-linear distribution reflects the inherent complexity of biological treatment processes, thereby supporting the application of advanced machine learning approaches for performance modeling. As shown in Fig. 3, several isolated data points deviate from the main cluster, exhibiting relatively high effluent BOD₅ concentrations despite moderate influent loads. These deviations are not random but likely correspond to transient operational disturbances, such as temperature fluctuations or hydraulic shocks (sudden increases in flow rate or organic loading), that affect microbial activity and treatment efficiency. They may also reflect measurement errors or temporary equipment malfunctions. Confirming the exact cause of these events is challenging, however, due to the absence of supplementary data such as detailed flow rates, rainfall records, ambient temperature, or on-site operational logs. Despite this limitation, the presence of such anomalies underscores the importance of rigorous data preprocessing, particularly for effluent BOD₅. It also highlights the need for adaptive modeling strategies capable of maintaining predictive accuracy under variable and non-ideal operating conditions.
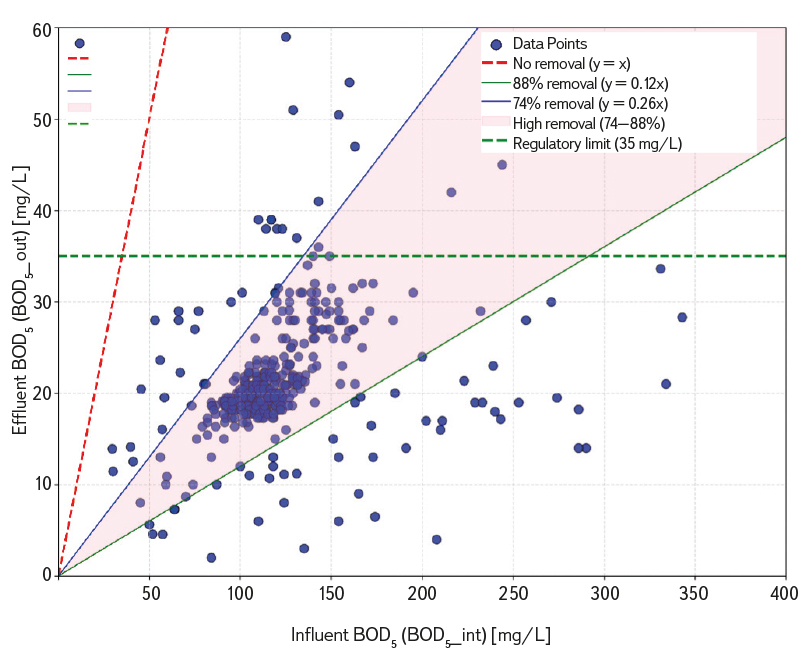
Fig. 3. Scatter plot of effluent versus influent BOD₅
The BOD5_int and BOD5_out histograms in Fig. 4 show right-skewed distributions, with most values clustered around central peaks (e.g. ~200 mg/L for BOD5_int) and a few high values extending to the right (> 400 mg/L). These extremes are not necessarily errors; they may reflect real events like industrial discharges or stormwater inflows. However, they require careful handling during preprocessing stage, since they can distort model training and affect its accuracy and credibility. A balanced approach was used: extreme values linked to actual disturbances were retained; isolated outliers were removed to ensure data quality.
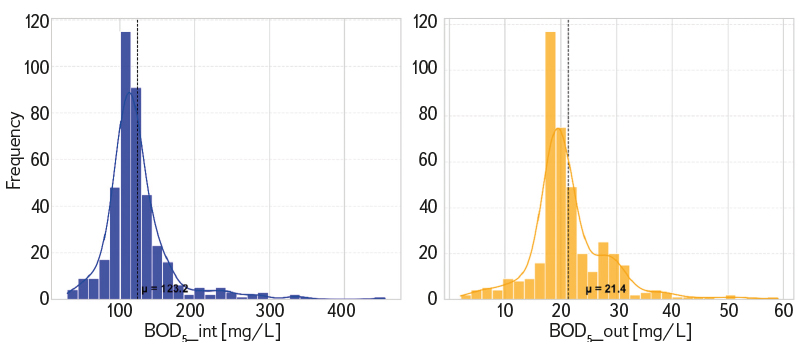
Fig. 4. Distribution of influent and effluent BOD₅ values between 2015 and 2024; there is a clustering around central values with right-skewed tails, which indicates the occurrence of rare, high-load events
Data preprocessing
Raw data exhibited missing values, inconsistencies, and outliers due to measurement and logging issues. A structured preprocessing pipeline was applied to enhance data quality, covering missing data treatment, outlier detection, and temporal alignment.
Handling missing data
The initial examination of the dataset revealed that missing values were represented by the symbol ‘/’, particularly in the dissolved oxygen variables (O2_int and O2_out). More than 62 % of the observations in these columns were missing, likely due to sensor downtime, maintenance activities, or intermittent data recording issues, rendering them unsuitable for reliable modeling. Keeping such variables would introduce significant bias or require heavy imputation, potentially distorting the true process behavior. Therefore, to preserve data integrity, both variables were removed from the analysis.
After replacing all ‘/’ entries with NaN and converting the remaining inlet (int) and outlet (out) measurements to numeric format, the other variables (pH, BOD₅, COD, TSS, temperature, and the recording date) were found to be complete with no missing values. It is evident that the number of variables has been reduced from 15 (the sampling date, 7 influent variables, and 7 effluent variables, as listed in Tab. 1) to 13 following the exclusion of Dissolved Oxygen (DO) from both the influent and effluent data. Moreover, no missing values were identified that required imputation. These predictors were therefore used directly in the modeling process.
It should be emphasized that dissolved oxygen (DO) is a fundamental operational parameter in activated sludge systems, as it directly governs microbial activity and nitrification efficiency [11]. Its exclusion from the present analysis was driven by substantial data loss exceeding 60 %, rather than by any diminished relevance of (DO) to the underlying treatment processes.
Tab. 1. Water treatment process monitoring data
| Features | Unit | Inflow | Outflow |
|---|---|---|---|
| Date | dd/mm/yy | Date | Date |
| Potential of hydrogen (pH) | – | pH_int | pH_out |
| Biochemical Oxygen Demand at 5 days (BOD5) | mg/L | BOD5_int | BOD5_out |
| Chemical Oxygen Demand (COD) | mg/L | COD_int | COD_out |
| Electrical Conductivity | μS/cm | Cond_int | Cond_out |
| Total Suspended Solids (TSS) | mg/L | TSS_int | TSS_out |
| Temperature (T) | ° C | Temp_int | Temp_out |
| Dissolved Oxygen (DO) | mg/L | O2_int | O2_out |
Outlier detection and removal
Outliers in the target variable, effluent BOD5 (BOD5_out), were identified using the Inter-Quartile Range (IQR) method, a robust statistical approach commonly applied in environmental data analysis [20]. The IQR is defined as:
where:
Q₁ and Q₃ represent the 25th and 75th percentiles, respectively.
Observations outside the following bounds were considered outliers:
For BOD5_out, Q1 = 18.18 mg/L and Q3 = 28.63 mg/L, yielding an IQR of 10.45 mg/L. Accordingly, the lower and upper thresholds were calculated to be 2.50 mg/L and 44.30 mg/L, respectively. Applying this criterion resulted in the removal of 53 extreme observations, including unusually high values (e.g., 59 mg/L) that were likely attributable to measurement errors or occasional process disturbances. This reduced the dataset from 410 to 357 samples.
Next, rows containing missing values in either the target variable or key predictors were excluded. The final curated dataset for modeling consisted of N = 357 complete samples. As shown in Fig. 5, these preprocessing steps improved the symmetry and reduced the spread of the distribution, thereby strengthening the robustness and generalizability of the predictive models.
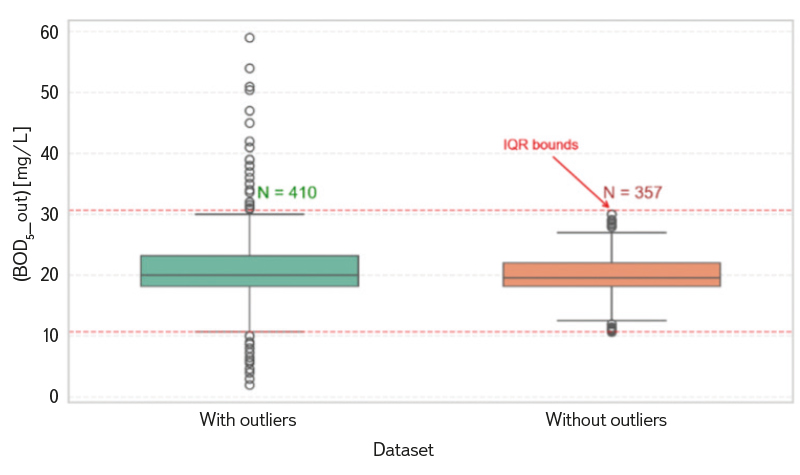
Fig. 5. Box plot comparison of BOD5_out before and after outlier filtering
Temporal Alignment of Data
The data column was parsed into a datetime format and used to sort the dataset chronologically. This approach was adopted to ensure the preservation of temporal dependencies, thereby facilitating the validation of the model’s realism.
Feature expansion and target selection for improved prediction
When developing the machine learning model, it became apparent that the initial dataset contained insufficient features to achieve high predictive accuracy. To address this limitation, we expanded the feature space through targeted engineering, carefully selecting the most relevant input and output features. This section outlines the process of generating new features and defining the target variable to improve model performance.
Selection of feature and target variable
In predictive modelling, all available system parameters may be considered as candidate inputs, but not all contribute equally to performance. Selecting and engineering informative features is therefore essential, as irrelevant variables can reduce accuracy [21]. To improve predictive capacity, the effluent outlet parameters were also integrated as inputs, a strategy shown to enhance accuracy in similar applications.
Fig. 6 displays the Pearson correlation matrix, showing the linear relationships among operational variables in the dataset. Strong positive correlations (red) indicate variables that increase together (e.g., COD_int and BOD5_int), while negative correlations (blue) show opposite trends. As expected, influent BOD₅ and COD display a strong positive correlation (r = 0.84), and effluent BOD₅ and COD are also highly correlated (r = 0.76). Temperature and TSS_int show weak correlations with other variables, suggesting they have little impact on short-term BOD₅ changes. Temperature (Temp_int, Temp_out) and suspended solids (TSS_int) exhibit weak correlations with the remaining features (Fig. 6). However, these variables were retained to capture subtle influences on biological oxygen demand (BOD5) and enhance model precision. This brings the total feature count to 13 variables for the final model architecture.
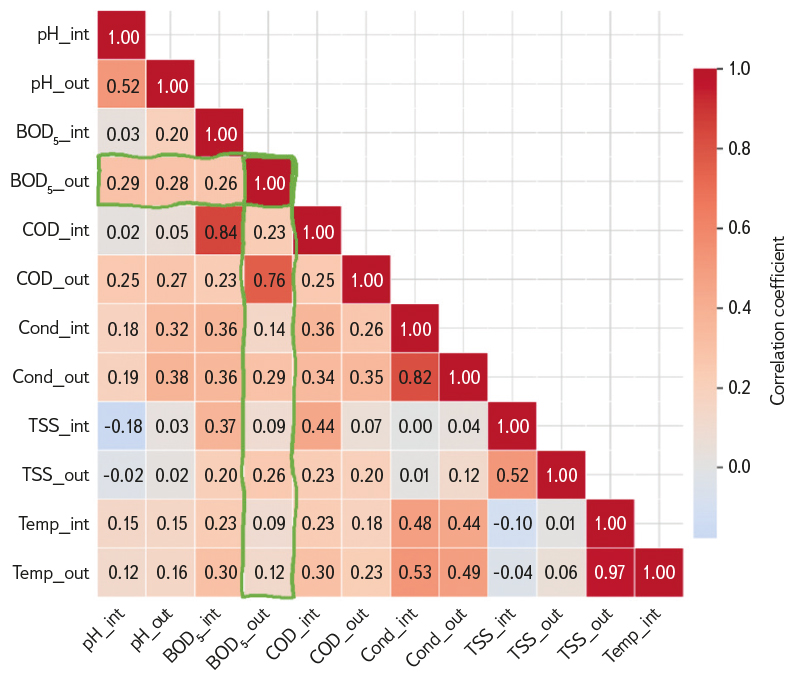
Fig. 6. Pearson correlation matrix
Feature engineering: creating new predictive input
Feature engineering transforms raw data into informative variables that enhance model interpretability, predictive performance, and generalization [20, 21]. Guided by WWT principles, domain-informed features were derived to better capture treatment dynamics. Six additional features were engineered: removal efficiencies, ratios, and rate-of-change indicators. This expanded the initial 13-variable set to a total of 18 variables, excluding the sampling date. Preliminary evaluation confirmed that these domain-specific variables improved model accuracy, particularly for process control tasks. All engineered features are summarized in Tab. 2, including their mathematical definitions and physical interpretations. Each feature was validated for physical plausibility and analyzed for its correlation with the target variable, BOD5_out.
Tab. 2. Engineered features and their mathematical descriptions
| Engineered Feature | Formula | Notes |
|---|---|---|
| COD_removal_eff | COD_int – COD_out / COD_int (4) | Efficiency of COD removal; higher values mean better pollutant reduction. |
| pH_change | pH_out – pH_int (5) | Difference in pH between influent and effluent, showing neutralization effects. |
| COD_BOD5_ratio_int | COD_int / BOD5 _int (6) | COD/BOD5 ratio at the inlet; high values indicate low biodegradability. |
| COD_out_BOD5_int_ratio | COD_out / BOD5 _int (7) | The COD/BOD₅ outlet/inlet ratio indicates how treatment affects biodegradability and how much pollution remains compared to the input. |
| BOD5_int_pH_int | BOD5 _int × ph_int (8) | Models how pH levels influence the ability of bacteria to break down organic matter (BOD5 ). |
| Cond_ratio | Cond_out – Cond_int / Cond_int (9) | The total increase or decrease in conductivity (Cond_int, Cond_out) from inlet to outlet. |
Train/test split strategy
Because the dataset spans nearly a decade (2015–2024) and contains sequential time-stamped measurements, a time-based train/test split was applied to preserve temporal order and prevent data leakage. Unlike random splitting, which risks introducing temporal bias by allowing future data to influence training, this approach chronologically allocated the first 80 % of samples (286 observations, January 2015–December 2022) for training/validation and the remaining 20 % (71 observations, January 2023-May 2024) for testing, thereby simulating real-world deployment where models are trained on historical data evaluated on feature periods [22, 23].
This approach evaluates the model under realistic forecasting conditions that capture both seasonal variation and long-term operational trends. The performance metrics used in this study, including R² (which indicates how much of the variability in effluent BOD₅ the model can explain), MSE (which highlights the presence of large prediction errors), and MAE (which reflects the average deviation between predicted and measured values), therefore provide a meaningful picture of the model’s true predictive ability. By strictly separating the test data from the training and tuning phases, the evaluation remains unbiased and representative of real-world deployment.
Selected model: XGBoost architecture and hyperparameters
XGBoost (Extreme Gradient Boosting) was selected for its high computational efficiency and superior performance in handling non-linear biological data. It is a highly optimized implementation of gradient boosting that combines decision trees in an additive manner, using gradient descent to minimize prediction error. It enhances training efficiency and model performance through:
- Second-order gradients (Hessian-based optimization), enabling faster convergence,
- Built-in L1 (Lasso) and L2 (Ridge) regularization to control complexity and reduce overfitting,
- Column and row subsampling to improve generalization.
Due to its robustness, speed, and high predictive accuracy, XGBoost has become a leading algorithm in machine learning competitions (e.g., Kaggle) and real-world applications across engineering, finance, and environmental sciences [24–25].
In this study, the XGBoost model was trained using the following hyperparameters:
- n_estimators = 200: number of boosting rounds (trees),
- learning_rate = 0.05: step size shrinkage to prevent overfitting,
- max_depth = 5: limits tree depth to balance model flexibility and interpretability,
- subsample = 0.8: uses 80 % of samples per tree to introduce randomness and improve robustness,
- colsample_bytree = 0.8: randomly selects 80 % of features at each split, enhancing diversity,
- reg_alpha = 0.1, reg_lambda = 0.1: applies mild L1 and L2 regularization to penalize large coefficients.
These parameters were selected based on prior experimentation and align with best practices for regression tasks. The model was implemented using the xgboost Python library (version 1.7.6).
Performance evaluation metrics
The predictive performance of the models was assessed using three standard regression metrics: Mean Absolute Error (MAE), Mean Squared Error (MSE), and the Coefficient of Determination (R2). The mathematical definitions are as follows:
where:
yi is the observed BOD5_out value
ŷi the predicted value
ȳi the mean of the observed values
n the number of samples in the test set
MAE measures the average magnitude of prediction errors, treating all deviations equally and providing a clear and intuitive indicator of overall accuracy. It is widely used for its interpretability, particularly in environmental and geospatial modeling. MSE, by squaring each error before averaging, assigns greater weight to large deviations, making it effective for detecting models prone to producing substantial outliers [26]. R² complements these metrics by indicating the proportion of variance in the target variable explained by the model, a value close to 1 reflects a strong fit, whereas lower values indicate weaker explanatory capability. All performance metrics were calculated on the held-out test set (January 2023–May 2024), ensuring an unbiased assessment of the model’s generalization ability.
RESULTS AND DISCUSSION
This section presents the performance of the individual base models and the stacked ensemble in predicting effluent BOD5 (BOD5_out). The analysis includes quantitative results, visualizations, and contextual interpretation to highlight the model’s accuracy, robustness, and practical relevance.
Model performance analysis
The predictive performance of the XGBoost model was evaluated after rigorous data cleaning and feature engineering. From the initial dataset, 357 high-quality samples remained for analysis, which were partitioned into a training set (n = 286) and a test set (n = 71).
The model was constructed using 18 features, comprising both raw sensor measurements and engineered indicators such as removal efficiencies and COD/BOD₅ ratios. Of these, 17 features served as input variables, including 11 original influent and effluent parameters and 6 engineered variables. The remaining variable (BOD₅_out) was designated as the target output. Performance metrics for the test dataset are summarized in Tab. 3.
The results demonstrate a high degree of predictive accuracy. An R2 of 96.95 % suggests that the model effectively captures the non-linear dynamics of the treatment process. The low MAE (0.146) is particularly significant, as it indicates that the model’s average prediction error is negligible relative to the regulatory limits of BOD5.
Tab. 3. XGBoost performance metrics for BOD5 prediction
| Metric | Value |
|---|---|
| Mean Squared Error (MSE) | 0.05 |
| Mean Absolute Error (MAE) | 0.146 |
| Coefficient of Determination (R2) | 96.95 % |
Fig. 7 shows the close alignment between actual and predicted BOD₅ levels. The model accurately tracks both stable periods and fluctuations, maintaining high precision even during high-load events. This performance exceeds results in previous studies [13–16]. Additionally, our use of time-based validation ensures the model is reliable for real-world operations and free from data leakage.
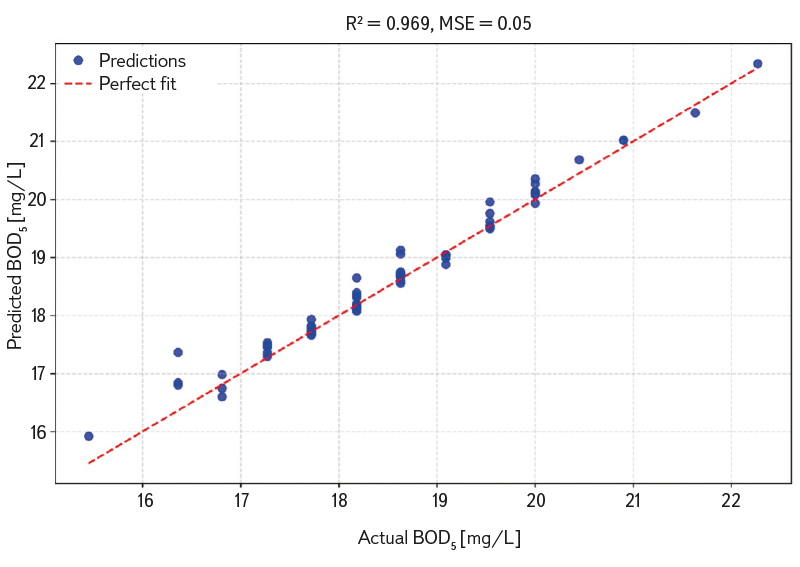
Fig. 7. Actual vs. predicted BOD5_out values; the red dashed line represents perfect prediction (y = x)
Feature importance and process insights
The inclusion of a total of 17 features was pivotal to the model’s success. Specifically, the integration of domain-informed features, such as COD_removal_eff, COD_out_BOD5_int_ratio, BOD5_int_x_pH and the net change in conductivity Cond_ratio, (equation 4, 7, 8 and 9 in Tab. 2), provided the model with deeper context regarding the biological health of the system. The low MSE (0.05) further confirms the model’s stability, showing that it does not produce large, erratic errors (outliers).
This robustness is critical for dependable monitoring under operational conditions, as it allows plant operators to trust the predicted effluent values for proactive process adjustments.
Temporal prediction accuracy
Fig. 8 illustrates the temporal evolution of actual versus predicted BOD₅ over the test period. The model accurately tracks the dynamic behavior of the treatment process, including short-term spikes and gradual trends. Despite minor fluctuations, the model swiftly recovers and continues to provide precise tracking. Residual analysis further confirms stable performance. As shown in Fig. 9, residuals are randomly distributed around zero, with no visible trend or increasing variance over time. This indicates homoscedastic errors and the absence of structural bias, both of which are essential properties for reliable deployment in real-world monitoring systems.
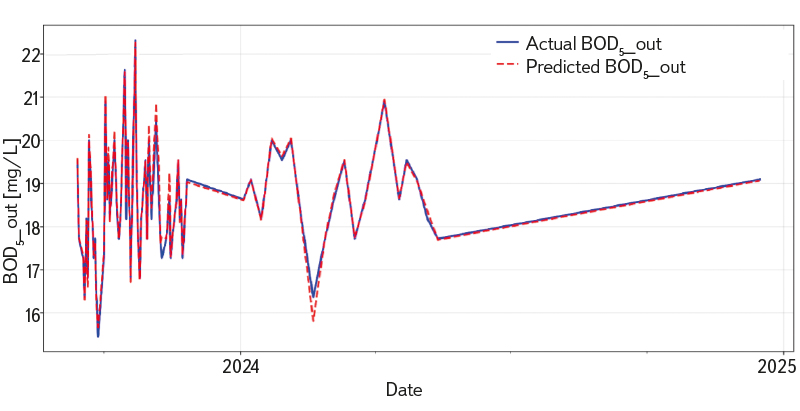
Fig. 8. Temporal comparison of actual and predicted effluent BOD₅ over the test period
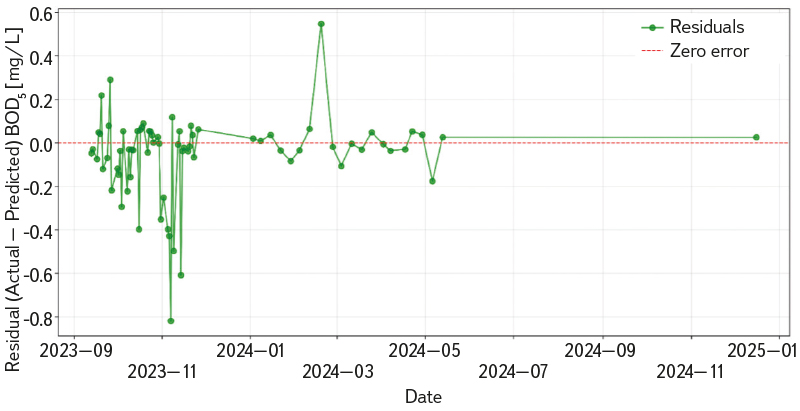
Fig. 9. Residuals over the test period; errors are centered around zero, with no systematic drift
Comparison with literature
Tab. 4 compares the performance of this study with recent works on BOD5/COD prediction in WWTPs. Our model outperforms several existing approaches in terms of R². Notably, many previous studies used random train/test splits, which may lead to inflated performance estimates due to temporal leakage. In contrast, this study employs a strict chronological split (80 % / 20 %), preserving the time-series nature of the data and ensuring its generalizability under real deployment scenarios. In contrast, our model provides high accuracy while using strict validation procedures and ensuring full reproducibility.
Tab. 4. Comparative performance of BOD5 prediction models in recent literature
| Study | Method | R² [%] |
|---|---|---|
| Zhang et al. (2025) [13] | Random Forest | ~89 % |
| Jafar et al. (2022) [14] | Deep Neural Network | 89–93 % |
| Sethy et al. (2025) [15] | XGBoost | ~93 % |
| Ali et al. (2025) [17] | CatBoost | ~88 % |
| This study | XGBoost (time-split) | 96.95% |
Generalizability and transferability considerations
Despite the strong performance achieved at the study site (R² = 0.9695), the model’s applicability beyond this context remains constrained by its reliance on site-specific training data. Predictive performance is strongly influenced by local influent characteristics, operational conditions, and environmental factors embedded in the training dataset. Consequently, reliable performance is expected primarily for facilities with similar process configurations and operating regimes.
Factors limiting the model’s transferability include variations in influent composition, hydraulic loading, and process design (e.g., aeration strategy, sludge age, and nutrient removal stages), as well as regional conditions such as climate variability and industrial discharge profiles. Applying the model to plants with substantially different characteristics without recalibration may result in reduced accuracy or increased uncertainty. Additionally, the model is primarily suitable for medium-load operations and may not be directly applicable to low-load treatment plants.
Future work should focus on multi-site validation and the integration of domain adaptation or transfer learning techniques to enhance model robustness and enable broader deployment across diverse wastewater treatment systems.
CONCLUSION
This study demonstrates that a standalone XGBoost model can achieve highly accurate prediction of effluent BOD₅ (BOD5_out) using nearly a decade of operational data (2015–2024) from a full-scale WWTP. With an R² of 96.95 %, MSE of 0.05, and MAE of 0.146 mg/L on a chronologically held-out test set, the model delivers exceptional performance while avoiding the complexity of ensemble fusion strategies.
Crucially, this level of accuracy was achieved through a combination of domain-informed feature engineering, including COD removal efficiency, pH variation, and COD/BOD₅ ratios, together with rigorous time-based validation that ensures realistic evaluation under forecasting conditions.
Despite the absence of dissolved oxygen from the dataset, the model maintained strong predictive performance, indicating that routinely monitored variables such as effluent COD, conductivity, and influent pH captured sufficient information about process conditions and biological activity. Consequently, while the fundamental importance of DO in treatment kinetics remains undisputed, these findings indicate that highly correlated operational parameters can partially mitigate the absence of direct DO measurements in predictive modeling.
More importantly, the model acts as a practical sensor, providing nearly instantaneous estimates of BOD₅ from direct measurements. By replacing the 5-day laboratory delay with instant predictions, it turns BOD₅ from a static compliance value into a useful control variable. This allows:
- Early detection of process upsets: Continuous BOD₅ prediction enables early detection of abnormal biological performance caused by load variations or hydraulic disturbances, allowing timely operational interventions before effluent quality deteriorates.
- Optimization of aeration energy use: Predicted BOD5 allows for precise aeration control, ensuring oxygen supply matches organic load. This eliminates energy waste from over-aeration while maintaining high process performance.
- Proactive adjustments to maintain regulatory compliance: Anticipatory BOD5 forecasting enables preventive operational adjustments when predicted values approach discharge limits. This ensures consistent regulatory compliance, thereby avoiding heavy fines as well as environmental and economic damage.
In summary, this study shows that a straightforward model can still achieve excellent accuracy. With proper data handling and domain knowledge, a tuned XGBoost model can equal or surpass more complex methods while remaining faster, easier to interpret, and simpler to deploy. This makes it a strong option for scalable wastewater management applications.
This paper has been peer-reviewed.
