Tento článek je pouze v angličtině.
Summary
Flood risk of levee protected areas stems from the possibility of levee failure due to overtopping, breaching or uncontrolled seepage. In most cases, levee breaching leads to highest damages as such events occur suddenly and can hardly be forecasted. In this article, levee failure is referred to levee breaching only. Whenever levees break during flood events, the reasons and processes of failure are of main interest in subsequent investigations. Within such surveys extensive levee data is gathered. In this article, a multivariate, statistical model, called levee failure logit model (LFLM), is presented that allows the utilization of such data to assess the reliability of levees. Thus, the failure probability of a levee section can be expressed numerically depending on its current load and its local conditions. The approach will be demonstrated with respect to the levee failures that occurred in the German federal states of Saxony and Saxony‑Anhalt during the floods 2002 and 2013 in the Labe catchment.

Introduction
Numerous extraordinary flood events that occurred in Middle Europe during the last twenty years seem to prove the IPCC’s climate change predictions of an increase of extreme hydrologic events in terms of frequency and intensity. Exemplarily, the return periods of the Labe (in German „Elbe“) floods at gauge Dresden (Saxony) were 100 to 200 years in 2002 and 50 to 100 years in 2013
with another major flood event in 2006. The European floods in 2002 with an overall damage of approximately 15 billion EUR (of which 9 billion EUR only in Germany) were probably the main drivers for the preparation and implementation of the EU Floods Directive in November 2007 requiring all member states to develop flood risk management plans for endangered regions until the end of 2015. These plans are incorporating technical as well as non‑technical measures. Regarding the technical measures, flood levees continue to be the most important flood mitigation structures. In this context, recent flood events revealed that long stretches of existing river levees need to be resurveyed, strengthened or reconstructed, since levees broke at many locations. In most cases, the higher discharges and water levels respectively exceeded the design conditions. However, a survey of levee failures during the 2002 flood in Saxony [1] showed, that levees also broke at sections that were considered safe according to the results of conventional levee stability computations. On the other hand, levees resisted at spots where such computations predicted failure for the given conditions. The reason for the aforementioned phenomena is the uncertainty deriving from [2]:
- the randomness of natural processes (natural uncertainty),
- measurement errors (data uncertainty),
- model simplifications and assumptions (model uncertainty),
- parametric errors (uncertainty in parameter relations, e.g. soil type vs. permeability),
- operational uncertainty (e.g. dens and tunnels of burrowing animals).
In many cases, the occurrence of inhomogeneities (structural, biological, soil‑mechanical or other) in a levee section triggers a failure process (fig. 1). As conventional stability computations that are usually conducted on basis of two‑dimensional, vertical finite‑element‑models do not incorporate the occurrence of such discontinuities, their suitability for reliability assessment of levees is questionable. To bypass some of these facts, the approach presented in herein is based on the collection and statistical evaluation of data from failed and non‑failed levee sections in order to predict a levee’s failure probability and to identify the main drivers for the failure. So far, the application of the approach is limited to (quasi-) homogeneous levees that had been in operation for many decades („old levees“) and do often not meet current design standards.
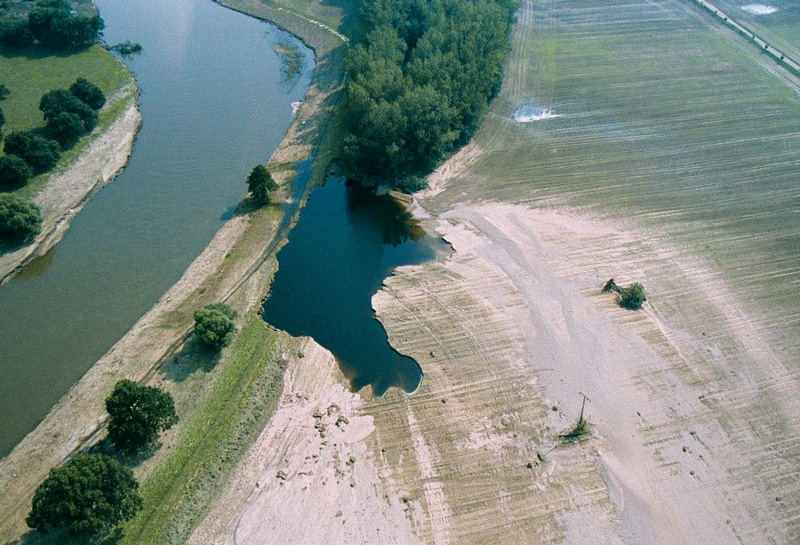
Fig. 1. Levee failure at the Mulde River (Saxony) during the flood 2002 (photo: Ott, 2002)
Obr. 1. Selhání hráze na řece Mulda (Sasko) během povodní v roce 2002 (fotografie: Ott, 2002)
Methodology
Levee failure databases
Whenever a levee fails during a flood event the question about the reasons for failure arises. In most cases, the failure process itself was neither observed (by eye witnesses) nor measured (e.g. saturation or deformation process). Moreover, the local conditions of the levee at the point of failure are unclear as there usually is a larger time gap between the date of survey and the time of failure. Thus, the only way to investigate the possible sources of the failure is to collect all data available for the levee section within a post event analysis. Aerial photographs and laserscanning data, taken from a satellite, a plane/helicopter or nowadays also from unmanned aerial vehicles (UAV) can be an important source of information, e.g. in order to identify the levee’s geometric properties, if the levee section was overtopped or if tree growth was present at the breach. Other conditions, such as the inner structure of the levee or the subsoil conditions, remain widely unknown, and can only be estimated by setting the properties equal to the levee sections adjacent to the breach. There are numerous examples where institutions or researchers stored the levee failure data in appropriate tables or databases [1, 3]. In the Czech Republic, levee failures during the flood 1997 were investigated in the Morava and Odra catchment [4, 5]. In many cases the data was used for basic descriptive statistics only and simple univariate statistical analysis was conducted. To the author’s knowledge, Uno et al. [6] were the first to analyse the failure data in a more sophisticated manner by utilizing data of failed and non‑failed levee sections in Japan for multivariate, statistical analysis by means of the logistic regression method.
Logistic regression
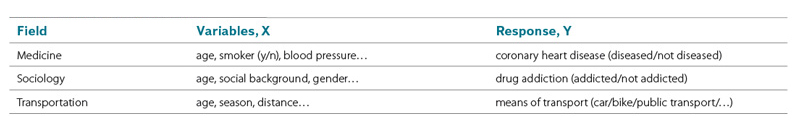
The method of logistic regression allows an exploratory data analysis, aiming for the identification of correlations between several parameters within a system. Although it has been widely used in the field of medicine, social science or economics it is not very common in engineering (table 1).
Table 1. Sample applications of logistic regression
Tabulka 1. Ukázka aplikace logistické regrese
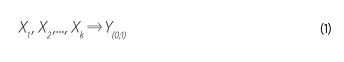
The application of logistic regression is preferable, whenever dependencies between several factors and observed events are undoubted, but the processes leading to the observation are uncertain. Regression models generally aim for the prediction of the outcome of a dependent variable (response variable), Y, given a set of influencing factors, Xi (equation 1). Although not compulsory, logistic regression is often used when the response variable has binary realisations (dichotomous variable), e.g. „failure“ or „non‑failure“ [7].
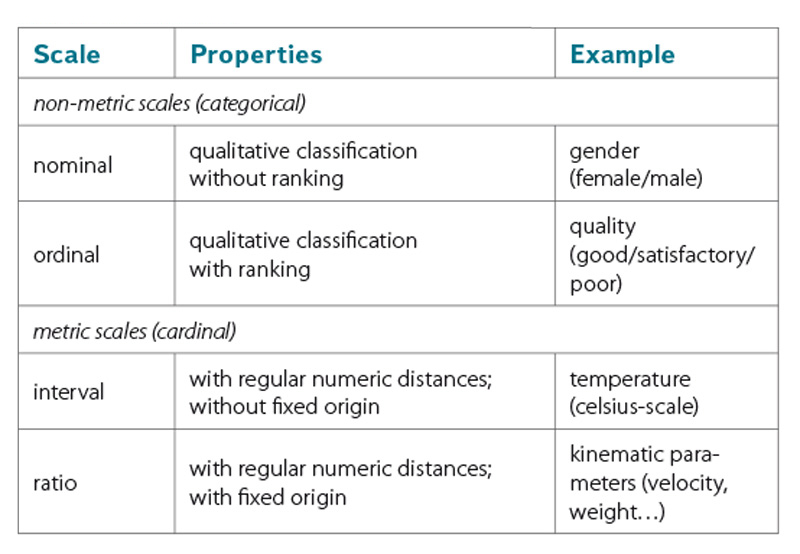
A specific characteristic of logistic regression models is the ability to combine variables of different scale levels. Metric‑scaled (cardinal) parameters are commonly used in engineering. Non‑metric (categorical) parameters can be subdivided in nominal and ordinal variables (table 2).
Table 2. Scale levels
Tabulka 2. Úrovně měření
Whenever regression parameters are linked linearly, we refer to generalised linear regression models. The link between the combined regression parameters X and the response variable Y is defined by a link function. In the case of logistic regression the logistic function is used (equation 2, fig. 2).
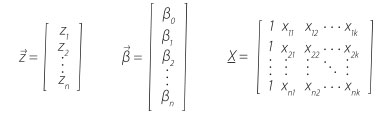
In this respect, P(z) represents the probability that the binary response variable Y has the realisation of y = 1. The logistic function is given in equation (2), belongs to the group of sigmoid functions. Since the functional values can be interpreted as probabilities in the range of 0 < P(z) < 1 its usage is popular in probability theory. Therefore neither certain, P(z) = 1, nor impossible, P(z) = 0, events will be predicted. Using this approach a logistic regression model computes the occurrence probability of an event P(z)y=1, depending on the value of the parameter z, which is often called „logit“. The logit z is an index that combines all regression parameters Xi by means of a linear sum. The logits of a data sample with n observations are calculated by using equation (3).
with:
Thus, the logit of the n‑th observation derives from:
| where | zn | is | logit for the n‑th observation, |
| β0 | constant, | ||
| βi | regression coefficient of parameter Xi, | ||
| xni | value of parameter Xi in the n‑th observation. |
While the values of the matrix X are the results of a levee survey, the values of ![]() will be determined within the model calibration using the maximum likelihood method. It is obvious that the applicability of a logistic regression model for a particular problem depends strongly on the data availability, on the structure of the data sample (number of failures and non‑failures) and on the selected set of regression parameters.
will be determined within the model calibration using the maximum likelihood method. It is obvious that the applicability of a logistic regression model for a particular problem depends strongly on the data availability, on the structure of the data sample (number of failures and non‑failures) and on the selected set of regression parameters.
General logit model considerations
The setup of a logistic regression model (logit model) for the reliability analysis of levees requires the availability of sufficient data for failed and non‑failed sections. Although it is desirable that data extend and data quality is equally good for both groups (failures and non‑failures) of the sample, the failure records usually have data gaps. Basically, there are two options to deal with such data shortcomings, which is either to disregard (= lose data) records or parameters with incomplete information in the logit model or to fill the gaps with assumed values (= add uncertain data). In the next step appropriate explanatory parameters Xi need to be selected from the data sample, which shall be included in the logit model in order to predict the value of the response variable Y. From a strict mathematical point of view, this can be done by a parameter reduction procedure, which is generally aiming for the quantification of the influence of each individual parameter Xi on the response Y. While for metric parameters a likelihood ratio test is often used, the significance of non‑metric parameters is analysed by contingency tables. In both cases, the χ2-test quantifies the significance of the parameter. Subsequently to the univariate significance tests, the significance of possible parameter combinations can be tested as well. More detailed information regarding possible variable selection strategies are given in [7].
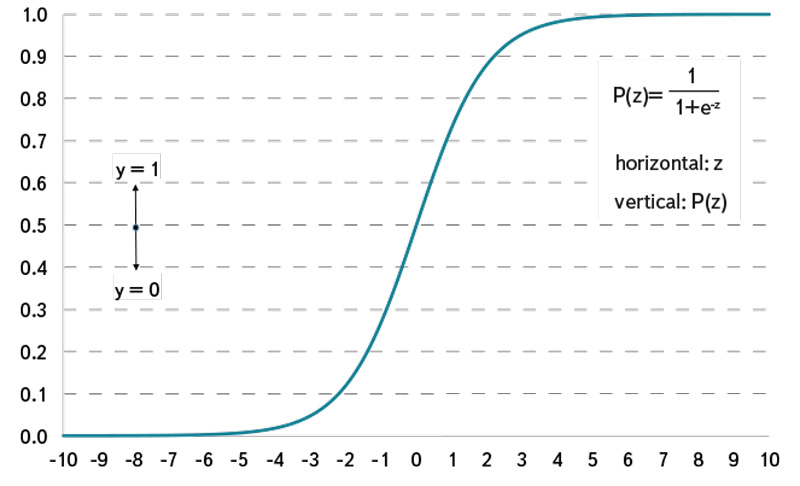
Fig. 2. Logistic function (cumulative density function)
Obr. 2. Logistická funkce (funkce kumulativní hustota)
While the setup of a logit model containing only a few most significant parameters might be appropriate e.g. for medical studies, a levee failure logit model needs to consider a larger number of influencing parameters, also in order to be accepted as a predictive tool in the engineering community. Thus, an alternative strategy of including all parameters that fulfil minimum data requirements was chosen, disregarding the univariate significance of the individual parameters. This means, that the model focuses more on the prediction of P(z) using all available information instead of identifying the parameters with the highest significance to the response. However, in this case, model overfitting may become an issue which may lead to a reduced predictive power of the logit model. As a rule of thumb, the number of explanatory variables within a logit model shall not exceed the tenth part of the smaller group’s number of records in the sample. Exemplarily, if there were 100 failure records within a data sample the maximum number of parameters to be included was 10.
Characteristic parameters of the levee failure logit model
As mentioned above, a crucial task in the setup of a levee failure logit model is the determination of the parameters that might trigger or affect levee failure. Experts agree that levees often fail at sections with inhomogeneities, which may have a biological or structural cause (fig. 3). Those parameters are usually only measurable on a categorical (non‑metric) scale (e.g. nominal: present/not present). While analytical approaches typically include only metric parameters (geometrical, geotechnical, mechanical,…), the proposed method can combine both, metric and non-metric factors.
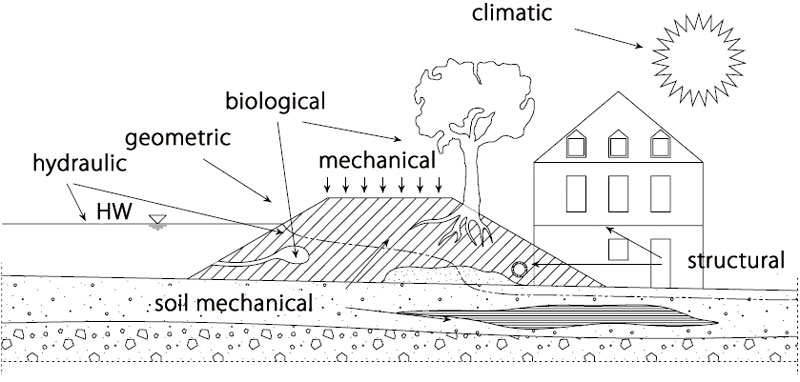
Fig. 3. Parameter classes and sources of inhomogeneities in levees
Obr. 3. Třídy parametrů a zdroje nehomogenity v hrázích
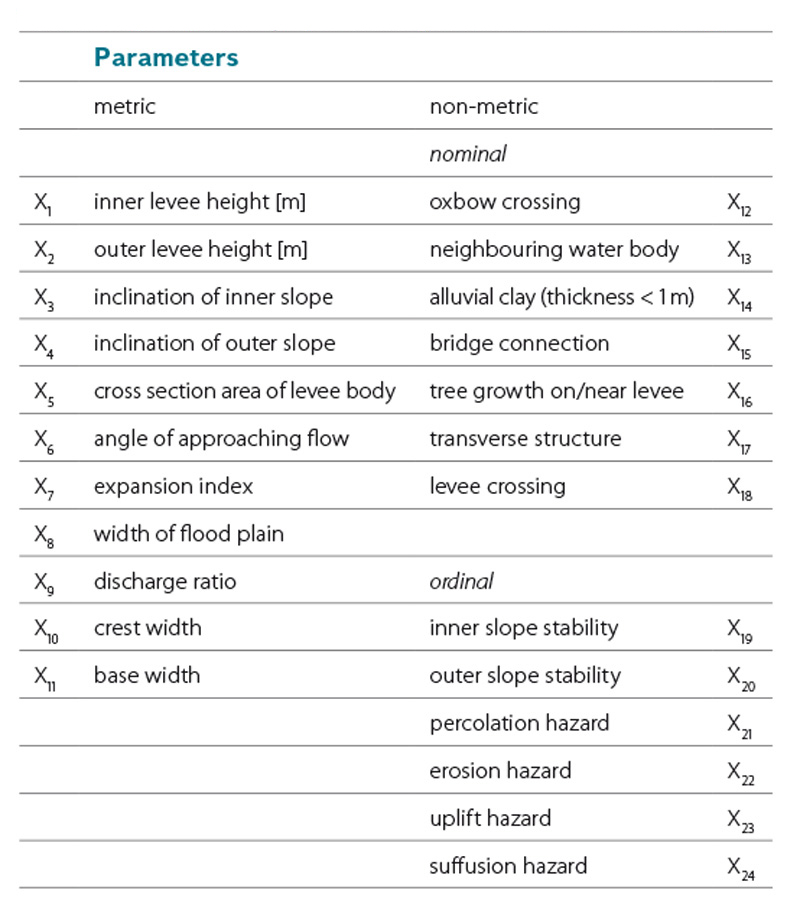
In [8] a logistic regression model for levee failure predictions was set up and calibrated using a training sample containing 648 records of levees in Saxony, most of them situated along the Mulde River. Further details about the model can be found in [9]. The original sample included 36 records of failed levee sections. In total up to 24 parameters (11 metric, 13 non‑metric) were investigated during the model setup (table 3). Within this set of parameters, the discharge ratio, the approaching flow angle and the width of the flood plain represent the hydraulic impact on each levee section. While the two latter factors are self‑explanatory, the discharge ratio is defined by the ratio of flood discharge to the bankful discharge at each section. Alternatively, a ratio of the water level and the levee crest height could be used as regression parameter, if both values were known. Thus, the uncertainty deriving from the possible dynamic change (e.g. seasonal change) of the local Q‑h‑relation could be reduced.
Table 3. Regression parameters in original levee failure logit model [8]
Tabulka 3. Regresní parametry v původním logistickém modelu selhání hráze [8]
Results and Discussion
The extraordinary flood event in 2013 gave the chance to test the levee failure logit model that was calibrated with data from 2002 flood (LFLM 2002), since numerous levee failures occurred. In the federal state of Saxony‑Anhalt 9 of the total 12 levee failures could be used for testing the logit model, although only 16 of the possible 24 regression parameters could be included [10]. The regression parameters that represent the results of the classic stability calculations (X19–X24) had to be neglected since there was no information available. In order to test the predictive power of the model, the records of the 9 failed levee sections where fed into the LFLM 2002, after the model was recalibrated for the included 16 regression parameters. In the next step, the records of the 9 failed levee sections were added to the training data sample, so the data set now contains 657 records in total with 45 records of failed levee sections. As the training data sample was extended, a recalibration of the LFLM could be conducted. The updated model is now referred to as LFLM 2013. The failure probabilities that where computed using the LFLM 2002 and LFLM 2013 for the 9 failed levee sections in Saxony‑Anhalt are summarised in table 4. Table 5 contains the regression coefficients for both models.
Table 4. Computed failure probabilities at levee sections, that failed during the 2013 flood in Saxony‑Anhalt
Tabulka 4. Vypočítané pravděpodobnosti selhání v sekcích hráze, které nevydržely záplavy v roce 2013 v Sasku‑Anhaltsku
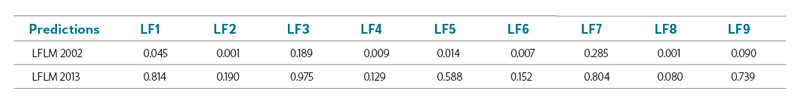
Assuming that a failure probability of P(z) > 0.5 predicts a levee failure (since a failure is more likely than a non-failure), it can be seen that none of the actual levee failures were predicted by the LFLM in the status of 2002. Thus, the LFLM in status 2002 could not be validated. However, if the records of the 2013 failures are included in the LFLM (status 2013), failure is now predicted for 5 of the 9 cases. This can be expected, as recalibration aims per se for a better fit of the model to the extended data sample. Table 6 and 7 summarise the predictions for the whole data sample (failed and non‑failed sections) for each model.
Table 5. Regression coefficients of the LFLM 2002 and LFLM 2013
Tabulka 5. Regresní koeficienty LFLM (logit model selhání hráze) 2002 a LFLM 2013
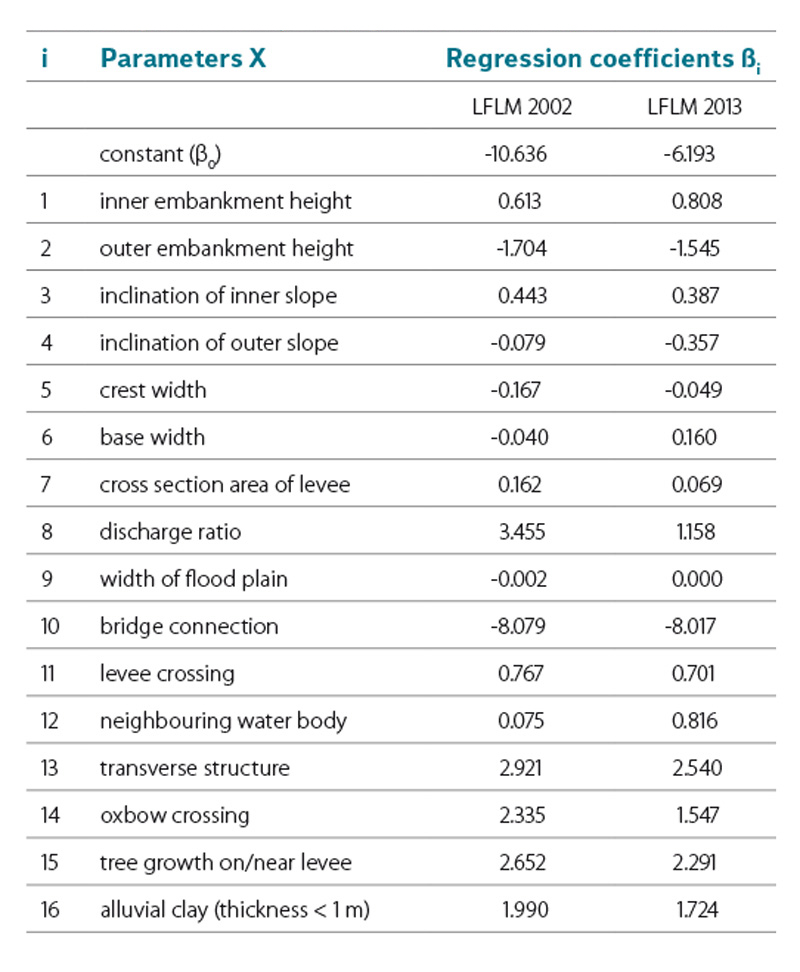
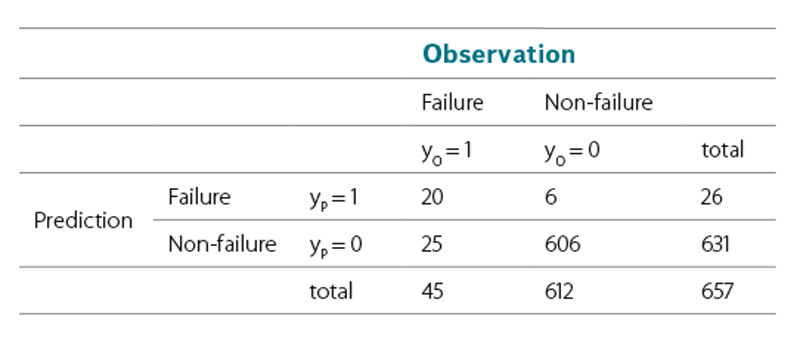
It shows that the updated model predicts 20 of the 45 observed failures correctly. In total 20 + 606 = 626 cases match the observed response of the levee sections, which leads to a hit ratio of 95.3% (626/657). Besides the ability of quantifying the failure probability section by section the determined regression coefficients are of main interest. In a simple consideration positive coefficients cause an increase, negative coefficients a decrease in the failure probability if the corresponding parameter is exclusively increased by one unit. This only holds true for regression parameters that are not correlated to each other, which is not the case in the LFLM (e.g. geometric parameters are strongly correlated). Referring to the nominal parameters, it shows that, exept for the parameter „bridge connection“, all coefficients are positive, stating that the presence of these attributes is leading to a higher probability of failure. Thus, it can be proven statistically, that e.g. tree growth on levees is forcing failure.
Table 6. Contingency table for the application of LFLM 2002
Tabulka 6. Kontingenční tabulka pro použití LFLM 2002
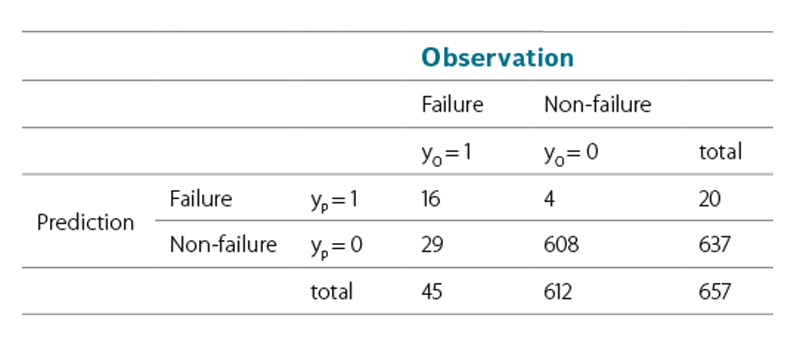
Table 7. Contingency table for the application of LFLM 2013
Tabulka 7. Kontingenční tabulka pro použití LFLM 2013
Conclusion
Due to the necessity of evaluating or even quantifying load dependent failure probabilities of levees section by section, the idea and the application of a levee failure logit model was demonstrated. One major advantage of the presented method is the possibility to account for influencing factors that undoubtedly affect a levee’s stability but cannot be expressed on a metric scale. The approach allows the incorporation of past event observations for predicting a levee’s reliability in future flood events. Perspectively, increasing the data sample with records of non‑failed and failed levee sections is desir-able in order to improve the predictive power and also the model’s quality from the mathematical point of view (e.g. to avoid overfitting).
An advanced LFLM could be used as a standalone approach for a rough regional reliability assessment of levees. As large levee surveys are planned or already under way (e.g. National Levee Database in the United States, [11]), in which comprehensive levee data will be acquired, it is expected that LFLMs might become more popular in the future. Finally, the idea of establishing a database administrating data from European levees (including levee failures) shall be put forward.
Thanks
The author would like to thank the State Reservoir Administration of Saxony and the State Authority for Flood Protection and Water Management Saxony‑Anhalt for supporting the research.
